Week 7: Beginning the Analysis

So much has already happened this week that I’m going to get ahead on my next post before the weekend starts.

When I returned from Willapa Bay, I thought everything was going to get back into routine, but no! Now that my foot is (mostly) better, I can get back into field work! After looking at our data from the fish traps in Willapa, our lab tech thought that although the traps we were using looked pretty much the same as the set of traps they used a couple years ago, they might be different enough that we cannot compare data between the two. This week, we set out to determine if the trap data is similar between the old and new traps by putting out several replicates of pairs of each along the shore next to the HMSC Visitor’s Center. Unfortunately, so far we have not caught very many fish, so we may not be able to tell, but hopefully we will put more out next week in a different location and see what we get.

This week was also my 21st birthday! A small group of friends came over to my house and we had a wonderful time. Despite the fact that our oven is not currently working, one of my housemates managed to make me a no-bake cake, which turned out to be delicious.

IMG_0228

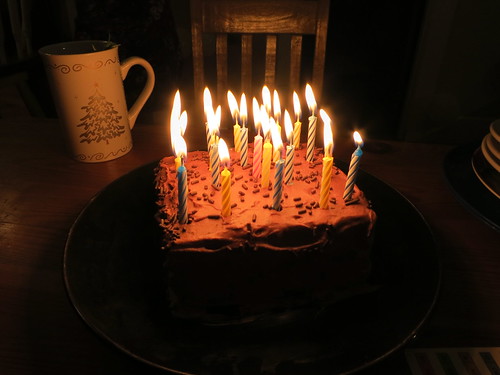
The no-bake cake my housemate made

I also managed to go diving with some friends off the South Jetty in Newport earlier this week. There was a good-sized group of us, so after a few issues with gear on multiple people, it was a short dive in which we kicked up a lot of sediment, but I still had a great time. For my birthday I got a new camera with underwater housing, so I was eager to try it out on the dive, but we couldn’t see much at the bottom. My best, but still not great, picture (below) was taken while we were still on the surface, in the shallows. I’m looking forward to another opportunity in which I can try out my camera.

IMG_0249

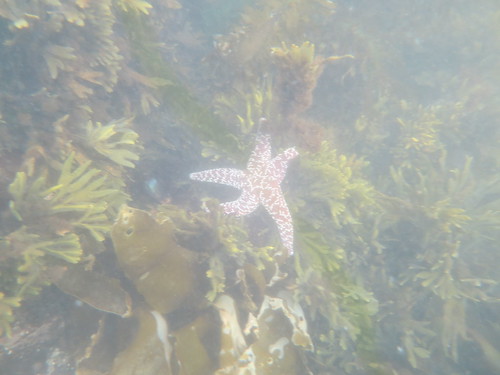
A sea star in the shallows in Newport

Last, but not least, I started analysis of the video we took with the GoPros in Willapa. I’ve gotten through one day’s worth of video so far (and seen about 200 fish), so it’s going to take me a long time. I hope we can finish the video analysis and start some statistics before my internship is over! I really want to see the data that I helped collect go through the process and come out with some results, in addition to getting some more practice using GIS and R.

I’m also taking a boat education course online so that I can drive the boat when we take more video here in Newport in Yaquina Bay, which should be happening next week. My workload is picking up quickly, but it’s all very exciting, and I can’t wait to see what these last couple weeks have in store for me.

field work, field work, and more field work

I have fallen a bit behind on this week’s blog post, due mainly because of my involvement in intensive field work projects. Although field work is what everyone is dreaming of when they are stuck in the office managing data, it does eventually wear you down physically and mentally. The first half of the week I embarked on the Ann Marie, a local fishing charter vessel, to conduct our first round of hook and line sampling in the Cape Perpetua area. The second half of the week I was down south along Port Orford where I was again performing hook and line surveys out of Red Fish Rocks Marine Reserve. I would wake up at a painful 4 am in order to get down to the docks on time and help load up the boat. Due to heavy winds that generally pick up in the afternoon, we aim for an early start in order to bypass the foul weather. Hook and line surveys are done according to a strict protocol that dictates the exact latitude and longitude, the duration, and the type of terminal gear rigged on each and every fishing rod.  This protocol is also used for hook and line sampling in both California and in Washington State, and with Oregon now on board, the methodology is now standardized across the entire west coast.

This protocol consists of delineating 500m2 cells within each marine reserve and comparison areas using ARC GIS. Local knowledge from fishermen is then incorporated into the GIS map, which highlight the best fishing reefs in each area. The areas are then stratified by depth and habitat type and all cells that are deeper than 24 fathoms or exhibit non rocky substrate are excluded from the GIS map. The 24 fathom mark was chosen in order to reduce fish mortality after release; rock fish mortality is compounded by the depth at which they are caught and brought to the surface. Non rocky habitat was excluded because as the name suggests, rock fish are generally only found in rocky habitat, so it is not worth the effort to fish in sandy bottom. Five cells are then randomly selected using a random number generator and each cell is fished for a total time of 45 minutes.

Now that you have an idea about the methodology, it may become apparent that this method is not one that is aimed at catching the most fish in the least amount of time.  The goal is to take a replicable and consistent approach that minimizes possible covariates, which can become a rather nuisance during analysis or create biases in the data. For example, if the duration of fishing in each cell (45 minutes) was not accounted for then our results would be skewed because, theoretically, more fish are caught the longer one is fishing for. However, like many ecological study designs, there are certain variables that can’t be controlled for.

Total catch in each cell varied widely, with some cells pulling in over 50 fish, while others had none. Differences in catch can be explained by a myriad of factors, most notably temperature, habitat, depth, and light. The ocean may exhibit slightly different conditions during any given day which cannot be easily controlled for. Light and temperatures sensors, however, are deployed at each cell which we can correlate during the analysis.

Most of my remaining time here will be spent helping in the hook and line surveys. These surveys will continue for another 2 months after my internship has ended, so unfortunately I won’t be involved in any of the analysis. These surveys are expected to continue every summer for the next 10 years.


Week Six

I cannot believe how quickly my summer here at Hatfield is passing. 

Since June I have distributed dozens of descending devices, I helped conduct interviews with charter boat captains and designed a survey that has been mailed to over 250 recreational anglers here in Oregon.  It’s been busy. 

For the past week or so I have been working on story boards that will eventually become a small video series on the issues surrounding rockfish conservation and how easy it is for all anglers to do their part by using a descending device. 

The “introduction” video describes why canary and yelloweye rockfish are sensitive to fishing pressure and how their bodies are affected by the sudden drop in pressure when they are reeled to the surface.   This video will then link up to “how-to” videos that offer more in depth information on how to operate the different types of descending devices and how by simply returning a fish at depth an angler can greatly increase its chances of long term survival. 

While the scripts are still in review, I have recruited the help of ODFW’s web developer to offer his expertise on formatting and planning the design of the final products so the videos are easy to use by our audience. Also he has offer his time and support all along the production process.  I know his help will be important for the process to go smoothly.  Thank you Bob!

Though, I am very excited that the videos are getting under way, I unfortunately will not be around for the filming and final editing as filming likely will not be able to take place until early September.  I am looking forward to seeing the finished products though and am grateful that I having the opportunity to work as a part of the team on such an important portion of the rockfish conservation project.