Introduction
I recently needed a way to integrate a charting utility into a Vue.js project of mine and needed to find a way to do so. I really enjoyed the flexibility of Chart.js, but at this time, there is no integrated implementation of Chart.js into v3 of Vue.js. I experimented with some npm packages with no luck. So it was time to get dirty and fake it until I made it work.
In this post, I will be showing a quick way to make a Chart.js component that can react to props for re-usability multiple times in your Vue.js projects.
Prerequisites
To complete this tutorial, you will need the following:
- Node.js and NPM package manager installed locally
- Basic Knowledge of Vue.js components (I recommend using the Vue CLI to create a project)
This tutorial is being prepared with Node v14.17.1, @vue/cli 4.5.15, npm 8.3.1, and Chart.js 3.7.0.
Step 1 – Creating Your Vue Project and Install Chart.js
Let’s create our project directory using Vue CLI and use default to use Vue 3
$ vue create vue-chart --default
Then let’s change to the directory.
cd vue-chart
Now, we can install Chart.js into our project using npm package manager.
npm install chart.js
At this point, we have created our vue-chart sample project and installed our Chart.js dependencies. Let’s get to the fun work now!
Step 2 – Create a Vue Chart Component
I will provide our sample data later in this tutorial, but lets immediately get into creating the Vue component that we can import to other components in our Vue application.
Under your src directory, you will have a components directory. You might notice it has the default HelloWorld.vue file if you used the Vue CLI as before in step 1. In this folder, create the file Chart.vue.
Now, we will want to properly format our component into what Vue likes to see including our template and script elements. We will also include the canvas element with a specific id that Chart.js relies on and import it into our component. It is also a good idea to wrap our canvas component into a div for Vue to properly operate.
<template>
 <div>
  <canvas id="chart-example"></canvas>
 </div>
</template>

<script>
import Chart from 'chart.js/auto';

export default {
  name: "Chart"
}
</script>
At this point, you have created the base Vue component. Now what? Well, we will need to add just a few more lines to allow Chart.js to do its thing and Vue to accept props from parent components.
Let’s first take care of props, Vue’s way of sending data to child components so we can make this truly reusable.
<template>
 <div>
  <canvas id="chartexample"></canvas>
 </div>
</template>

<script>
import Chart from 'chart.js/auto';

export default {
  name: "Chart",
  props: ['chartData']
}
</script>
chartData will be our general prop that we import to provide Chart.js the data it would like to create our graphs. The power of usability!
Now, our canvas chart element needs that linked to our prop. This is where a lot of functionally breaks down if we do not properly link them. For this, we are going to use vanilla JavaScript and DOM manipulation in conjunction with Vue’s mounted lifecycle hook to make sure it is updated when Vue renders our component instance.
<template>
 <div>
  <canvas id="chart-example"></canvas>
 </div>
</template>

<script>
import Chart from 'chart.js/auto';

export default {
  name: "Chart",
  props: ['chartData'],
  mounted() {
    const chart = document.getElementById('chart-example');
    new Chart(chart, this.chartData);
 }
}
</script>
Okay, we just added a lot there. What essentially is happening is during the mounted hook of Vue, the chart variable now points to our canvas element that Chart.js can use. This is all we have to do now for our component. If this is your first time making a Vue component, congrats! You just made your first reusable component in Vue!
Step 3 – Import Your Chart Component
At this point, we want to display our component on our Vue app. You will want to navigate to App.vue in the src directory. This is your main parent component if you are new to Vue. If you used Vue CLI, you will have a populated page. We do not need any of this. Let’s make some changes to App.vue by removing the “HelloWorld” component, import, and element to make sure we do not have any extraneous items.
<template>

</template>

<script>


export default {
  name: 'App',
  components: {

  }
}
</script>
Looks similar to our Chart.vue component base template right? Now let’s start importing our Chart.vue component.
<template>
  <Chart/>
</template>

<script>
import Chart from "@/components/Chart";

export default {
  name: 'App',
  components: {
    Chart
  }
}
</script>
Awesome! You now imported your created Chart.vue component to your parent component. Time to give it some data to create a chart now!
Step 4 – Feed Your Chart Some Data
You cannot have a chart without some data, so let’s build an object that we can feed our Chart.vue component to digest!
For Chart.js, when you make a chart object, it requires an internal data object that has arguments that can be populated. In the interest of time, I would recommend going through the Chart.js documentation to learn more, but because we built our Chart.vue component to be reusable, you can change anything! Line graph, bar graph, animated graph, doesn’t matter!
Now let’s use Vue’s powerful data() property to store objects and return data in conjunction with v-bind to send this chart internal data object through our prop earlier. For our chart data, I am just going to use the provided example on Chart.js.
<template>
    <Chart/>
</template>

<script>
import Chart from "@/components/Chart";

export default {
  name: 'App',
  components: {
    Chart
  },
  data() {
    return {
      chartObject: {
        type: 'bar',
        data: {
          labels: ['Red', 'Blue', 'Yellow', 'Green', 'Purple', 'Orange'],
          datasets: [{
            label: '# of Votes',
            data: [12, 19, 3, 5, 2, 3],
            backgroundColor: [
              'rgba(255, 99, 132, 0.2)',
              'rgba(54, 162, 235, 0.2)',
              'rgba(255, 206, 86, 0.2)',
              'rgba(75, 192, 192, 0.2)',
              'rgba(153, 102, 255, 0.2)',
              'rgba(255, 159, 64, 0.2)'
            ],
            borderColor: [
              'rgba(255, 99, 132, 1)',
              'rgba(54, 162, 235, 1)',
              'rgba(255, 206, 86, 1)',
              'rgba(75, 192, 192, 1)',
              'rgba(153, 102, 255, 1)',
              'rgba(255, 159, 64, 1)'
            ],
            borderWidth: 1
          }]
        },
        options: {
          scales: {
            y: {
              beginAtZero: true
            }
          }
        }
      }
    }
  }
}
</script>
And now, let’s use v-bind on our <Chart/> tag. This will take our parent component data and give it to our Chart.vue component. Essentially, the parent has the data, but doesn’t know how to make a chart; the child knows how to make a chart, but doesn’t have the data. We now get to combine them to complete it! (I am also going to wrap our Chart in a <div> so we can give it an inline style of max-width so our chart is manageable when we serve it.)
<template>
  <div style="max-width: 900px">
    <Chart :chart-data="chartObject"/>
  </div>
</template>
One thing to note if you are new to Vue bindings, our child element has the prop “chartData” if you remember from Step 2. How does this relate? Well, HTML inline attributes must be kebab-case so when you have to pass with a v-bind to a prop that is in the lowerCamelCase that Vue uses, Vue will automatically convert that from “chartData” to “chart-data” in this instance. Cool huh? More create and less syntax drama.
Alright, last step is next. Let’s see that creation!
Step 5 – Serve Your Chart!
At this point, everything will be connected and ready to serve! If you have a Vue background, you know the magic words, if not, go back to your terminal that has the project directory from Step 1 and enter the magic words.
$ npm run serve
Open up a browser to see your Vue application. By default, Vue will serve locally at port 8080.
http://localhost:8080/What you should see is this in your browser!
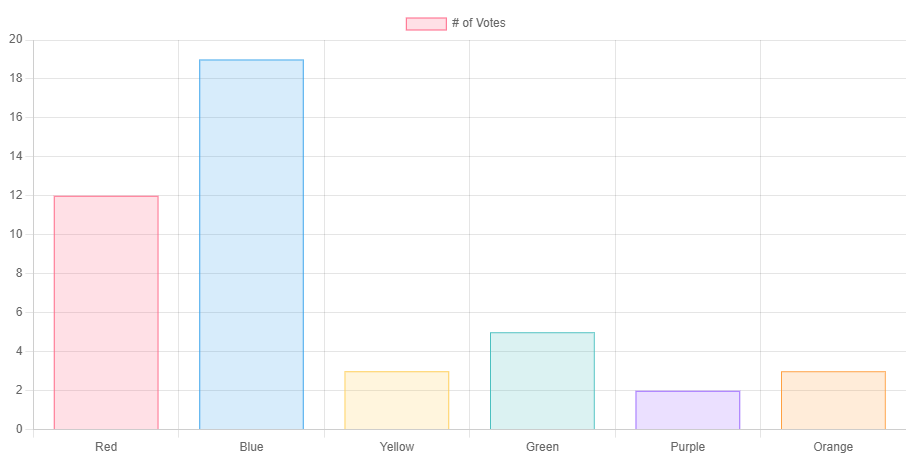
Our Vue application is alive! You have successfully made a reusable Vue component with Chart.js accepting any data prop you give it.
Conclusion
So what, you made a chart you might be thinking? Well, let me close on some hidden superpowers that your Chart component possesses. First, you get all the power of Chart.js that will not break as you build out your Vue application. It is isolated to its own component. Second, you can use Vue’s power of rendering to change the Chart without changing the web page! There are various conditions under which a component will re-render. I will link Michael Thiessen’s blog post on this topic. It has a lot of information on this for re-rendering a component. It will work directly with this if you want to start building methods on your parent component to alter data, say for a dashboard of some sort.
And there you have it! A quick and dirty way to integrate arguably the best chart Javascript library into your Vue.js 3 projects without Chart.js support out of the box!