This week I’ll focus on the quick dive I’ve done into the Skyfield Python library and a simple visual test I did to see if results for tracking the ISS matched the various satellite tracking webpages.
The Skyfield website has a great guide on how to track earth satellites in a couple different ways which is where these code snippets came from. First, you create a satellite object from TLE data, then use the various Skyfield functions to propagate its position, get its rise and set times, etc.
The first step was to get the TLE data for the ISS which Skyfield makes very simple with its load module. This module makes the API call to CelesTrak and returns a list of matching satellites.
n = 25544
url = 'https://celestrak.com/satcat/tle.php?CATNR={}'.format(n)
filename = 'tle-CATNR-{}.txt'.format(n)
satellites = load.tle_file(url, filename=filename)
satellite = satellites[0]
25544 is the NORAD ID for the ISS, but it can also be searched for by name.
The next step is to create a date object and set it to now, since we want to propagate satellite positions starting from the current time.
ts = load.timescale()
t = ts.now()
With the satellite and date objects, we can generate ephemeris for the ISS. Skyfield makes this exceedingly simple.
geocentric = satellite.at(t)The geocentric variable now contains the x,y,z position of the satellite relative to the Earth’s center in the Geocentric Celestial Reference System (GCRS) at the time contained in t. Right now at 6:32pm PST on April 14, 2022 the ISS is at about [-4238.11808253 -592.82098901 -5286.05509265] in the GCRS system.
For the purposes of plotting these positions on a map, Skyfield has a module called wgs84 (World Geodetic System) that will convert GCRS to latitude, longitude, and height.
lat, lon = wgs84.latlon_of(geocentric)
height = wgs84.height_of(geocentric)
With this system for generating a position for a specific time, we can simply repeat the satellite.at(t) call with an incremented time variable.
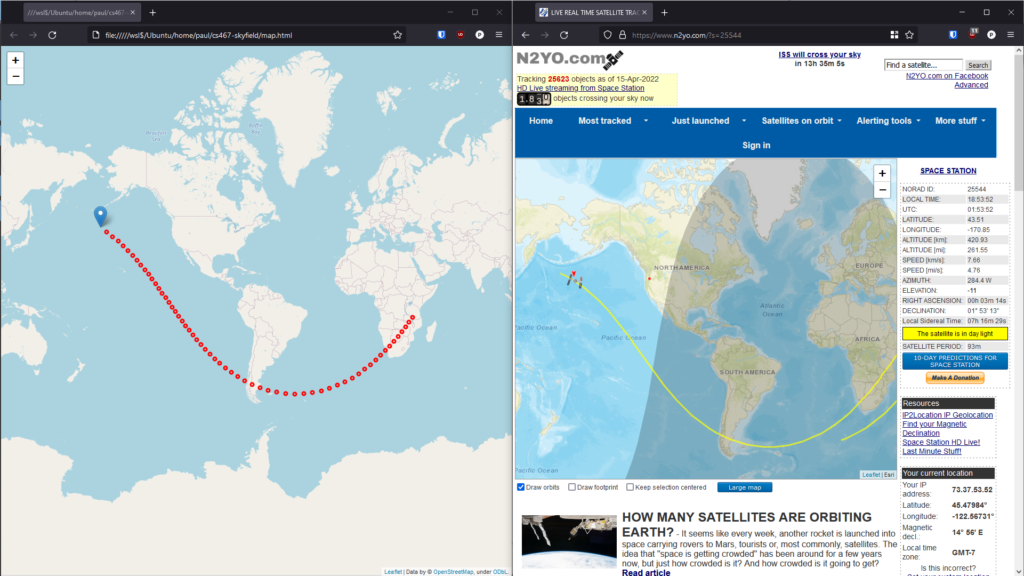
t += timedelta(minutes=1)The plotted Skyfield points seem pretty accurate when compared to n2yo.com.
The second Skyfield function I looked into was find_events. This function is called on a satellite object using an observer’s position, time frame (start/end), and an altitude. It will then calculate when the satellite with rise above the altitude, culminate, and set below the altitude. This example is taken directly from the Skyfield website.
# Find how many times the ISS rises over 30 degrees of altitude over a day
bluffton = wgs84.latlon(+40.8939, -83.8917)
t0 = ts.utc(2022, 4, 14)
t1 = ts.utc(2022, 4, 15)
t, events = satellite.find_events(bluffton, t0, t1, altitude_degrees=30.0)
for ti, event in zip(t, events):
    name = ('rise above 30°', 'culminate', 'set below 30°')[event]
    print(ti.utc_strftime('%Y %b %d %H:%M:%S'), name)
Results for events on April 14, 2022:
[<EarthSatellite ISS (ZARYA) catalog #25544 epoch 2022-04-14 17:38:40 UTC>]
2022 Apr 14 14:47:40 rise above 30°
2022 Apr 14 14:48:59 culminate
2022 Apr 14 14:50:18 set below 30°
2022 Apr 14 19:40:53 rise above 30°
2022 Apr 14 19:41:36 culminate
2022 Apr 14 19:42:19 set below 30°
2022 Apr 14 21:17:55 rise above 30°
2022 Apr 14 21:18:18 culminate
2022 Apr 14 21:18:42 set below 30°
Full scripts
Here is my full script for plotting one hour of future ISS positions on a map using Folium:
from datetime import timedelta
from skyfield.api import load, wgs84
import folium

# Create ISS TLE
n = 25544
url = 'https://celestrak.com/satcat/tle.php?CATNR={}'.format(n)
filename = 'tle-CATNR-{}.txt'.format(n)
satellites = load.tle_file(url, filename=filename)
print(satellites)

satellite = satellites[0]

ts = load.timescale()
t = ts.now()

# Create Folium map
output_file = 'map.html'
map = folium.Map()

for i in range(60):
    # Get GCRS coordinates of ISS
    geocentric = satellite.at(t)
    print(geocentric.position.km, end=' ')

    # Convert GCRS coordinates to lat, lon, and height
    lat, lon = wgs84.latlon_of(geocentric)
    height = wgs84.height_of(geocentric)
    print('Lat:', lat, end=', ')
    print('Lon:', lon, end=', ')
    print('Height:', height.km, end='km\n')

    if i == 0:
        folium.Marker([lat.degrees, lon.degrees]).add_to(map)
    else:
        folium.CircleMarker([lat.degrees, lon.degrees], radius=3, color='red').add_to(map)

    t += timedelta(minutes=1)

map.fit_bounds(map.get_bounds())
map.save(output_file)
Here is my full script for getting rise and set times:
from skyfield.api import load, wgs84

# Create ISS TLE
n = 25544
url = 'https://celestrak.com/satcat/tle.php?CATNR={}'.format(n)
filename = 'tle-CATNR-{}.txt'.format(n)
satellites = load.tle_file(url, filename=filename)
print(satellites)

satellite = satellites[0]

ts = load.timescale()

# Find how many times the ISS rises over 30 degrees of altitude over a day
bluffton = wgs84.latlon(+40.8939, -83.8917)
t0 = ts.utc(2022, 4, 14)
t1 = ts.utc(2022, 4, 15)
t, events = satellite.find_events(bluffton, t0, t1, altitude_degrees=30.0)
for ti, event in zip(t, events):
    name = ('rise above 30°', 'culminate', 'set below 30°')[event]
    print(ti.utc_strftime('%Y %b %d %H:%M:%S'), name)