
By Norma Kline and Alicia Christiansen
This is the fourth article in our digital mapping series. The first articles covered how to get the most out of your basic mapping app that comes preloaded on your smart device, the process of printing a topographic map, and how to transfer data between apps and desktop programs (links for these articles are provided at the end of this article). In this article we cover details on integrating digital maps into a management plan and follow our fictional landowner, Sitka Silver, as she creates a stand type map.
A common theme in our Forestry and Natural Resources Extension publications and newsletters is the importance of developing a forest management plan for your woodland. Woodland owners benefit from the process of developing a forest management plan in numerous ways, such as:
- Developing a deeper understanding of landowner goals and objectives – a plan does not have to be timber production oriented! It could help a landowner accomplish conservation goals, improve wildlife habitat, and promote scenic beauty and recreation aspects of your property.
- Providing a systematic approach to exploring and understanding the resources and limitations on your property.
- Organizing business records.
- Saving time and money by avoiding costly mistakes by prioritizing activities and considering project sequence.
- Communicating your vision and management activities with family members and heirs.
Landowners can choose to develop a plan on their own or hire a consulting forester. Oregon has great management planning resources for landowners including the Forest Management Plan Template and step by step guide found at https://blogs.oregonstate.edu/forestplanning/.
When looking at the Forest Management Plan Template, you’ll notice that maps and photos make up an entire section of a plan. There are many different types of maps that you can include in your management plan. There are also several ways that you can display this map information. In some cases it might work well to have multiple features displayed on a map, while there are other instances where it makes most sense to display a limited amount of information on a map. Some map features that are centrally important to include on maps in your management plan are:
- An aerial photo showing your property boundary.
- A topographic map or other terrain base that displays elevation contours and shows your property boundary. A soils map of your property that shows your property boundary.
- A map that clearly distinguishes the forested areas of your property verses the non-forested areas. Break out the forested areas into stand types.
- Important property features such as roads, lakes and streams, and unique property identifying features. These can be things such as gates, fences, buildings, retention areas, areas of cultural significance, and unique areas on your property.
- County roads and/or highways that provide access to your property.
In this article, we will focus on the process of defining different areas of vegetation (stand types) and how to add a stand type map to your management plan. Stand typing is a way of describing or categorizing the various types of forests on your woodland and is helpful for overall planning and management. Why are stand types helpful? A landowner, for example, would generally manage a two-year-old reforested area differently than an area of mature conifers. How a woodland owner divides up their woodland into different “stands” is up to them and will depend on the size of their property and their management objectives. Appendix A of the Forest Management Planning Template has a good description of stand types.
To draw stand types on your property, you will use the tools found in desktop mapping programs (that we describe in earlier articles) to view imagery and draw polygons. In order to draw stand types, you will need to know the approximate location of your property. Google Maps displays parcel boundaries that you can trace over to draw a polygon representing your property boundary. You can export your property polygon to another mapping program such as Google Earth or CalTopo, or continue working in Google Maps – it’s up to you. Just a reminder, parcel or taxlot boundaries are approximate and don’t take the place of a professional land survey. If you are planning a timber sale, road construction, or some other activity where it is critical to know your property lines, hire a licensed surveyor. But for general planning purposes, parcel boundaries displayed on desktop mapping programs should be close enough.
Throughout this article series, we have been following Sitka Silver (our fictional landowner) who owns 23 acres of woodlands that she manages for a combination of economic return and recreation. To define the stand type boundaries on her property, Sitka starts by taking a look at the aerial imagery on her desktop computer and then draws polygons around the different stands (Figure 1). Here you can see that she decided to draw a boundary around a mature mixed conifer stand type in the northwest area of her property, another around an alder area, one around her proposed thinning unit, and another around a 45-year-old Douglas-fir stand. Sitka can export these stand type polygons to her mapping app (on her phone or tablet) and ground truth them in the field using the skills we discussed in Article 3. This allows Sitka to edit her stand types and polygons if she finds that they are not accurate or don’t meet her land management objectives.
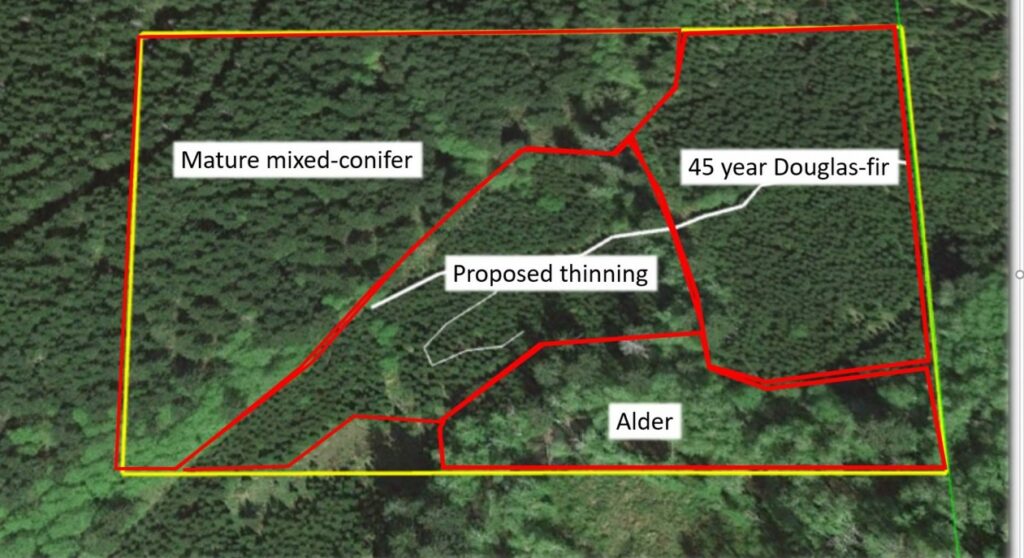
Sitka chose to draw her stand types around fairly homogenous areas that she would be managing differently. She didn’t break her area down into really small polygons because she did not think she would be managing those areas differently. For example, she did not break out the alder area in the lower part of the “mature mixed-conifer” stand type as a separate stand. Other landowners may choose to delineate small stands to help them achieve specific management objectives. The beauty of stand typing is that the outcome is unique to each landowner and their personal land management goals and approach.
It is completely up to you on how you decide to integrate digital mapping information into your management plan and process. Sitka could print out the maps and place them in the correct order in a binder, or create a separate digital file dedicated just to maps of the property. The point here is that the forest management planning process and organization is flexible. Some people might find it convenient to convert the digital maps they create into image files (e.g. jpeg) and insert them directly into the electronic version of their management plan. The process for creating a management plan and incorporating your digital maps might look different for everyone here, but the important thing is that you have a system that works for you and a forest management plan in place.
Resources:
Digital mapping tools: Part 1, the basics: https://extension.oregonstate.edu/forests/health-managment/digital-mapping-tools-part-1-basics).
Digital mapping tools: Part 2, printing a topographic map: https://extension.oregonstate.edu/forests/health-managment/digital-mapping-tools-part-2-printing-topographic-map
Digital mapping tools: Part 3, transferring data between apps and desktop program. https://blogs.oregonstate.edu/southcoastfieldforest/2021/08/25/digital-mapping-tools-part-3-transferring-data-between-apps-and-a-desktop-program/
What kind of forest do you live in? https://blogs.oregonstate.edu/southcoastfieldforest/2020/08/26/what-kind-of-forest-do-you-live-in/