
I recently saw some statewide reporting numbers in the National CoCoRaHS newsletter. It made me wonder how Oregon Season Trackers’ and Oregon observers as a whole do in comparison with other states. So I reached out to CcCoRaHS with some questions and was put in touch with Matt Spies, one of their data guys and NE states coordinator. Matt had a little extra pandemic down time, loves playing with data, and set off on a journey he named “The Oregon Trail” to help me find answers. They were not as simple as I had hoped for, but useful.

Since CoCoRaHS data are used in forecasts and models, it is all about gathering data. Generally the more the better. For each observer/site participating, the more complete a data set (the daily reports per observer), and the longer the time period reported are most important.
To start, CoCoRaHS recently celebrated 50 Million Daily Reports milestone. Of those daily reports, 1.3 Million come from Oregon. Oregon has made more than its 1-state-out-of-50, fair-share, contribution to the network. Even more important is when you know Oregon’s population ranks 27-out-of-50.
One thing I wanted to know was, “How do Oregon CoCoRaHS observers fare as a whole?” Matt’s simple answer was, “Oregon observers are strong reporters.”
Matt looked at a recent 12-month period and saw that Oregon averages 24.6 Daily Reports per Reporting Observer in a month. The entire CoCoRaHS network averages 22.4 monthly Daily Reports per reporting observer. That is good. No group has a perfect record (which would be 30.4 days, since our months vary in length). It seems reporting is better in states where it rains a lot – like Hawaii – compared to states where it does not rain much – like Arizona and South Dakota. Lots of new observers also tend to hold the average down a bit as people get the swing of things. But, don’t take that wrong we need and want new observers!
Matt says, we “should be proud of this graph below. It shows how Oregon observers (top line) consistently report a couple more days a month than observers in the CoCoRaHS network as a whole (lower line).”The two lines average out to 24.6 for OR, and 22.4 for the whole network for 2020. Peaks and troughs reflect the number of days in each month. Oregon does well even in our dry months!

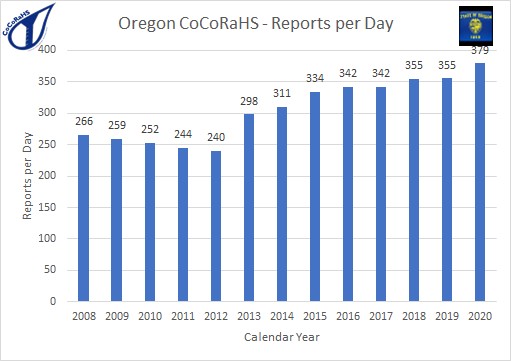
The next graph shows the number of reports per day for Oregon. Clearly, CoCoRaHS was active here before we launched OST as a pilot in 2013, but I would like to think that our efforts as a group have helped show an upward trend of daily reports through June 2020.
The final graph shows Oregon has a strong number of long-standing observers. The graph shows 101 out its 462 sites, 22% of recent-reporting (active) observers have 12+ years in the network! This shows strength in longevity for this recruiting “Class of 2007”
Matt says, “The states in the Upper Midwest of MN, ND, & WI, struggle to keep the majority of their observers more than 3 years/1000 Daily Obs. As I suspected earlier, about 70% of the Oregon observers have been around more than 3 years/1000 Daily Obs. This is one the highest percentages in the network!”

So, congratulations and thank you Oregon Season Trackers for your consistent and diligent observing. Oregon Season Tracker observers are awesome!!!!