In the first blog of this series I promised I was going to teach some machine learning (ML) concepts. Since then I haven’t written at all about the cool things I have learned. That is because it is taking me a lot longer to learn them than I expected. There is a lot of math involved, specifically Linear Algebra, which feels like the secret way I should have been doing algebra all along. It is a pretty neat field of mathematics, but sadly one I am unfamiliar with. In case you are interested, I am trying to learn it using Introduction to Linear Algebra, 5th ed. by Gilbert Strang. The explanations can be a little confusing sometimes, but the problem sets are amazing.
Anyway, I have learned a few core concepts that I’d like to share. This is an explanation from one beginner to another, so veterans close your ears! Or don’t, and tell me what I got wrong! Today I am going to talk about:
- Classification
- Feature Mapping
- Supervised Learning
- Error
- Loss
- Training Data / Test Data
Classification
One of the core areas of Machine Learning is creating solutions to classification problems. A classification problem could be something like “Is this animal a dog or a cat?” where the ‘classes’ are “dog” and “cat.” The machine learning challenge is to find the line between the two.
Feature Mapping
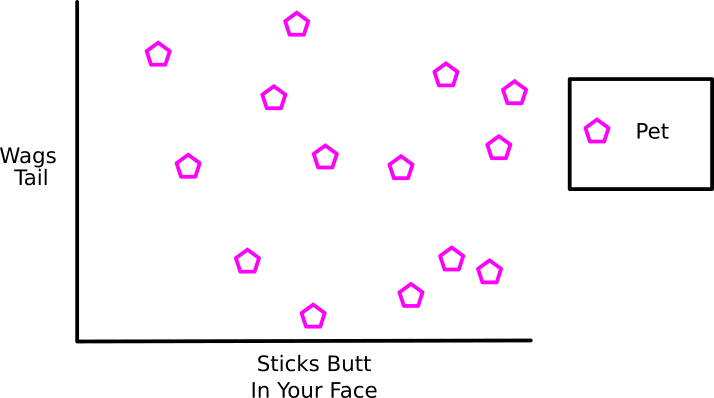
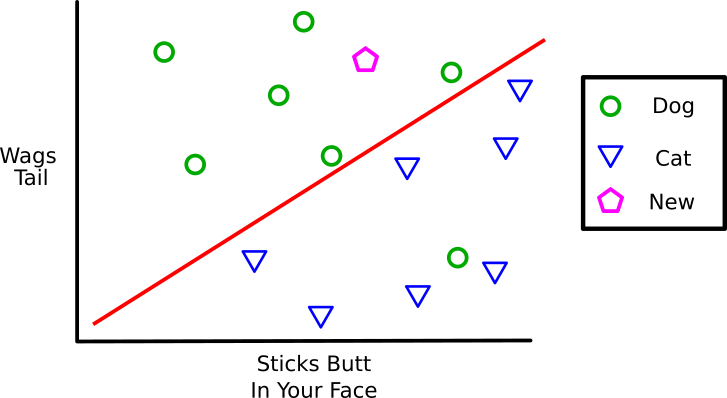
In ML a “feature” is something which helps define the data we are looking at. I’ll use the features “Wags Tail” and “Sticks Butt in Your Face” to help define dogs and cats. Feature Mapping is the practice of turning those abstract concepts into numbers we can do math with. Maybe we count the number of wags per second or the number of butts in your face every hour. With these features we could make a graph of our pets that looks like this.
Supervised Learning
This basically means “You labeled the data”. It is hard to classify something if you don’t know what it is! Well, actually there is another area of Machine Learning called Unsupervised Learning where the data isn’t labeled. In that area the algorithm’s goal is to find patterns like “All these pets are are grouped over here and all those pets are grouped over there, so they are probably different pets.”
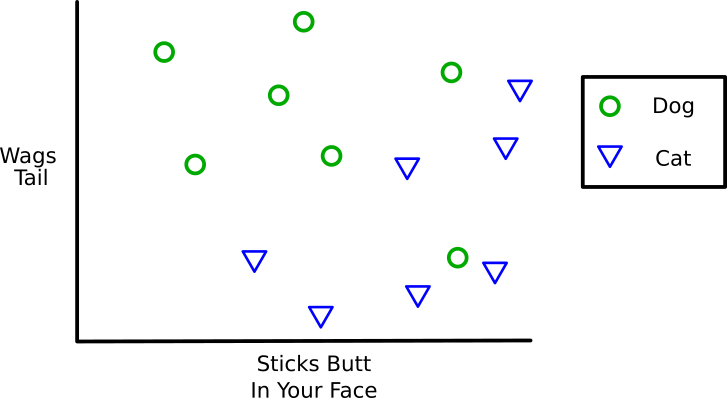
But here we are going to label them. This pet is a “Dog” and that pet is a “Cat”.
Error
The general approach for machine learning is to give this data to a program and say “Guess what this point is!” The program guesses and then compares its guess to the actual answer (the label “Dog” or “Cat”). The total Error for the program is the average amount it guessed wrong. In our Dog/Cat example we would expect the error to be 50% if the program makes completely random guesses. That isn’t great, so what the program does is change the way it guesses to reduce the error.
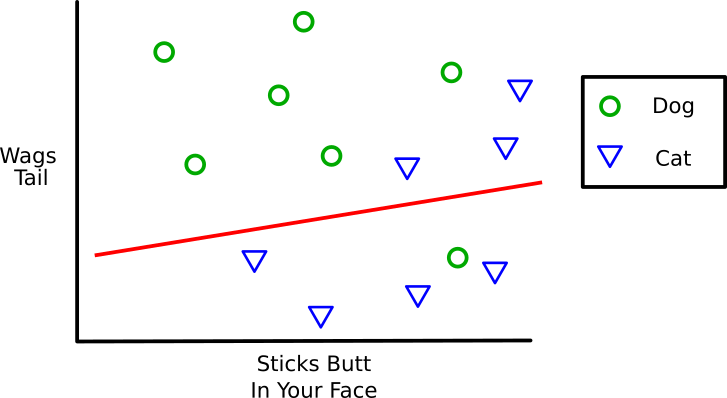
Let’s say this was the program’s first guess (the red line). It hypothesized that anything above the red line was a Dog and anything below was a Cat. We can see that it missed 4 of the 14 points, so it has an error of 0.29 or 29% (4 divided by 14).
That actually isn’t too bad, but it could be better. On the second try the program changes its hypothesis (moves the red line). Again, anything above the line it guesses is a dog and anything below it guesses is a cat.
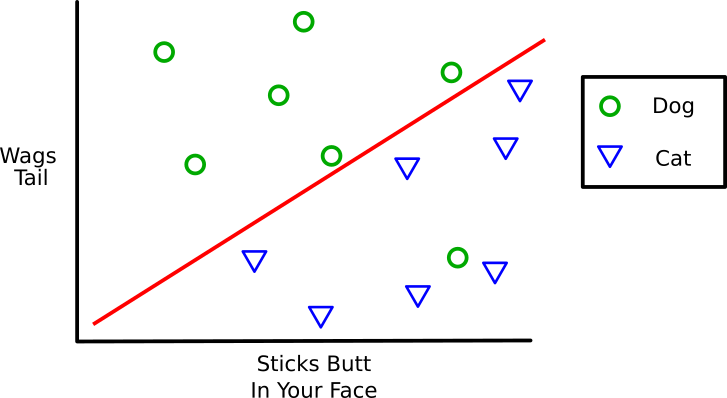
That is a lot better! It only missed one (the dog who rarely wags his tail but loves to stick his butt in your face). That is an error of 1/14 or 0.07 or 7%.
Loss
This is a little more complicated and I might get the specifics wrong, but the general concept still applies. There are some situations where guessing certain points incorrectly is a lot worse than other points. Like what if our program was designed to help people who are deathly allergic to cat butts? It wouldn’t be so bad if a dog were mislabeled as a cat, but it could kill someone if a cat were mislabeled as a dog. Loss is an abstract measurement of how awful it is if we guess something wrong. If guessing something wrong was only an average amount of awful, like mislabeling the dog, we might give the incorrect guess a “loss” score of 1. On the other hand, we might give mislabeling the cat a loss score of 10. After we make all of our guesses we add up all the loss and divide by the number of points to get the average loss. So if we mislabeled 2 dogs our average loss would be
(1+1) / 14 or 0.14.
If we mislabeled 1 dog and 1 cat our average loss would be
(1 + 10) / 14 or 0.79
What we do with those loss scores is still a mystery to me, but I assume they get worked back into certain machine learning algorithms to help improve them over time.
Training Data vs. Testing Data
All the data we have given our Machine Learning program (algorithm) so far is called the “Training Data”. It used that training data to figure out the best spot to put the red line, the hypothesis. Now that it is done training we can test that hypothesis by throwing some new never before seen data at it.
Given the location of the testing data above the red line our program will guess that this is a Dog. The “testing data” is the real world application of the program. How well it classifies (guesses the answer for) new data is the Test Error
That is all for this week! I’ve mostly avoided any math and spoken in terms which might get a few “Well, actually…”s from veteran Machine Learning programmers, but this should still be helpful for learning some general concepts! I’ll share more next week!