Oregon Season Tracker volunteers are strong CoCoRaHS observers

I recently saw some statewide reporting numbers in the National CoCoRaHS newsletter.  It made me wonder how Oregon Season Trackers’ and Oregon observers as a whole do in comparison with other states.  So I reached out to CcCoRaHS with some questions and was put in touch with Matt Spies, one of their data guys and NE states coordinator.  Matt had a little extra pandemic down time, loves playing with data, and set off on a journey he named “The Oregon Trail” to help me find answers.  They were not as simple as I had hoped for, but useful.

Oregon Season Tracker rain gauge

Since CoCoRaHS data are used in forecasts and models, it is all about gathering data.  Generally the more the better.  For each observer/site participating, the more complete a data set (the daily reports per observer), and the longer the time period reported are most important.

To start, CoCoRaHS recently celebrated 50 Million Daily Reports milestone.  Of those daily reports, 1.3 Million come from Oregon.  Oregon has made more than its 1-state-out-of-50, fair-share, contribution to the network.  Even more important is when you know Oregon’s population ranks 27-out-of-50.

One thing I wanted to know was, “How do Oregon CoCoRaHS observers fare as a whole?”  Matt’s simple answer was, “Oregon observers are strong reporters.”  

Matt looked at a recent 12-month period and saw that Oregon averages 24.6 Daily Reports per Reporting Observer in a month. The entire CoCoRaHS network averages 22.4 monthly Daily Reports per reporting observer.   That is good. No group has a perfect record (which would be 30.4 days, since our months vary in length).  It seems reporting is better in states where it rains a lot – like Hawaii – compared to states where it does not rain much – like Arizona and South Dakota.  Lots of new observers also tend to hold the average down a bit as people get the swing of things. But, don’t take that wrong we need and want new observers!

Matt says, we “should be proud of this graph below.  It shows how Oregon observers (top line) consistently report a couple more days a month than observers in the CoCoRaHS network as a whole (lower line).”The two lines average out to 24.6 for OR, and 22.4 for the whole network for 2020. Peaks and troughs reflect the number of days in each month.  Oregon does well even in our dry months!

Daily reports per reporting observer graph - comparing Oregon observers and the CoCoRaHS network

The next graph shows the number of reports per day for Oregon.  Clearly, CoCoRaHS was active here before we launched OST as a pilot in 2013, but I would like to think that our efforts as a group have helped show an upward trend of daily reports through June 2020.
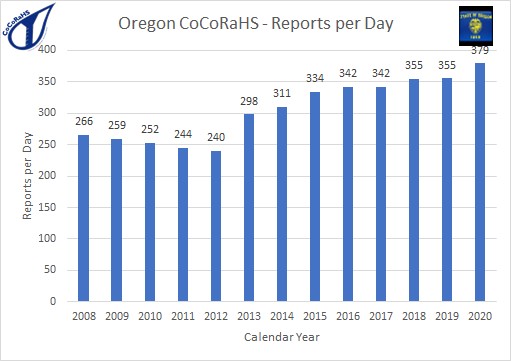
Oregon CoCoRaHS - Reports per day

The final graph shows Oregon has a strong number of long-standing observers.  The graph shows 101 out its 462 sites, 22% of recent-reporting (active) observers have 12+ years in the network! This shows strength in longevity for this recruiting “Class of 2007”  

Matt says, “The states in the Upper Midwest of MN, ND, & WI, struggle to keep the majority of their observers more than 3 years/1000 Daily Obs.  As I suspected earlier, about 70% of the Oregon observers have been around more than 3 years/1000 Daily Obs.   This is one the highest percentages in the network!” 

Oregon CoCoRaHS - Active Observers.

So, congratulations and thank you Oregon Season Trackers for your consistent and diligent observing.  Oregon Season Tracker observers are awesome!!!!

Posted in Uncategorized | Tagged , , | Leave a comment

Oregon Season Tracker Student Scientists

On a beautiful 2019 fall day, thirty-seven fourth and fifth grade students at Muddy Creek Charter School visited HJ Andrews Experimental Forest, asking questions.  “How do you report colored leaves, green leaves are a color too?” the young scientist asks.

The highlight of this trip is working with researcher Mark Schulze, their scientist partner with Oregon Season Tracker and our tour guide for the visit.  Mark welcomes them with a video where they get eye to eye with a rough skinned newt and learn about some of the Andrews long-term science work.  They watched time-lapse phenology data from a high elevation meadow at the Forest, actually four years of video data running concurrently on the screen.  As the video quickly cycles through, we could see the vast variation in phenology timing (and snow pack) from year to year.  It was easy to follow the snowpack, but catching the phenology changes takes a practiced eye! Just like learning to take phenology data at their school grounds.

Students get fitted for hard hats.

Next out to the field, but not before everyone was fitted with hard hats for safety in the forest! First stop, the headquarters MET weather station to view some of the multitude of instruments researchers use to measure precipitation and the pollution that washes in with the rain.  We learned after the 2011 Japan Fukushima nuclear reactor meltdown, they actually measured some radioactive fallout here.  Overall, we learned that the Andrews forest MET station has some of the cleanest air quality in the entire MET network!

Next we are off to the Discovery Trail with clipboards and data sheets to take phenology observations on vine maple, a priority species at both the school and the Andrews.  Experienced students pair up with newcomers to confer on their data. Researcher Mark helped make the connections from the written phenophase descriptions to what they were actually seeing on the trees.  While collecting data students hike a trail dwarfed by 500-year-old trees and have a treasure hunt spotting a variety of colored mushrooms. We count eight different colors of mushrooms, including orange, purple and bright green!

Student view landslide flume
Students view the Debris-Flow Flume

Students later wrote reflections on the day; about meeting the “best researcher ever”, wearing hard hats, learning about spots on leaves, and a getting to see a gigantic landslide “Debris-Flow Flume” simulator.  You can see it too at this website  https://pubs.usgs.gov/of/2007/1315/

Posted in Uncategorized | Tagged , , | Leave a comment

OST Partner Chris Daly: researcher, weather and climate modeler

Brad Withrow-Robinson, Forestry & Natural Resources Extension agent in Benton, Linn and Polk Counties

Dr. Chris Daly knows weather. And he really likes weather data.  Lots and lots of data.

Chris in his office at PRISM Climate Group.

Chris is director of the PRISM Climate Group at  Oregon State University which uses vast amounts of weather data, including your OST/CoCoRaHS observations to help predict the future: the weather.   Chris is also a senior scientist at the HJ Andrews LTER (Long Term Ecological Research program).  Oh, and let’s not forget that Chris is an OST/CoCoRaHS weather observer at home too.

Continue reading

Posted in Uncategorized | Leave a comment

Increase the Value of Your Observations

Brad Withrow-Robinson, OSU Forestry and Natural Resources Extension agent for Benton, Linn and Polk Counties.

The retreat was a great opportunity for OST volunteers to see how their observations at home, woodland or school yard contribute to work being done at the Andrews forest and elsewhere. The take home message, heard from several of the speakers (including Chris Daly and Mark Schulze) was that your observations matter!

Chris Daly (see previous Meet the Partner article) explained the challenges, complexity and equipment needed to measure precipitation at high elevations of the Andrews.  He described some of the findings about air movement and pooling in a complex mountain environment the observations collected at the Andrews have led to.

A look at annual precipitation patterns across the topography of HJA.

Chris repeatedly returned to the importance of citizen science data from the CoCoRaHS system in supplementing and building out a much broader network of observation points than could be done as part of research programs such as his. “I had no idea researchers relied on citizen science data as much as they do.”  said one Season Tracker.

Chris Daly, founder and director of OSU PRISM Climate Group, talking with OST volunteers. (photo by Victor Villegas)

Continue reading

Posted in Uncategorized | Leave a comment

Oregon Season Tracker retreat at HJA a huge success

Brad Withrow-Robinson, OSU Forestry and Natural Resources Extension agent for Benton, Linn and Polk Counties.

About fifty Oregon Season Tracker citizen scientists, teachers, Extension personnel and researchers gathered to exchange ideas and inspiration at the Oregon Season Tracker retreat in mid-August.  OST is a joint program of OSU Extension and HJ Andrews Experimental Forest https://andrewsforest.oregonstate.edu/, so the beautiful 15,000 acre HJA forest in the mountains east of Springfield was the perfect location to take a deep dive into ecology and climate science.

Continue reading

Posted in Uncategorized | Leave a comment

Citizen Science Inspires Deeper Connections

Reflections from an Oregon Season Tracker and Master Gardener, Susan Hoffman.

This past November, I attended the CoCoRaHS (Community Collaborative, Rain, Hail and Snow Network) Citizen Science Training for Linn/Benton Counties. My husband and I left with a new water gage and a plan for daily measurement. We were also trained and encouraged to be part of Nature’s Notebook, a native plant/tree monitoring program thru the USA National Phenology Network.  What we have come to understand, is that the data we collect, which takes very little time and effort, adds to the collective data on our changing climate. At first, we just collected the water, emptied the gage and recorded the amount.  Then we started to comment to each other about how we never really noticed what one inch of rain was before…how much it had to rain, how long it took, the quality of the rain…and it got us outside in the garden, rain or shine, winter to summer, and now on to autumn. We also began a closer look at some of the native plants on our property….from winter form, to breaking leaf buds, increasing leaf size, flowers, fruiting, to fruit and leaf drop.

Continue reading

Posted in Uncategorized | Leave a comment