By Norma Kline, Oregon State University Extension Forester for Coos and Curry Counties
This is the eighth article in the Writing a Forest Management Plan series. The objective of this series is to break the process of writing a forest management plan into simple steps that make the process accessible and straightforward, regardless of your previous experience or knowledge. If you already have a management plan, use these steps to help review and update it.
The first articles explain how to generate basic property information and maps using web-based mapping tools, map forest cover (stands) based on age and species, describe stand characteristics, take simple plot measurements, and calculate stand averages from plot data. In the seventh article, we explored how to locate soils information for your property. Links to the first seven topics are listed at the end of this article. In this article, we will discuss how to find water resource information for your property.
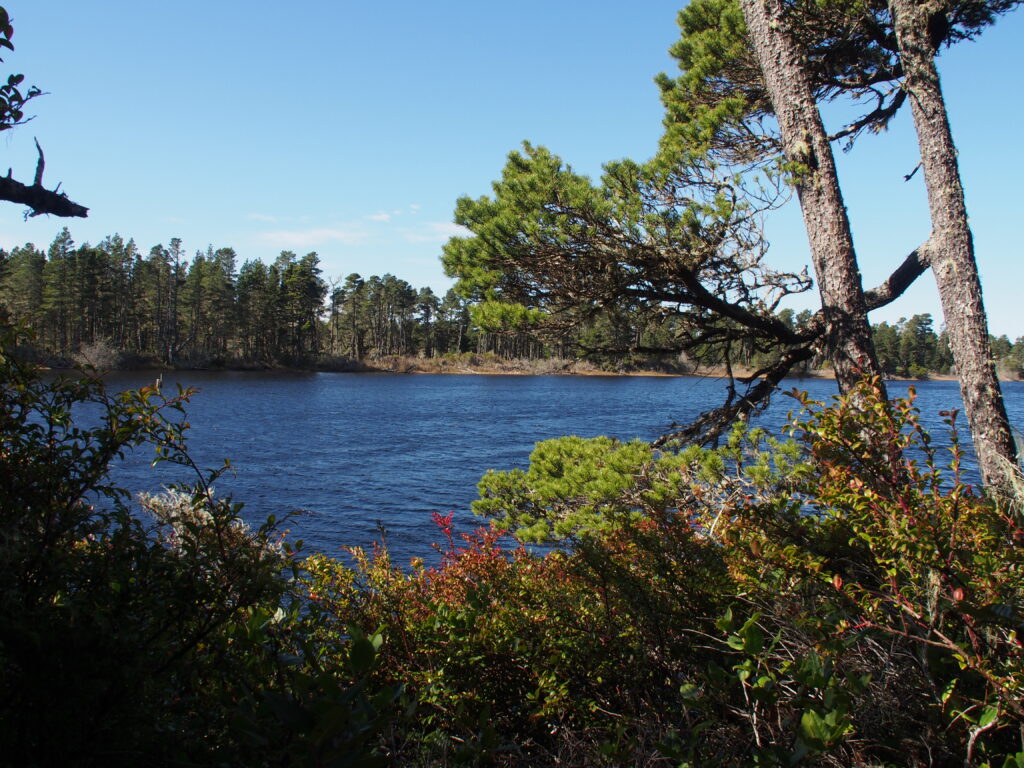
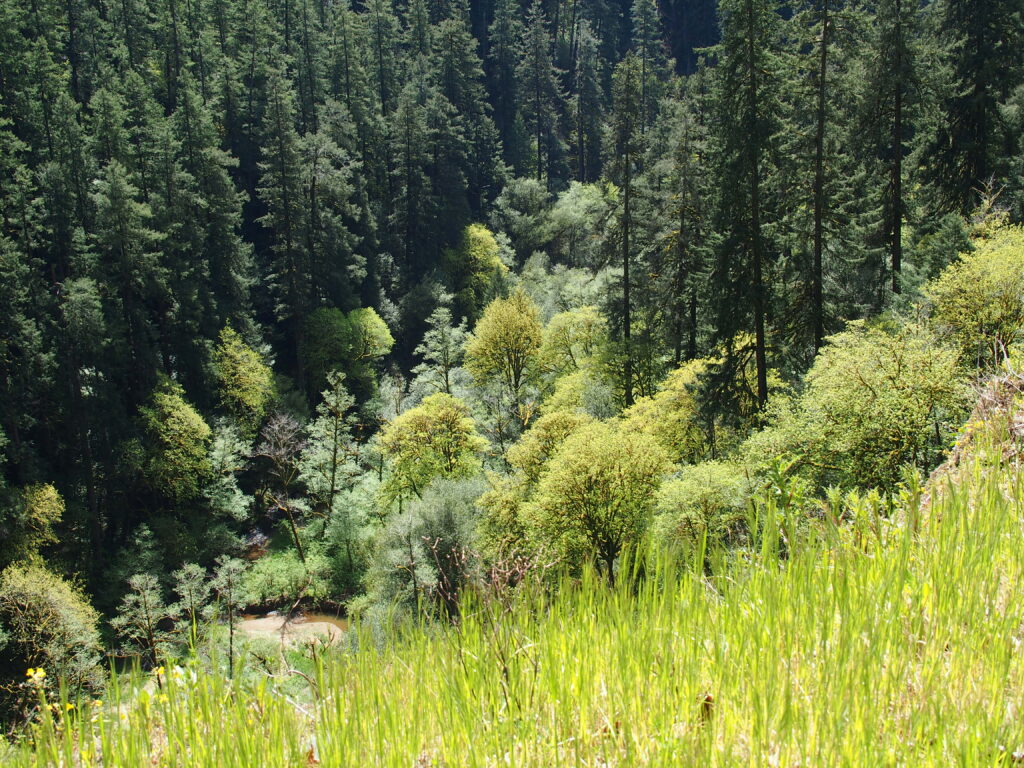
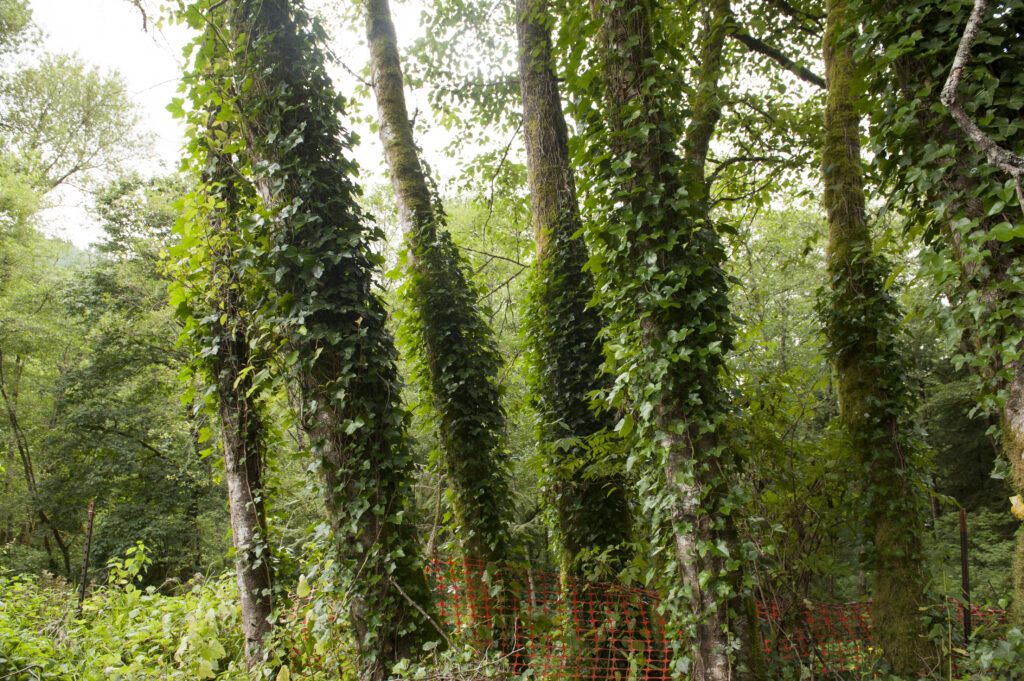
Does your forested property have a stream or river running through it? Perhaps you have a pond, spring, or wetland (Figure 1). These features are all considered water resources. In many cases, the presence of water provides scenic beauty, wildlife habitat, and may even supply your home’s domestic water. However, wet or boggy areas can also pose challenges when working toward your forest management objectives. Understanding what water resources you have and where they are located is an important part of the planning process. Once you know what resources are present, you can investigate the regulations associated with different types of water features—rules that are especially important if you plan to harvest timber or construct roads.
Water resources are recorded in the table immediately following the Soils table in the Oregon Forest Management Plan Template. Categories include Fish-Bearing Streams, Domestic Use Streams, Non-Fish-Bearing Streams, Lakes and Ponds, Wetlands, and Springs. We will describe how to find information for each of these categories. Even if you believe you already know what classifications apply to your property, it is worthwhile to confirm them on official maps. It is also important to locate these features in the field before planning any timber harvest.
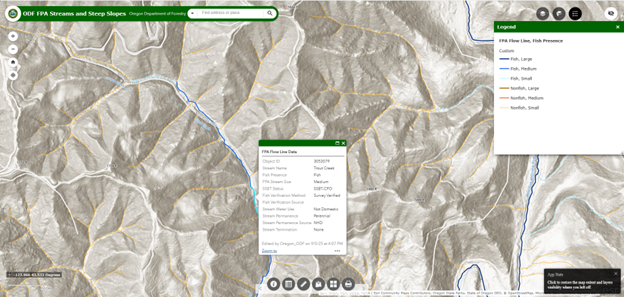
The Oregon Department of Forestry (ODF) maintains an online Streams and Steep Slopes Viewer, which provides detailed stream classification data. You can find the viewer under the Resources section of the Forest Practices pages: https://www.oregon.gov/odf/working/Pages/fpa.aspx. Open the viewer and enter your address, or zoom to your property using your mouse. Select each stream segment to view its classification. Access the map legend by clicking the legend icon in the upper right corner. In the example shown in Figure 2, the selected stream segment—Trout Creek—is classified as a Medium, Fish, SSBT, perennial stream. “Medium” refers to stream size based on flow or drainage area; “Fish” indicates that the stream supports fish (and may also be used for domestic water); “SSBT” means the stream is used by salmon, steelhead, or bull trout; and “Perennial” indicates year-round flow. You may find a range of stream classifications on your property. A Type N stream has no fish present. A Type Ns stream is a non-fish seasonal stream (flows only during part of the year). Use the measure tool at the bottom of the screen to determine stream lengths for each classification.
Different stream types have associated ODF forest practice buffer requirements. For more information, the publication Oregon’s Forest Protection Laws: An Illustrated Manual is an excellent resource:
https://oregonforests.org/publication-library/oregons-forest-protection-laws-illustrated-manual-2025
Contact your ODF stewardship forester if you have questions about how to implement these regulations. See the Resources section for the “Find My Forester” link.
You can also create a map of streams and rivers using Landmapper, an online mapping program introduced in the first article in this series. Select your ownership parcel(s) in Landmapper to automatically generate resource maps, which can be printed or saved digitally. The Hydrology map shows stream classifications and can be downloaded as a geospatial PDF for use in phone mapping apps (such as Avenza). This is especially helpful when locating features in the field. If you find discrepancies in the ODF Stream and Steep Slopes viewer compared to what you find on the ground (particularly if they affect how forest practice rules apply to a planned harvest), contact your ODF stewardship forester.
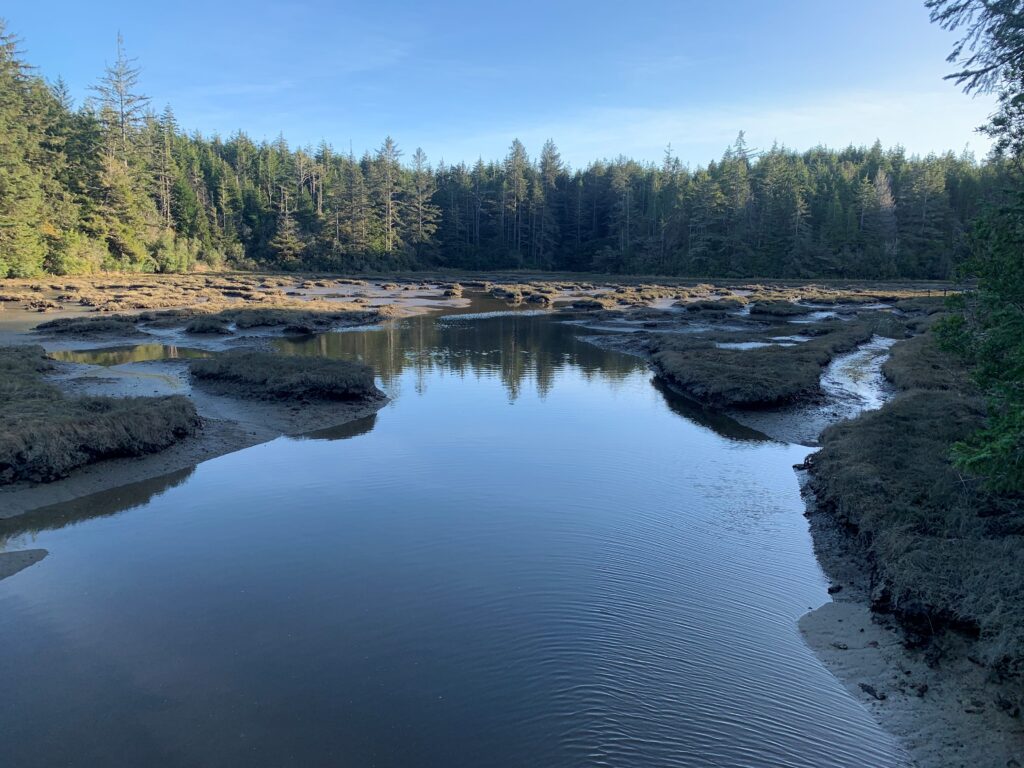
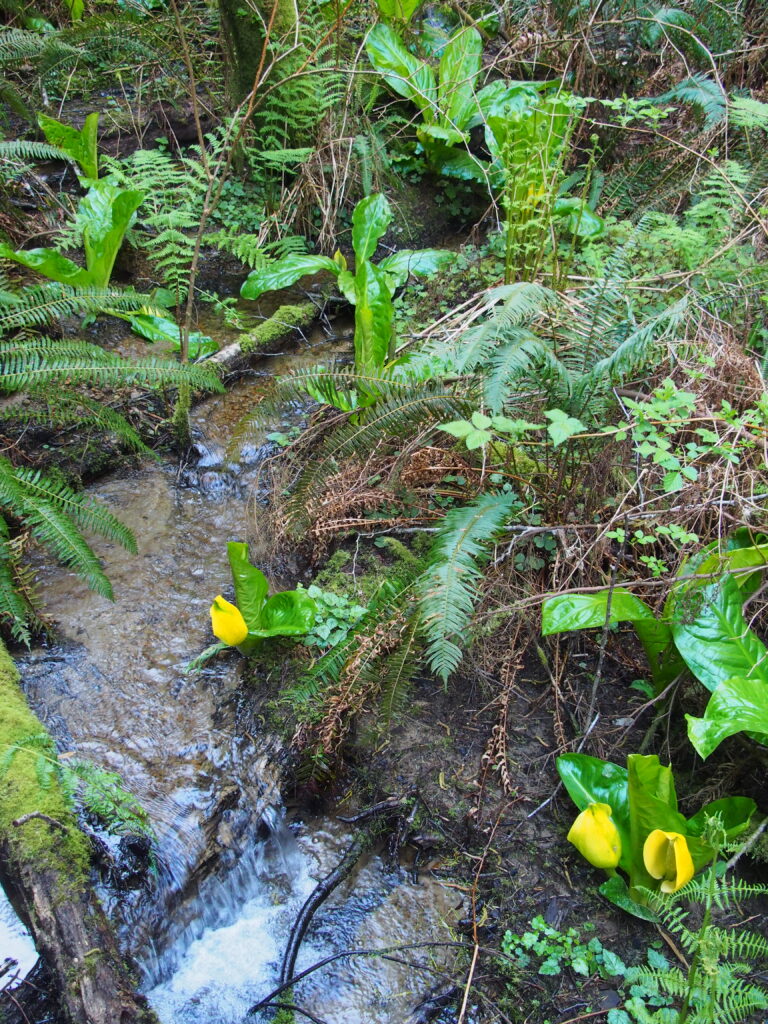
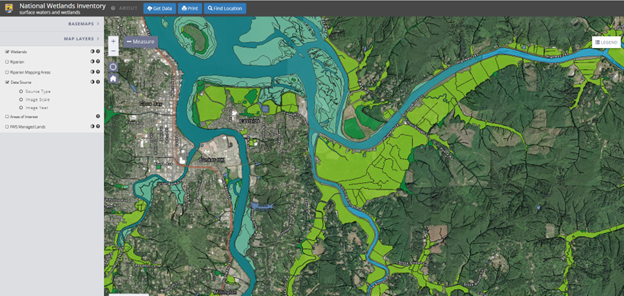
The next section of the Water Resources table covers lakes, ponds, and wetlands. Ponds may appear on USGS topographic maps or on topo layers in mapping platforms such as Caltopo. Wetlands may be obvious—such as those near bays and sloughs (Figure 3) —or subtle, especially if they are small or seasonal. Wetlands are characterized by specific combinations of soil and vegetation. Certain plants, such as cattails, sedges, rushes, and skunk cabbage (Figure 4), are strong indicators of wetland conditions. The National Wetlands Inventory is a good place to begin your research. Enter your address in the “Find Location” tool, then select mapped features to view descriptions (Figure 5).
Another extremely useful website is the NRCS Web Soil Survey, discussed in Article 7. Review your soil descriptions to see whether they have a Hydric rating. Hydric soils form under conditions of saturation, flooding, or ponding. Because not all wetlands are mapped, consider reviewing the Oregon Department of State Lands fact sheet, Wetlands in Oregon, which includes a wetland identification checklist and an overview of regulations:
https://www.oregon.gov/dsl/wetlands-waters/Documents/DSL_wetlands_factsheet.pdf
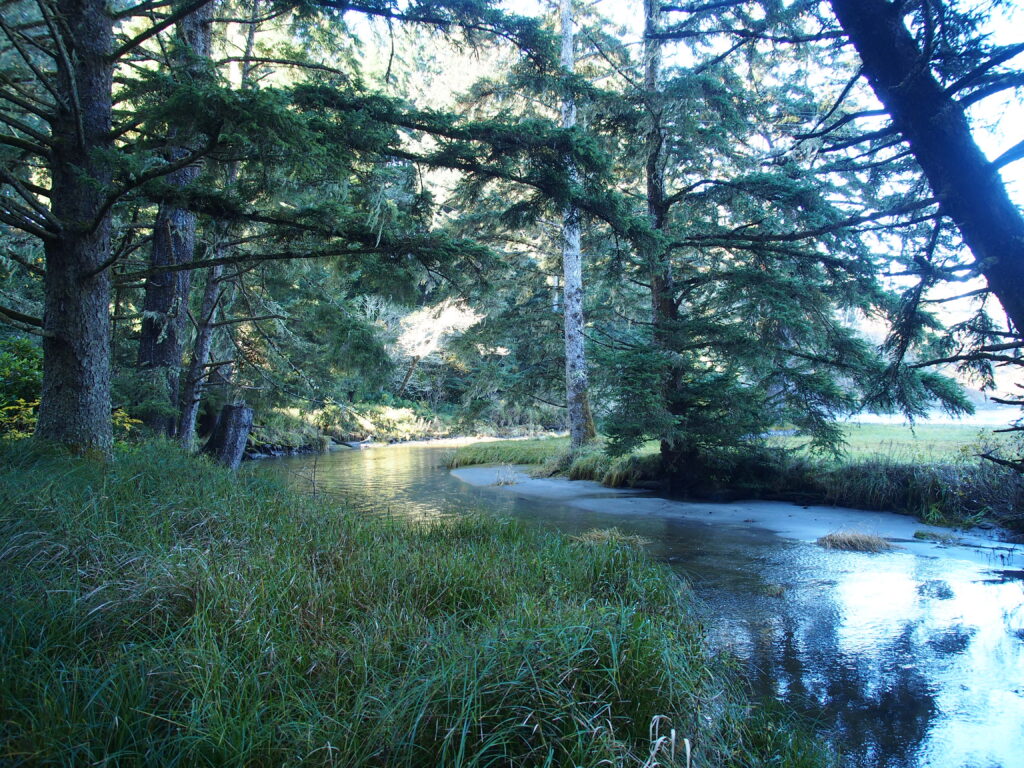
Did you know that remnants of tidal forests (Figure 6) dominated by Sitka spruce still exist along the Oregon coast? These spruce swamps were once widespread, but changes in land use have reduced their extent. You can read more about Oregon’s tidal forests at the link provided in the resources.
The final section of the Water Resources table asks whether your property contains any springs and, if so, whether they are used for domestic water. Mapping your domestic water source and any associated water lines is important. Springs may appear on USGS maps, but in some cases you may need to map them yourself.
Forest landowners have unique goals and objectives. If you are interested in salmon habitat restoration, you may want to explore resources from your local watershed association. See the reference section for a list of watershed associations in Coos and Curry Counties.
In our next article in this series, we will discuss how to complete the Fish and Wildlife section of your forest management plan.
Resources
Oregon Forest Management Plan Template and Guidance: https://blogs.oregonstate.edu/forestplanning/templates/
Oregon Forest Practice Act Resources: https://www.oregon.gov/odf/working/pages/fpa.aspx
Find an ODF Forester: https://www.oregon.gov/odf/working/Pages/findaforester.aspx
Oregon’s Mysterious Tidal Forests (article): https://appliedeco.org/oregons-mysterious-tidal-forests
Watershed Associations in Coos and Curry Counties
Coos Watershed Association: https://cooswatershed.org/
Coquille Watershed Association: https://www.coquillewatershed.org/
Curry Watersheds Partnership: https://www.currywatersheds.org/
Articles in the Writing a Forest Management Plan Series:
1 – Start with the easy sections. https://blogs.oregonstate.edu/southcoastfieldforest/2024/02/15/writing-a-forest-management-plan-start-with-the-easy-sections/
2 – Mapping stands.
3 – Measuring plots to describe your woodland.
4 – Summarizing plot measurements to describe your woodland.
5 – Describing stand characteristics.
6 – Using stand inventory data to determine density. https://blogs.oregonstate.edu/southcoastfieldforest/2025/08/08/writing-a-forest-management-plan-using-your-stand-inventory-data-to-determine-future-management-actions/
7 – Finding information on soils and geology. https://blogs.oregonstate.edu/southcoastfieldforest/2025/11/25/writing-a-forest-management-plan-finding-information-on-soils/