I’d like to start today’s adventure by passive aggressively asking, why didn’t anyone tell me about the debugger?? Like seriously, it is a total game changer and even helped me understand my coding projects even better. I went through a semester and a half struggling unnecessarily by putting print statements all over my projects to figure out what I was doing. Oddly enough, CS271 – Computer Architecture and Assembly Language is what introduced me to this wonderful and I am here to share the wealth.
So, what is it?
It is a program that allows individuals to detect and remove errors (aka bugs) within the code. By running your code in debug mode, you may see what is going on when you execute the program. This can be done be clicking through each line and seeing what happens or it can be done by using breakpoints.
A debugger is a tool that we should all have in back pockets because it saves you time! You don’t have to go around putting print statements everywhere trying to guess what exactly your code is doing. By running it in debug mode you can get a quick glance at what every variable is doing. Another reason I find a debugger to be super helpful is to help familiarize yourself with code that someone else has written. I typically run the debugger and go through the entire program to find out the flow and give me a better idea of what is going on?
How do I do it?
Lucky for you, most IDEs have a built-in debugger. I will give you a quick tutorial on how to debug a simple python application using Visual Studio Code.
Step 1: Find the button
Create your program and hit the debugger button. Here are two ways to do it.
If your program has no apparent bugs, then nothing is going to happen on your screen. This doesn’t mean everything is working at 100% it just means that the debugger is not catching anything. However, if there is you’ll probably get an error code pop up (see below).

Step 2: Using Breakpoints
A breakpoint is basically a stop sign for the debugger. They are set by lighting up a little red dot beside the line of code you want to take a closer look at and you can have multiple breakpoints set up. As mentioned in step 1, the debugger can be run and have no error message pop up which is great but to be a little more thorough with our debugging it’s always wise to use breakpoints and verify each step of the application.
Now go ahead and restart the debugger and you should get a screen like this:
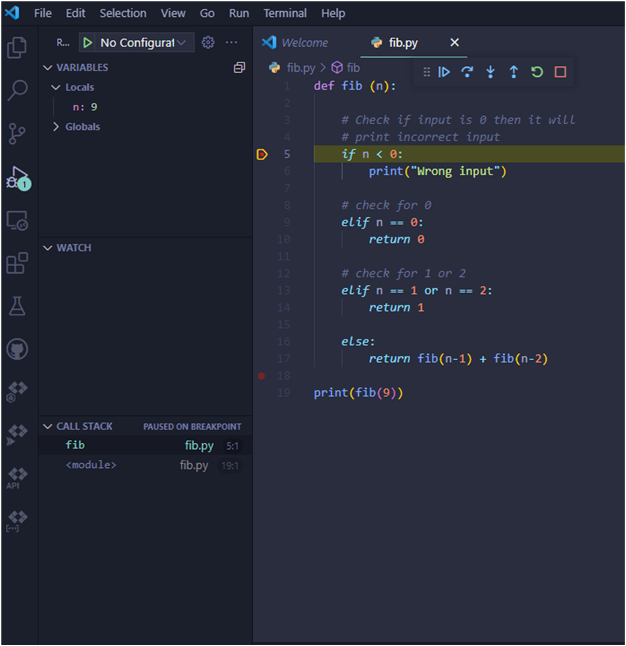
There are 3 immediate changes:
- The debug pane opens on the left-hand side.
- The currently line that is executing is highlighted yellow
- The debugging toolbar appears. It is located right about line 1.
Step 3: Run through the code
To step through the code line by line, we will be using the debugging toolbar. You can use the debug pane to watch how your code changes as you move through it. You can also set certain variable to ‘Watch’ which will allow you to always see how they are behaving.
Here is a simple python function that will give an example of how to use the toolbar.
- Continue: moves forward to the next breakpoint or the end of the application
- Step Over: skips over a line that contains a function. The function is still executed and will produce any relevant results. If the line does not contain a function, then it we behave just like Step Into.
- Notice that the results from the square function are displayed in the debug pane.
- Step Into: moves into the next line of code
- Step Out: returns to the line where the function was called. Think of it as fast forwarding through a function.
- Restart
- Done
Now you can finally see what your code is doing line by line. You can tweak anything you need to and redo all 3 steps until you are satisfied with you application.
Master Debugger
The thing about writing code is that there will always be mistakes, some visible and some not. It is important to be thorough with our work and readjust as necessary. The debugger is a handy tool that can help us wade through our mistakes in a more efficient manner than making print statements all over the place. So I think it’s safe to say, you can now call yourself a master debugger! Yay!