Edges are very useful features of an image. They relay quite a lot of information to the viewer of the image, be they human or computer. They allow us to separate an image into different objects, which makes reasoning about the image much easier.
What do I mean by “edges”? You probably understand what an edge is intuitively; put simply, it’s where one thing stops and another begins.

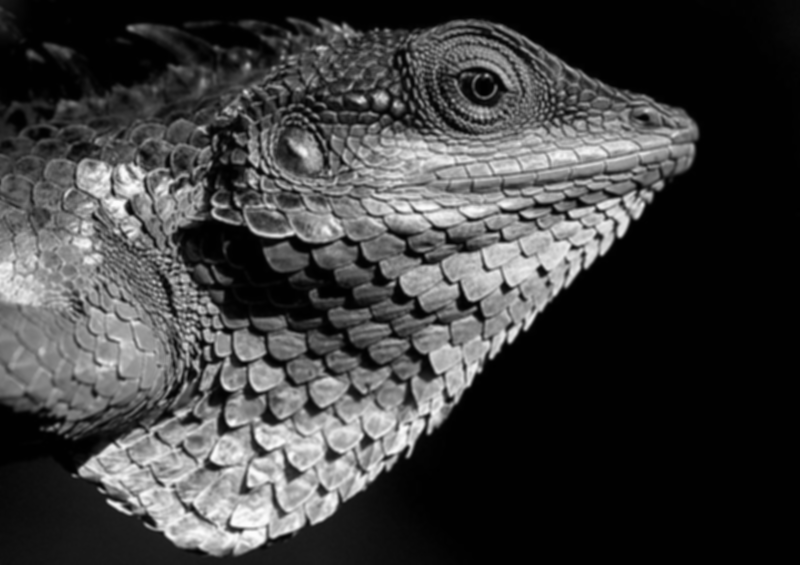
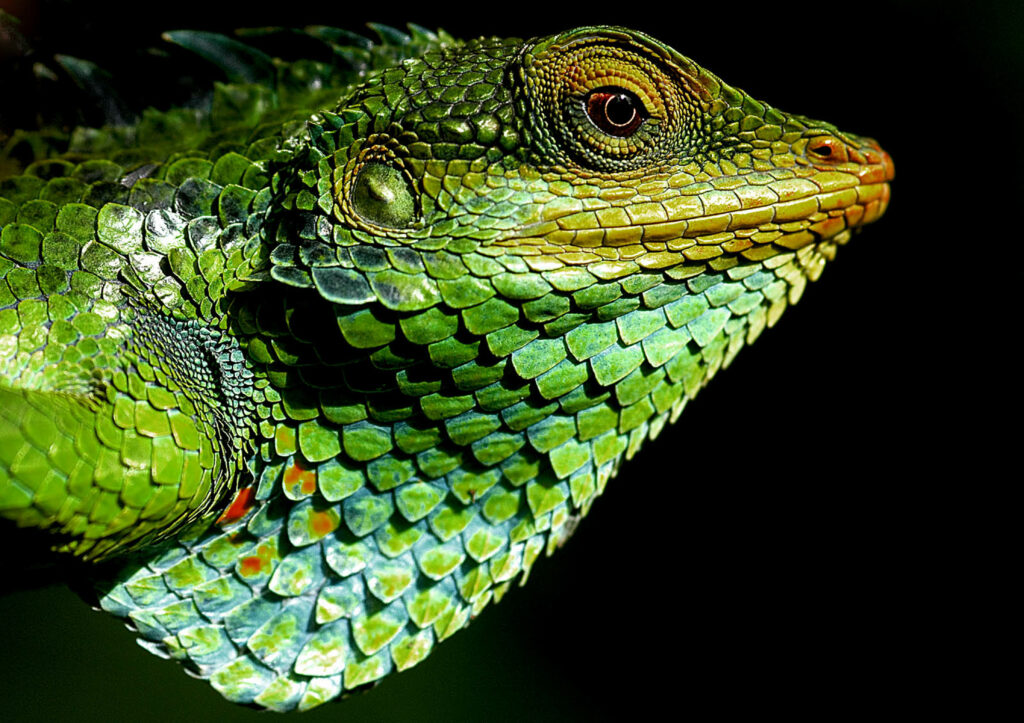
We can glance at the image above and easily understand where the edge of each scale is. But how can a computer determine where these are?
Computers detect edges by looking for sharp changes in brightness present in an image, and presume that these sharp changes should correspond to meaningful information on the edges present in an image. From https://en.wikipedia.org/wiki/Edge_detection:
It can be shown that under rather general assumptions for an image formation model, discontinuities in brightness are likely to correspond to:
* discontinuities in depth,
* discontinuities in surface orientation,
* changes in material properties,
* variations in scene illumination.
Canny Edge Detector
A common algorithm for edge detection is the Canny Edge Detector, invented in 1986 by John Canny. While the algorithm is now less used in it’s original form, with some small improvements it has remained a part of the state-of-the-art in edge detection. Helpfully, the stepwise transformations that it performs are instructive of the ambiguities that must be resolved in identifying edges in an image. Let’s follow Canny’s edge detection algorithm as the steps are applied to the above image.
Step 1. Desaturation and Denoising
First, the image is converted to grayscale. This is done since the following steps don’t operate on color information in the image, only on the intensity (or brightness of the light) of each individual pixel.
Then, denoising is performed on the image. This increases the accuracy of the algorithm by reducing the number of “false positive” edges that are found due to random noise. There are many approaches to denoising, but Canny’s original algorithm employs a relatively simple technique: Gaussian blur.
Step 2. Intensity Gradient
The second step is to derive the intensity gradient of the image, which is a map of how starkly the brightness of each pixel is changing by comparing it to the brightness of its neighbors.
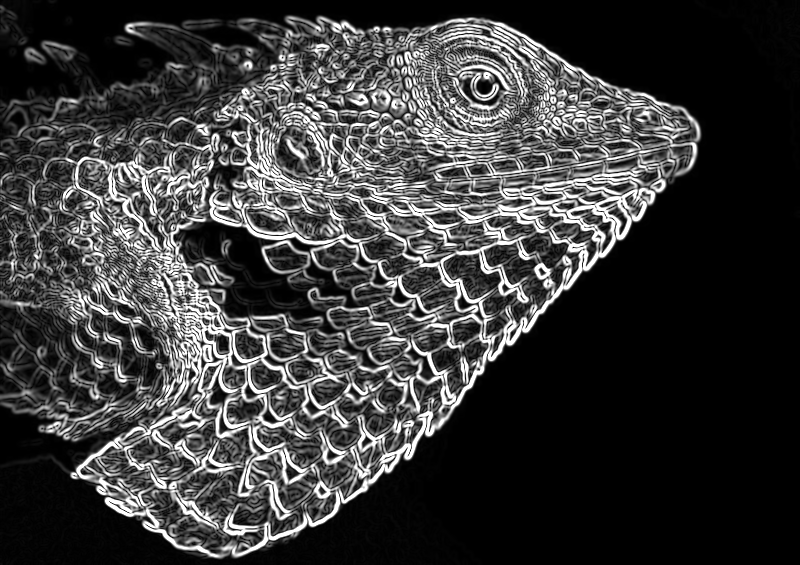
Here we can start to see the edges forming. Comparing this to the previous image, we can see that the bright areas no longer correspond to the direction of the light source in the original image, and the bright areas we are left with correspond with where there were sharp changes in brightness in the original image.
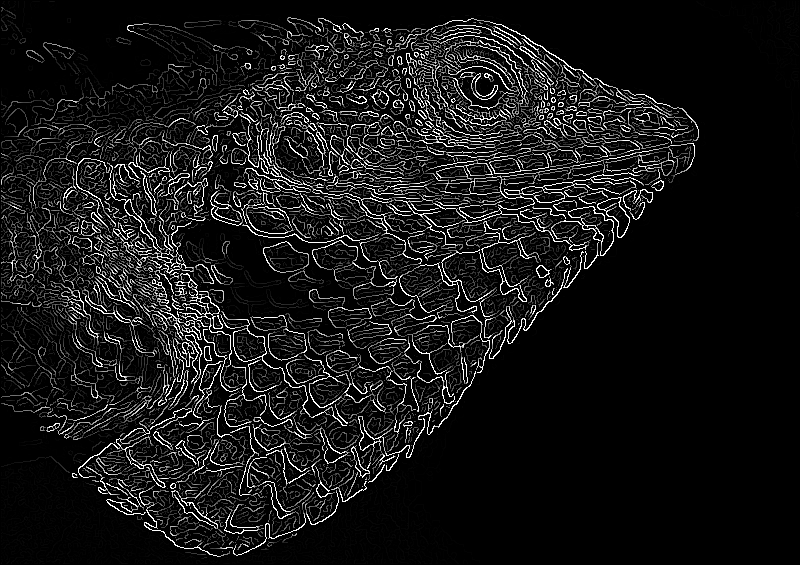
Step 3. Edge Thinning with Non-Maximum Suppression
Now that we’ve identified where in the image the brightness is changing, but some of the areas of brightness change are pretty thick. To say we’ve really found the “edges”, we need to determine where exactly the edge exists among those larger sections.
To do this, we apply Non-Maximum Suppression. This entails looking at each pixel, and determining if it is at the point along the intensity gradient where the intensity is changing the most. If a pixel is not where the maximum change is occurring relative to it’s neighbors, that pixel is “suppress” and it’s intensity information is removed. The result is only the pixels where the highest (local) change in intensity was occurring, leaving us with the thinner edges below.
Step 4. Double Threshold
Among the remaining identified areas are edges that are more and less likely to be significant. Now, we choose an upper and a lower threshold for intensity gradient. Each pixel is then binned into one of three categories:
- Pixels above the upper threshold are categorized as “strong edges“. These edges will all be present in the final accounting of edges.
- Pixels below the strong threshold, but above the lower threshold are categorized a “weak edges“. These will be decided on in the final step.
- Pixels below the lower threshold it is “suppressed“, and the intensity information is lost/removed.

Here we can see that we are left with only 3 values. Black pixels contain no edges, grey pixels are weak edges, and white pixels are strong edges.
Step 5. Hysteresis
All strong edges identified so far will be kept in the final image, but we need to determine which weak edges to keep. The heuristic that Canny used to decide on weak edges was whether or not the weak edge was connected to a strong edge. Weak edges that are connected to strong edges are considered to be more likely to simply be artifacts of a “true” strong edge.
In this final step, weak edges are subjected to blob analysis, to determine how connected the weak edge is to adjacent strong edges. Weak edges that are highly associated with strong edges are culled.
Most of the weak edges from our prior image were associated strongly enough with strong edges that they were removed, leaving us with the final result:
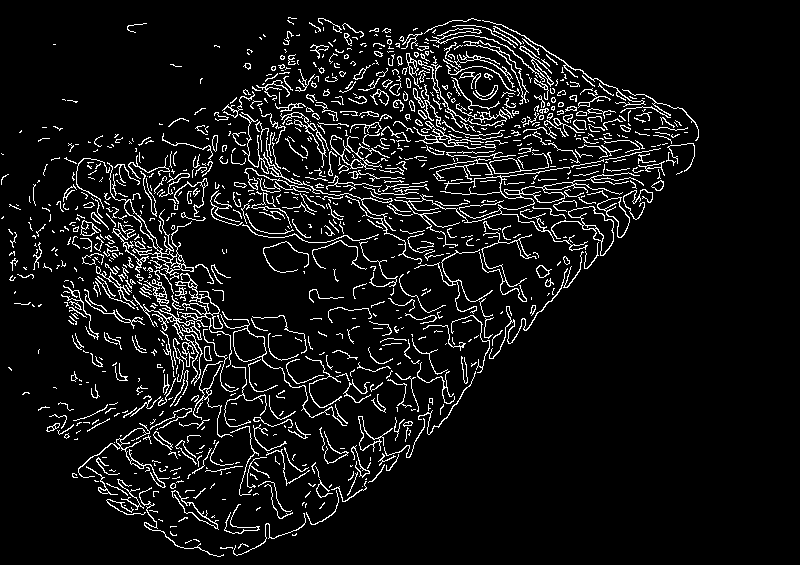
And compared to the original image…
While the result may not be perfect, we can see it did a remarkable job at identifying the most significant edges in the original image.
