- The research questions that you asked.
- What is the spatial distribution of volcanic vents in Harrat Khaybar, western Saudi Arabia? Are there spatial trends in volcanic vent distributions among the eruptive phases? Does the spatial distribution differ at various spatial scales?
- Is there a spatial correlation between the locations of volcanic vents and structural features (e.g., fractures, faults, and fissures) in Carrán-Los Venados Volcanic Field (CLV) in southern Chile? Does the relationship between the two variables differ at different spatial scales?
- What factors could lead to the differences in spatial correlation between the two variables at various spatial scales?
- A description of the dataset you examined, with spatial and temporal resolution and extent.
I examined spatial and temporal datasets including volcanic vent locations, fracture sites, and eruption ages of volcanic vents in two basaltic volcanic fields, Harrat Khaybar (HK) in western Saudi Arabaia and Carrán-Los Venados (CLV) Volcanic Field in southern Chile. Vent location (point-like features) and age data for the two study sites were available through my previous work (mapping and categorizing volcanic vents in Harrat Khaybar) and the literature (Bertin et al. 2019) using satellite images (spatial resolution = 30 m). However, structural feature data (line-like features) were limited to the CLV due to limitation of digital data in the HK. The temporal resolution component is not applicable in this project because the natural time spans of these geologic features are too wide. Thus, I estimated an overall time-averaged eruption rate of one eruption per 4427 years for the HK and one eruption per 250 years for the CLV assuming a Poisson distribution for inter-event times using available age data (Table. 1).
Table 1. Summary of the examined dataset in this project.

- Hypotheses: predictions of patterns and processes you looked for.
I predicted clustering of volcanic vents along the fractures. I expected that because structural features like faults are most likely to represent areas of crustal weakness at the time of magma emplacement.
- Approaches: analysis approaches you used.
- Point pattern analysis in ArcGIS pro:
- Multi-distance spatial cluster analysis (Ripley’s K function)
- Average nearest neighbor (ANN) technique.
- Quantitative and visual neighborhood analyses in ArcGIS pro and Excel:
- Concentric buffers and the number of points that fall within each buffer.
- Visual criteria.
- Results: what did you produce — maps? statistical relationships? other?
I could produce spatial probability maps and statistical relationships between my variables.
Ex. 1:
Figure 1a. The NNA analysis for All vents.
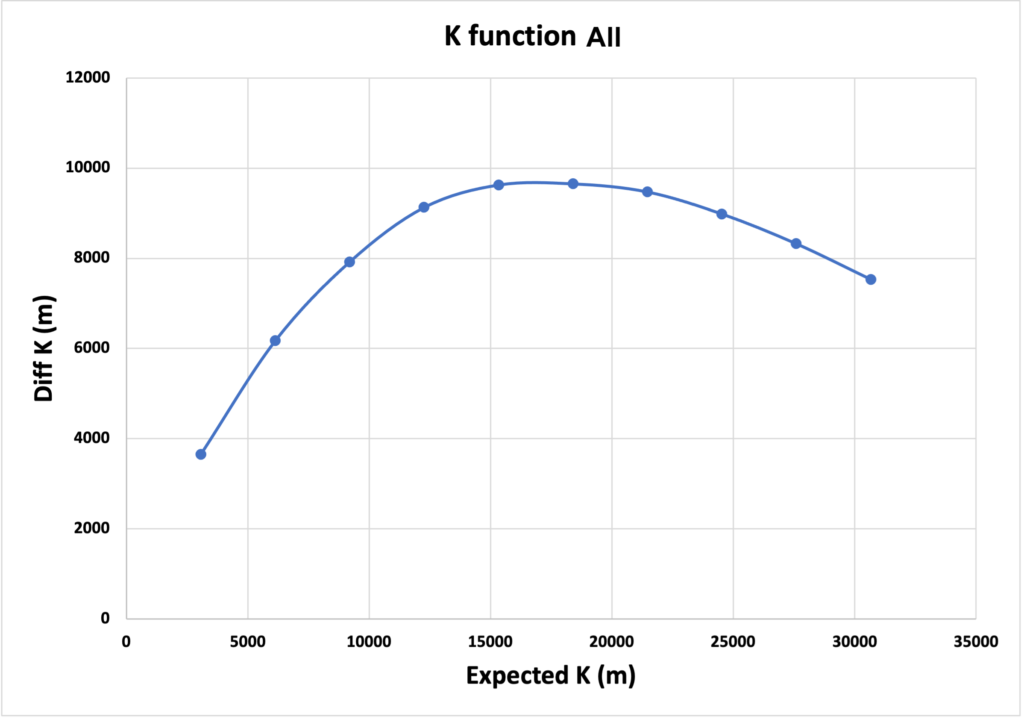
Figure 1b. K function for All vents.
*The ANN tool is useful for evaluating the overall spatial patterns while the Ripley’s K function is more useful for recognizing spatial patterns at various spatial scales. (i.e., it accounts for spatial variation in density with respect to distance).
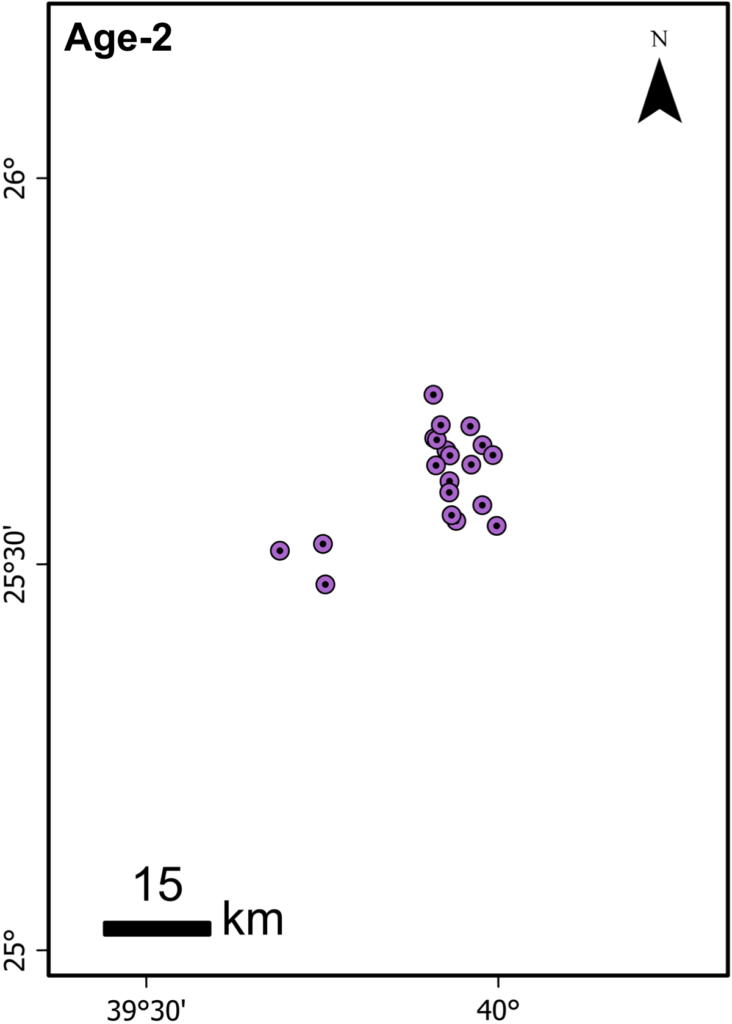
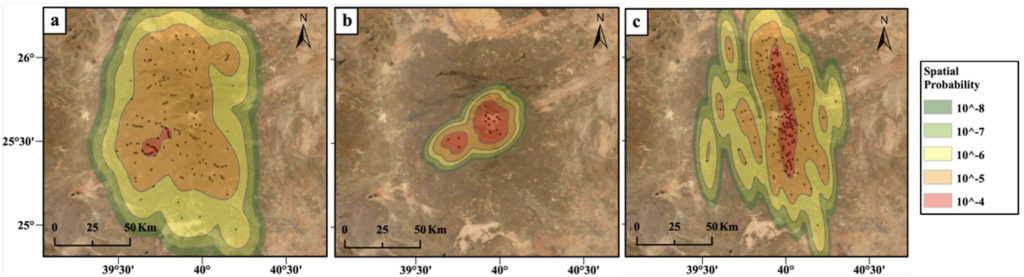
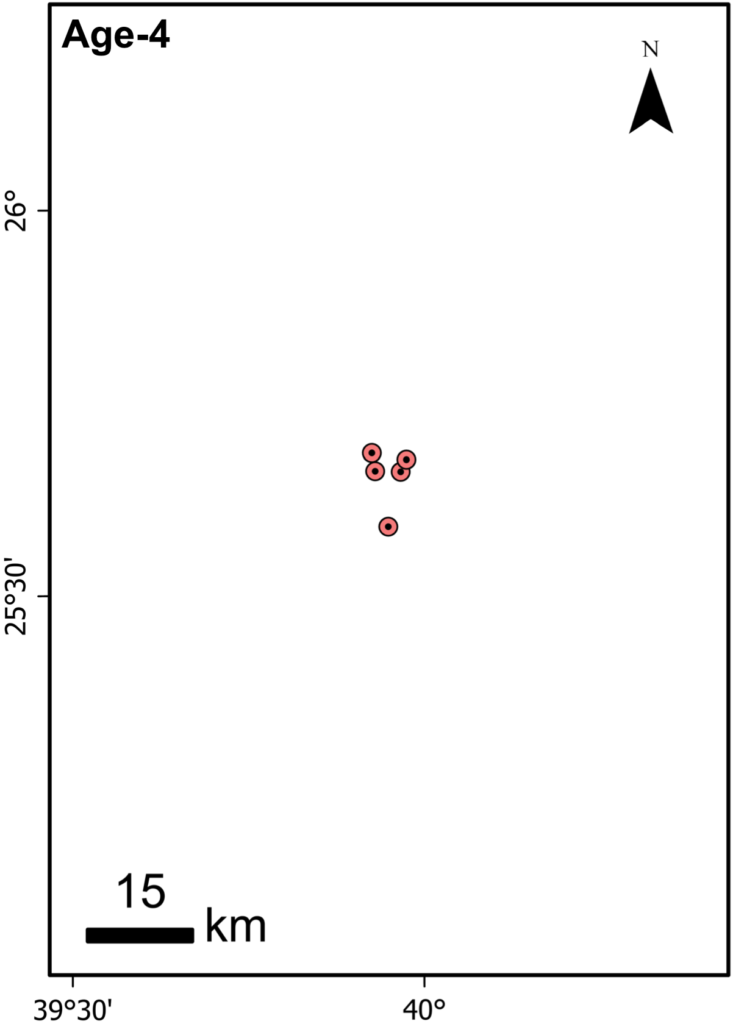
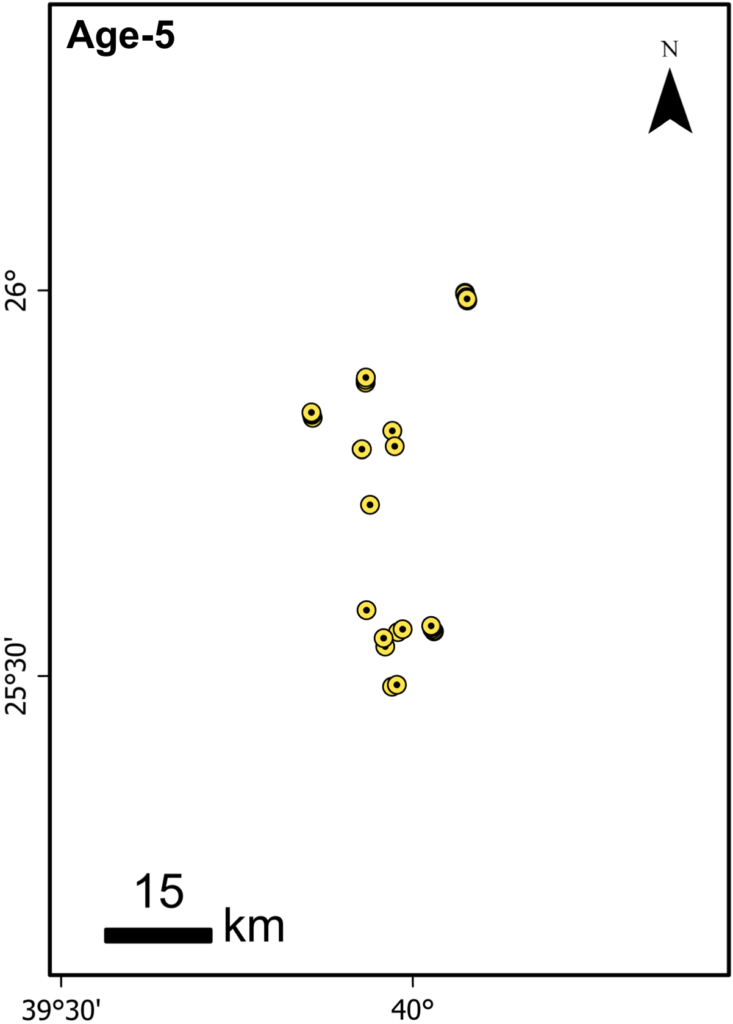
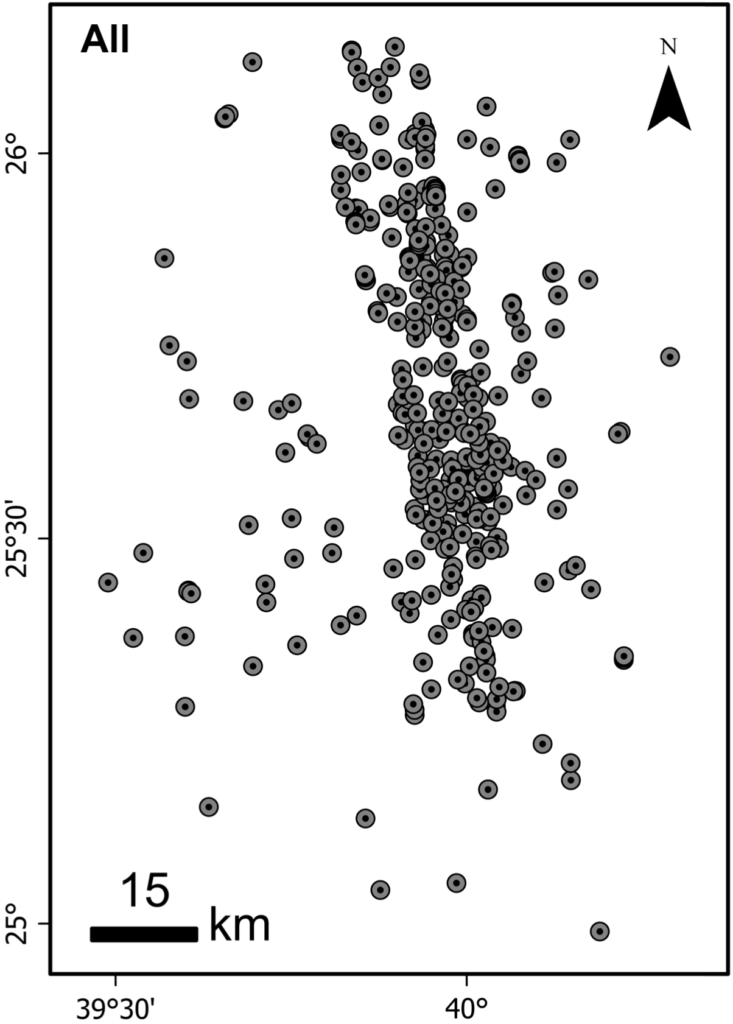
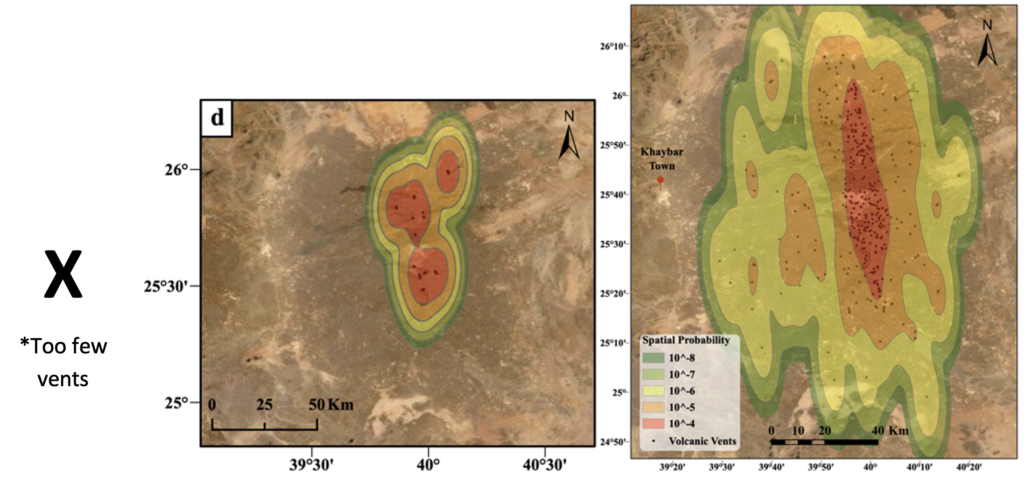
*Kernel density estimations for every eruptive phase, except Age-4 that has too few vents for such analysis, and for all vents together showing that volcanism at this volcanic field tends to cluster on the central part of the field throughout the time. Overall, all vents together indicate an elongated area of high probability density, (between 10-5 and 10-4) along the center of the harrat.
Ex. 2 and 3:
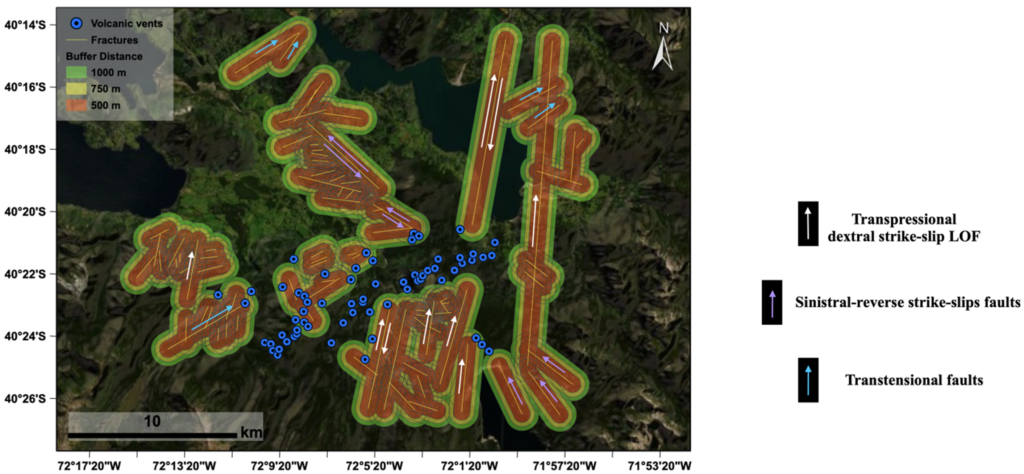
Table 2. Summary of the total number of vents fall in each buffer size.

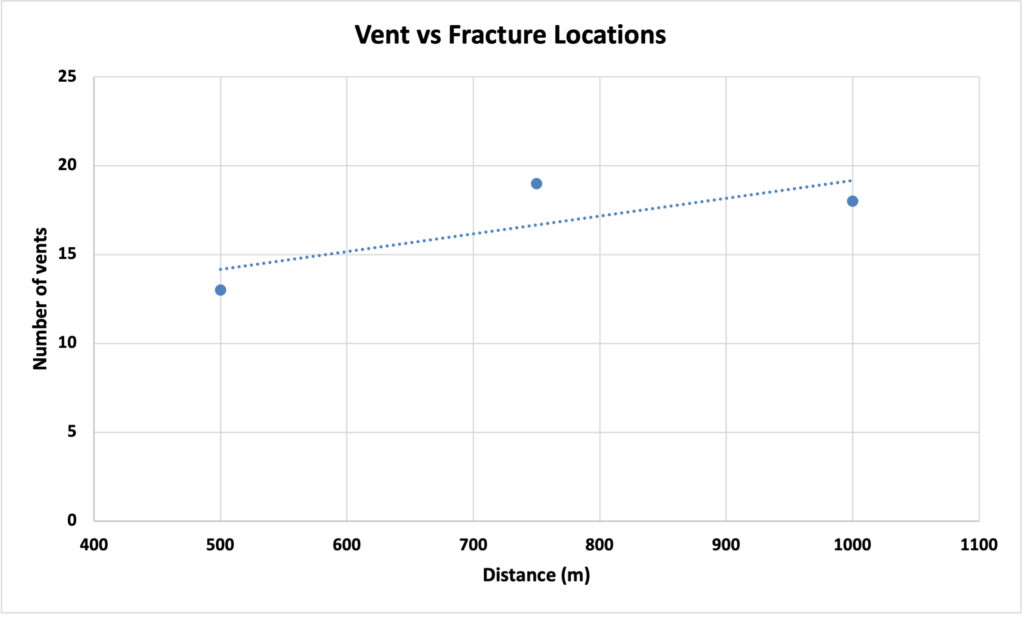
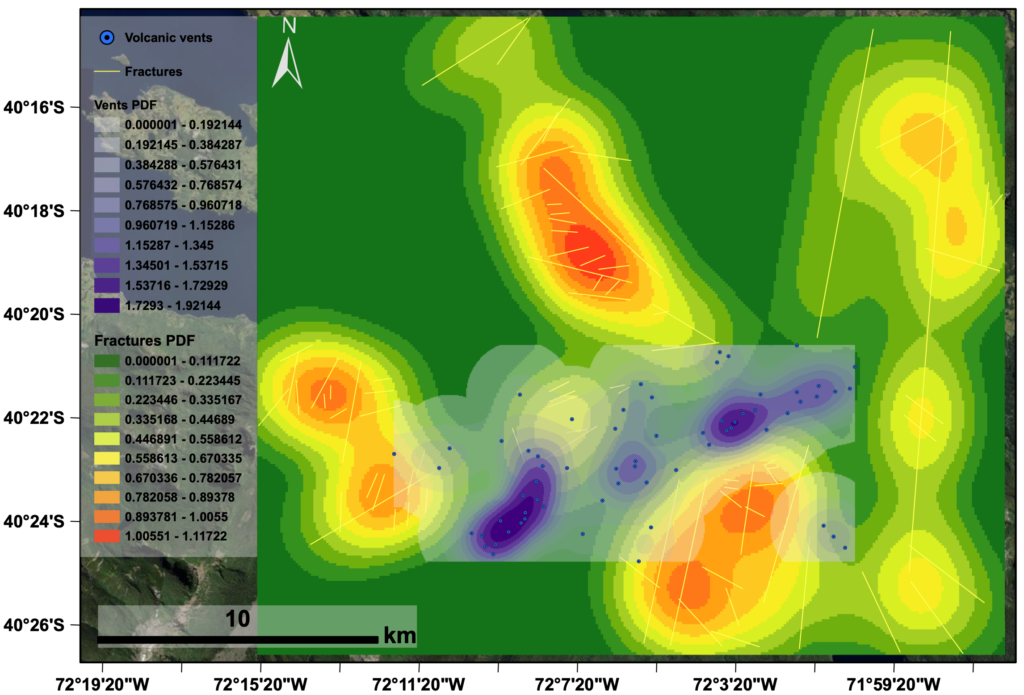
*The neighborhood analysis is useful for evaluating the spatial correlation between the two variables in the CLV. However, it does not capture the spatial correlation at various scales. The findings of the analysis indicate that there is no spatial correlation between the variables at all while it can be clearly seen that all volcanic vents are concentrated in the center and surrounded by the fractures.
What did you learn from your results?
- Spatial patterns of volcanic vents could differ in each eruptive stage and at various spatial scales, ranging in spatial distribution from clustered to dispersed or normally distributed.
- The spatial correlation between my two variables, volcanic vents and structural features, varies at different scales and from one field to another based on the geologic settings of each province.
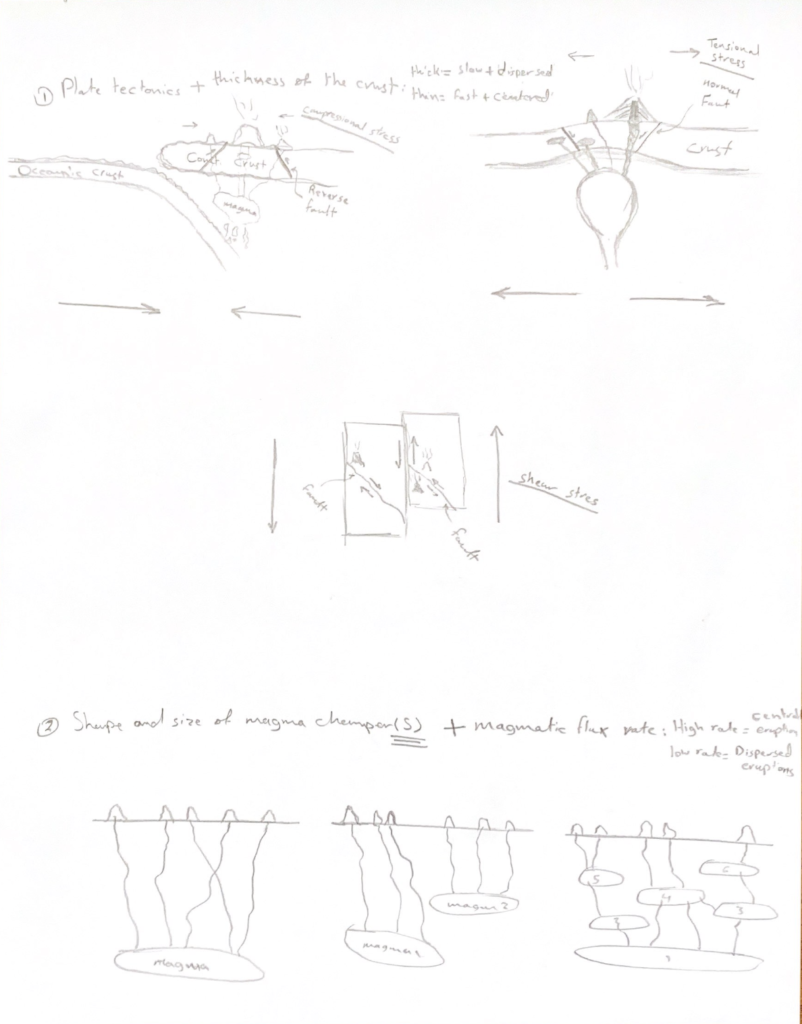
- There are several other factors that can influence the distribution of the volcanic vents in basaltic volcanic provinces such as the type of plate tectonics, size and shape of magma chamber/source(s), magmatic flux rate, and the thickness of the crust, Which impact the spatial correlation between the two variables at different spatial scales.
- Significance. How are these results important to science? to resource managers?
- My results can:
- Contribute to the scientific understanding of distributed volcanism, in particular the key controls of intraplate volcanic propagation and origin and migration of magma
- Contribute to the development of volcanic hazard analysis and risk assessments for distributed volcanic fields.
- Highlight that more data is needed to reveal the main factors that influence the spatial distribution of volcanic vents in distributed volcanic fields. A better understanding of the associated plate tectonics, modeling of magma sources and crustal thickness (profile), and better spatial and temporal records of both variables are needed since each field might have unique factors
- Software learning. Your learning: what did you learn about software (a) Arc-Info, (b) GIS programming in Python, (c) programming in R, (d) Modelbuilder in Arc,or (e) other?
I learned conducting different spatial analyses in ArcGIS Pro including multi-distance spatial cluster analysis (Ripley’s K function) and Average nearest neighbor (ANN) analysis to reveal the point pattern of volcanic vents in two distributed volcanic fields as well as quantitative and visual neighborhood analyses using concentric buffers to evaluate the spatial correlation between my two variables.
- Statistics learning. What did you learn about statistics, including (a) hotspot, (b) spatial autocorrelation (including correlogram, wavelet, Fourier transform/spectral analysis), (c) cross-correlation/regression (cross-correlation, geographically weighted regression [GWR], regression trees, boosted regression trees), (d) multivariate methods (e.g., PCA, multiple component analysis), (e) other techniques (change detection/confusion matrices, other)?
- I learned about statistics that:
- Different techniques for hotspot analyses such as the ANN and Ripley’s K function could result in different levels of details (i.e., spatial resolution), where the ANN tool is useful for evaluating the overall spatial patterns while the Ripley’s K function is more useful for recognizing spatial patterns at various spatial scales. (i.e., it accounts for spatial variation in density with respect to distance).
- Some parameters in the kernel density function may have significant impact on the final products such as the bandwidth, area shape, and number of points.
- Evolving question. How did the results of each analysis lead you to change/refine your question? Write out the original question you stated at the beginning of the class and restate the question(s) you now plan to address.
- How is the spatial pattern of volcanic vents in the volcanic field of Khaybar related to the spatial pattern of regional structural features (faults, fissures, and fractures) via plate tectonics.
- To what extent do the other factors (plate tectonic settings, size and shape of magma chamber/source(s), magmatic flux rate, and the thickness of the crust) influence the distribution of volcanic vents in distributed volcanic fields?
- Future techniques. What techniques would you like to explore to answer your research questions in the future?
- I would like to perform modeling techniques to model magma sources and crustal thickness (profile) using geology and remote sensing (e.g., LiDAR) to assess the contribution of the potential factors to the distribution of volcanic vents in basaltic volcanic fields.