Dr. KC Bierlich, Postdoctoral Scholar, OSU Department of Fisheries, Wildlife, & Conservation Sciences, Geospatial Ecology of Marine Megafauna (GEMM) Lab
The recent advancement in drones (or unoccupied aircraft systems, UAS) has greatly enhanced opportunities for scientists across a broad range of disciplines to collect high-resolution aerial imagery. Wildlife researchers in particular have utilized this technology to study large elusive animals, such as whales, to observe their behavior (see Clara Bird’s blog) and obtain morphological measurements via photogrammetry (see previous blog for a brief history on photogrammetry and drones). However, obtaining useful measurement data is not as easy as flying the drone and pressing record. For this blog, I will provide a brief overview on the basics of using photogrammetry to extract morphological measurements from images collected with drones, as well as the associated uncertainty from using different drone platforms.
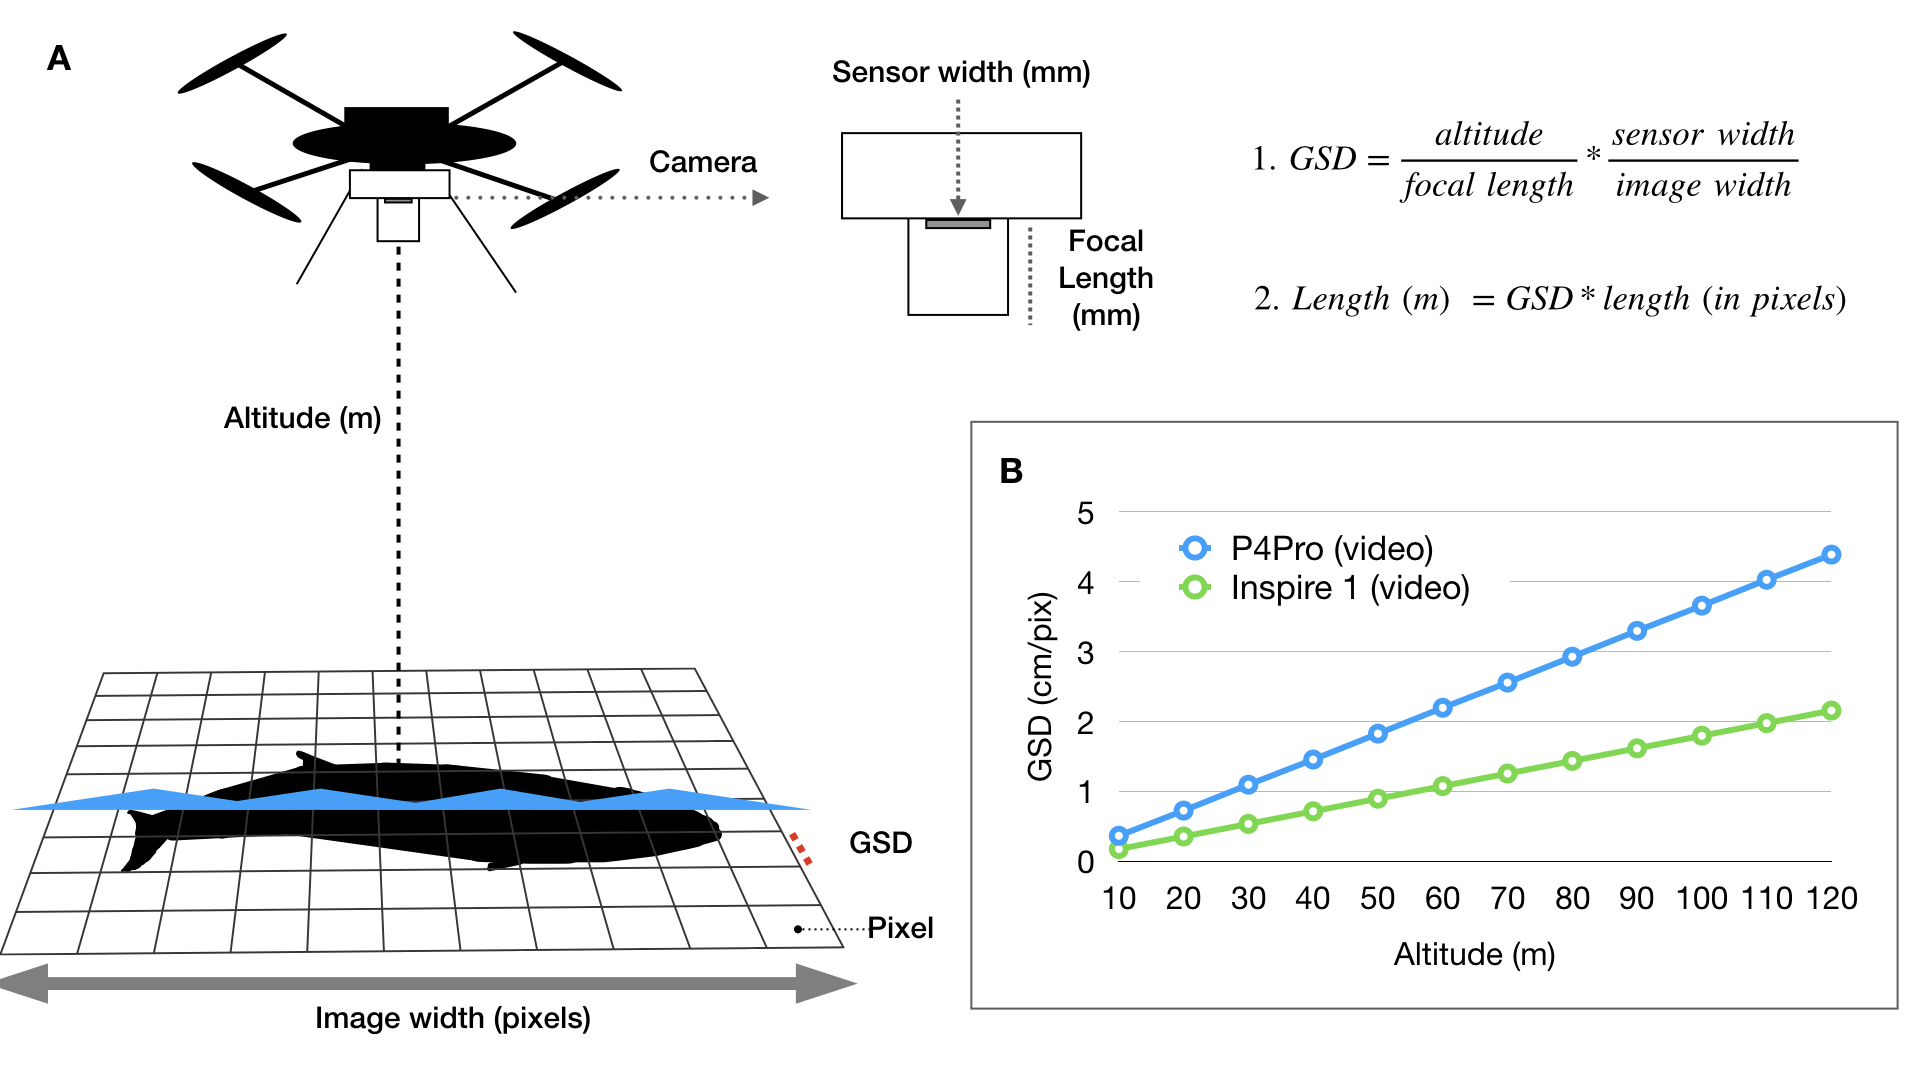
During my PhD at Duke University, I co-developed an open-source photogrammetry software called MorphoMetriX to measure whales in images I collected using drones (Fig. 1) (Torres and Bierlich, 2020) (see this blog for some fieldwork memoirs!). The software is designed to be flexible, simple to use, and customizable without knowledge of scripting languages. Using MorphoMetriX, measurements are made in pixels and then multiplied by the ground sampling distance (GSD) to convert to standard units (e.g., meters) (Fig. 2A). GSD represents the distance on the ground each pixel represents (i.e., the linear size of the pixel) and therefore sets the scale of the image (i.e., cm per pixel). Figure 2A describes how GSD is dependent on the camera sensor, focal length lens, and altitude. Thus, drones equipped with different cameras and focal length lenses will have inherent differences in GSD as altitude increases (Fig. 2B). A larger GSD increases the length each pixel represents in a photo and results in a lower resolution image, potentially obscuring important features in the photo and introducing measurement error.

Obtaining accurate altitude information is a key component in obtaining accurate measurements. All drones are equipped with a barometer, which measures altitude from changes in pressure. In general, barometers usually yield low accuracy in the altitude recorded, particularly for low-cost sensors commonly found on small, off-the-shelf drones (Wei et al., 2016). Dawson et al. (2017) added a laser altimeter (i.e., LightWare SF11/C, https://www.mouser.com//datasheet//2//321//28054-SF11-Laser-Altimeter-Manual-Rev8-1371857.pdf) to a drone, which yields higher accuracy in the altitude recorded. Since then, several studies have adopted use of a laser altimeter to study different species of baleen whales (i.e., Gough et al., 2019; Christiansen et al., 2018).
The first chapter of my dissertation, which was published last year in Marine Ecology Progress Series, compared the accuracy of several drones equipped with different camera sensors, focal length lenses, and a barometer vs. laser altimeter (Bierlich et al., 2021). We flew each drone over a known sized object floating at the surface and collected images at various altitudes (between 10 – 120 m). We used the known size of the floating object to determine the percent error of each measurement at each altitude. We found that 1) there is a lot of variation in measurement error across the different drones when using a barometer to measure altitude and 2) using a laser altimeter dramatically reduces measurement error for each drone (Fig. 3).

These findings are important because if a study is analyzing measurements that are from more than one drone, the uncertainty associated with those measurements must be taken into account to know if measurements are reliable and comparable. For instance, let’s say we are comparing the body length of two different populations and found that population A is significantly longer than population B. From looking at Figure 3, that significant difference in length between population A and B could be unreliable as the difference may be due to the bias introduced by the type of drone, camera sensor, focal length lens, and whether a barometer or laser altimeter was used for recording altitude. In other words, without incorporating uncertainty associated with each measurement, how do you trust your measurement?
Hence, the National Institute of Standards and Technology (NIST) states that a measurement is complete only when accompanied by a quantitative statement of its uncertainty (Taylor & Kuyatt, 1994). In our Bierlich et al. (2021) study, we develop a Bayesian statistical model where we use the measurements of the known-sized object floating at the surface (what was used for Fig. 3) as training data to predict the lengths of unknown-sized whales. This Bayesian approach views data and the underlying parameters that generated the data (such as the mean or standard deviation) as random, and thus can be described by a statistical distribution. Using Bayes’ Theorem, a model of the observed data (called the likelihood function), is combined with prior knowledge pertaining to the underlying parameters (called the prior probability distribution) to form the posterior probability distribution, which serves as updated knowledge about the underlying parameter. For example, if someone told me they saw a 75 ft blue whale, I would not be phased. But if someone told me they saw a 150 ft blue whale, I would be skeptical – I’m using prior knowledge to determine the probability of this statement being true.
The posterior probability distribution produced by this Bayesian approach can also serve as new prior information for subsequent analyses. Following this framework, we used the known-sized objects to first estimate the posterior probability distribution for error for each drone. We then used that posterior probability distribution for error specific to each drone platform as prior information to form a posterior predictive distribution for length of unknown-sized whales. The length of an individual whale can then be described by the mean of this second posterior predictive distribution, and its uncertainty defined as the variance or an interval around the mean (Fig. 4).
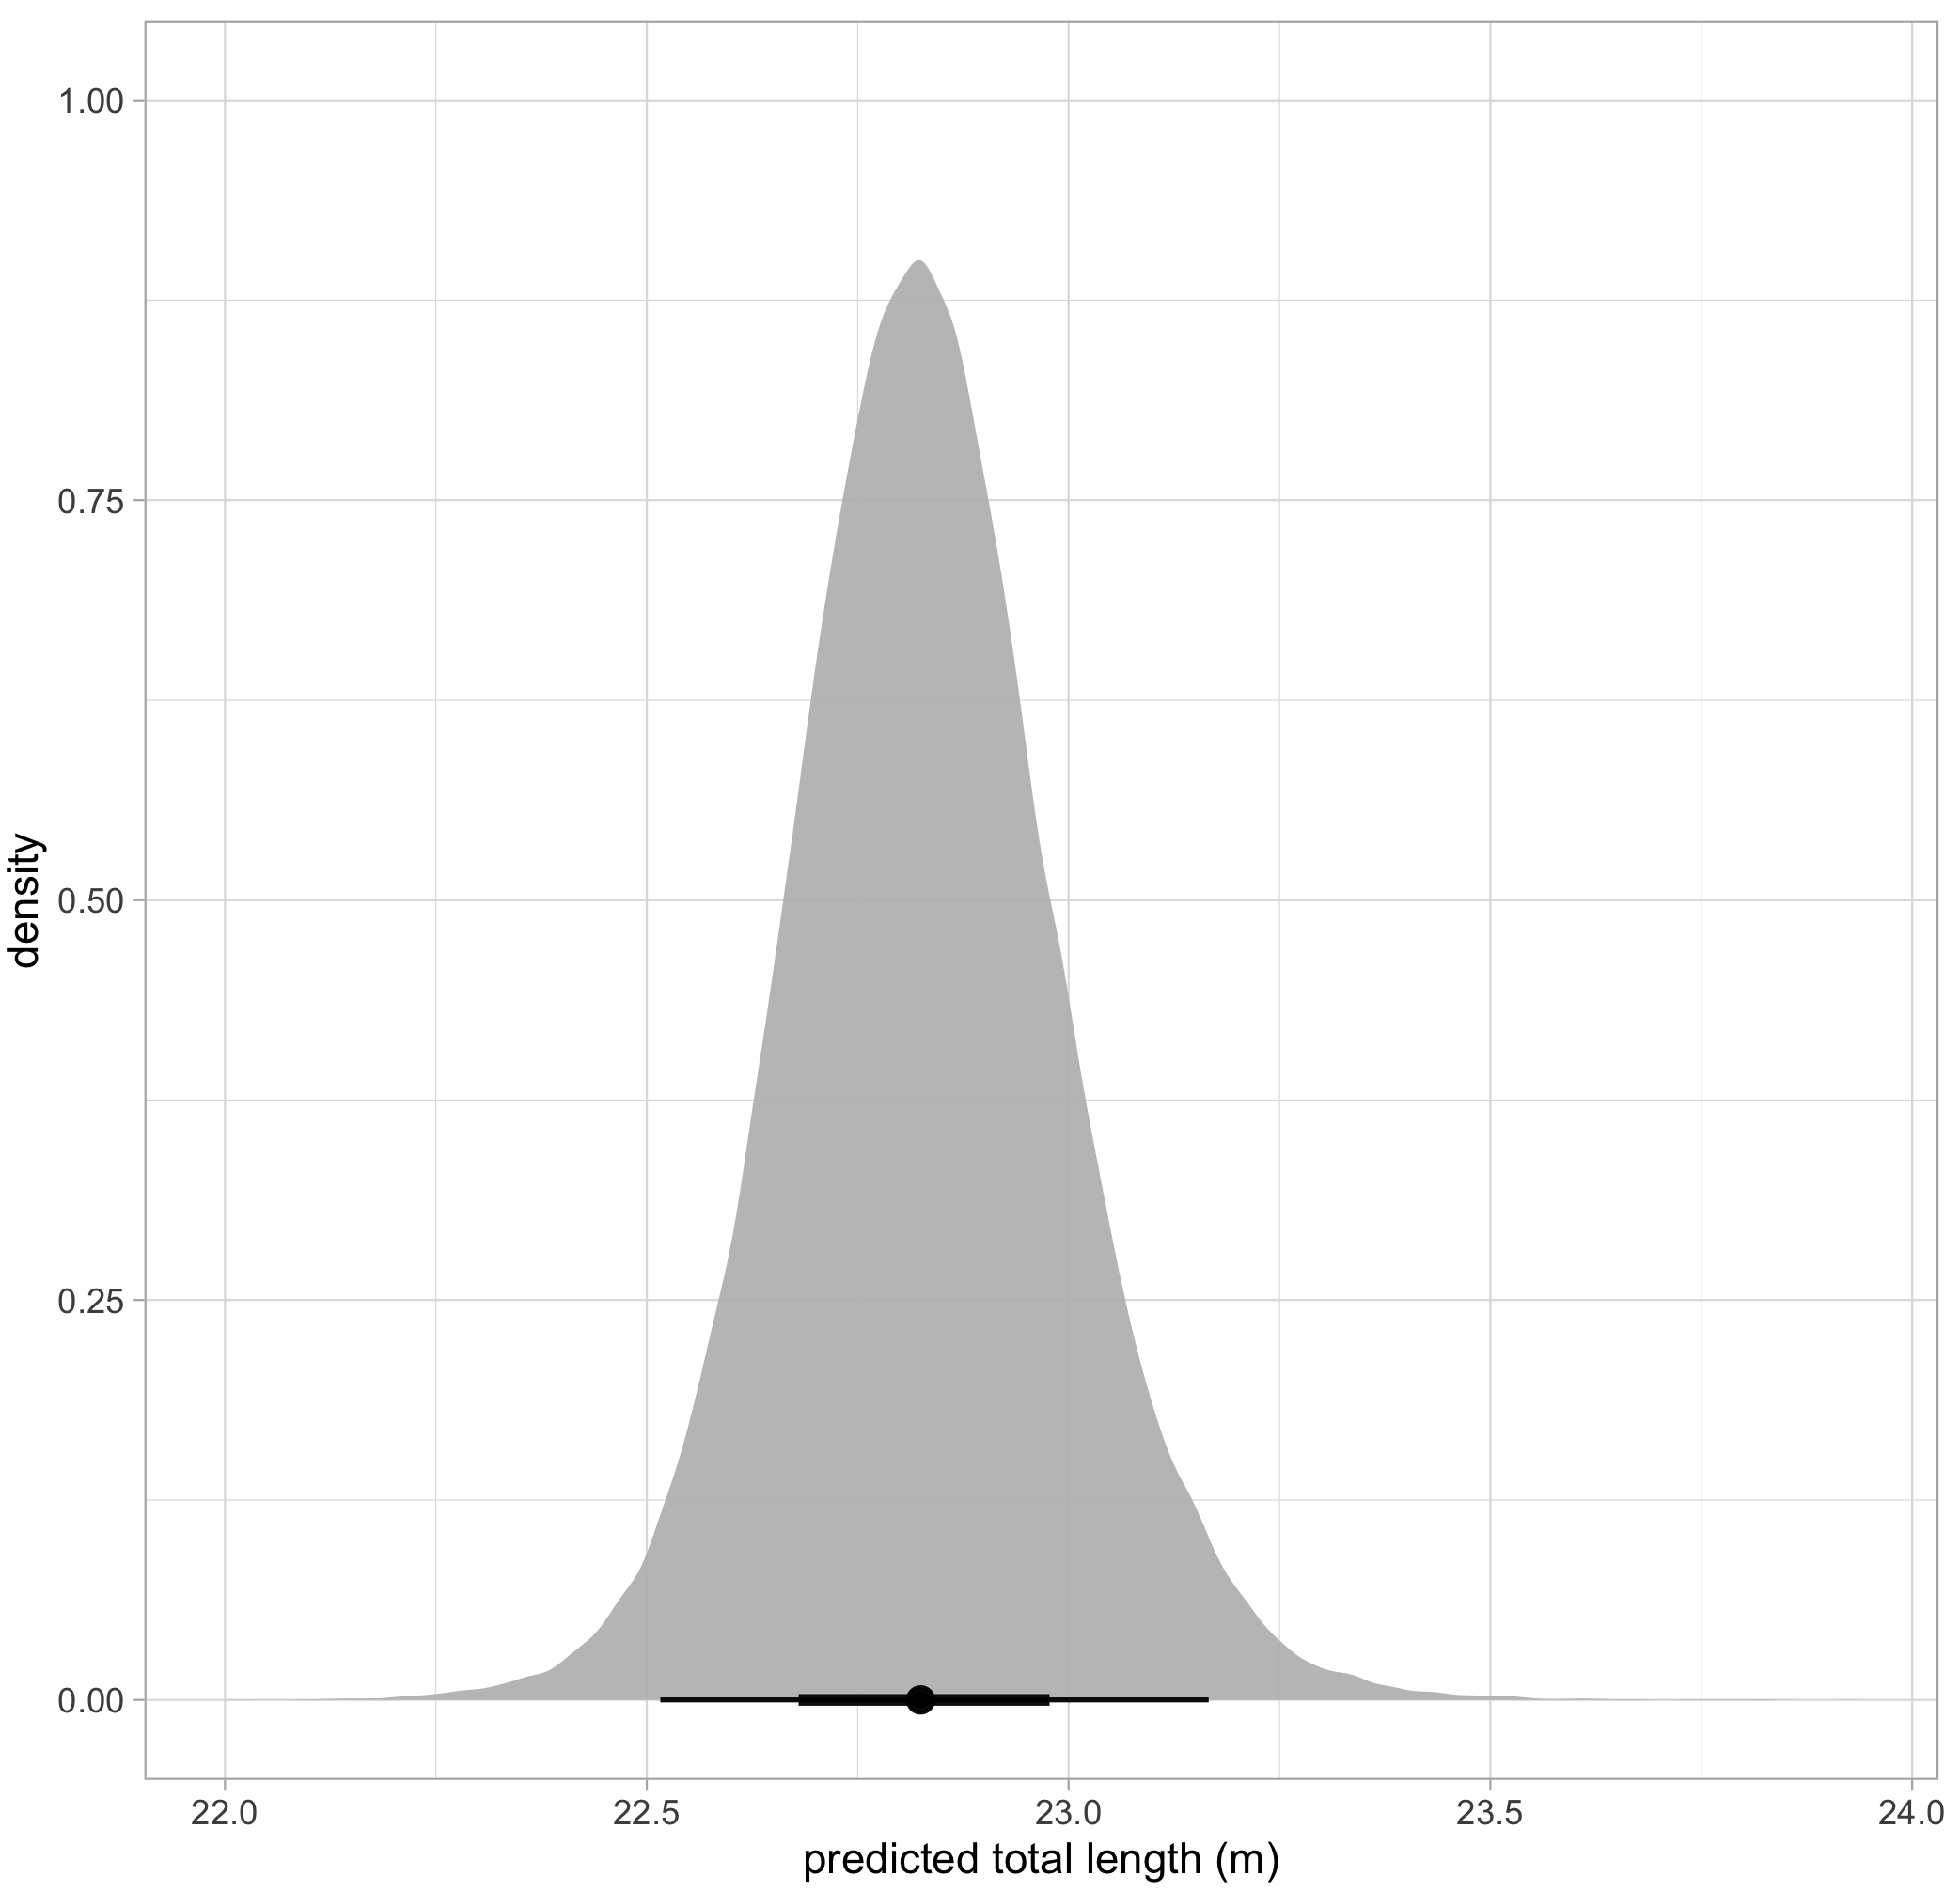
For over half a decade, the GEMM Lab has been collecting drone images of Pacific Coast Feeding Group (PCFG) of gray whales off the coast of Oregon to measure their morphology and body condition (see GRANITE Project Blog). We have been using several different types of drones equipped with different cameras, focal length lenses, barometers, and laser altimeters. These measurements from different drones will inherently have different levels of error associated with them, so adapting these methods for incorporating uncertainty will be key to ensure our measurements are comparable and analyses are robust. To do this, we fly over a known-sized board (1 m) at the start of each flight to use as training data to generate a posterior predictive distribution for length of the an unknown-sized PCFG gray whale that we fly over (Fig. 5). Likewise, we are working closely with several other collaborators who are also using different drones. Incorporating measurement uncertainty from drones used across research labs and in different environments will help ensure robust analyses and provide great opportunity for some interesting comparisons – such as differences in gray whale body condition on their feeding grounds in Oregon vs. their breeding grounds in Baja, Mexico, and morphological comparisons with other baleen whale species, such as blue and humpback whales. We are currently wrapping up measurement from thousands of boards (Fig. 5) and whales (Fig. 1) from 2016 – 2021, so stay tuned for the results!

References
Bierlich, K.C., Schick, R.S., Hewitt, J., Dale, J., Goldbogen, J.A., Friedlaender, A.S., Johnston D.J. (2021). A Bayesian approach for predicting photogrammetric uncertainty in morphometric measurements derived from UAS. Marine Ecology Progress Series. DOI: https://doi.org/10.3354/meps13814
Christiansen F, Vivier F, Charlton C, Ward R, Amerson A, Burnell S, Bejder L (2018) Maternal body size and condition determine calf growth rates in southern right whales. Mar Ecol Prog Ser 592: 267−281
Dawson SM, Bowman MH, Leunissen E, Sirguey P (2017) Inexpensive aerial photogrammetry for studies of whales and large marine animals. Front Mar Sci 4: 366
Gough, W.T., Segre, P.S., Bierlich, K.C., Cade, D.E., Potvin, J., Fish, F. E., Dale, J., di Clemente, J., Friedlaender, A.S., Johnston, D.W., Kahane-Rapport, S.R., Kennedy, J., Long, J.H., Oudejans, M., Penry, G., Savoca, M.S., Simon, M., Videsen, S.K.A., Visser, F., Wiley, D.N., Goldbogen, J.A. (2019). Scaling of swimming performance in baleen whales. Journal of Experimental Biology, 222(20).https://doi.org/10.1242/jeb.204172
Taylor, B. N., and Kuyatt, C. E. (1994). Guidelines for Evaluating and Expressing the Uncertainty of NIST Measurement Results. Washington, DC: National Institute of Standards and Technology. 1–25.
Torres, W.I., & Bierlich, K.C. (2020). MorphoMetriX: a photogrammetric measurement GUI for morphometric analysis of megafauna. Journal of Open Source Software, 5(45), 1825. https://doi.org/10.21105/joss.01825
Wei S, Dan G, Chen H (2016) Altitude data fusion utilizing differential measurement and complementary filter. IET Sci Meas Technol (Singap) 10: 874−879
