R’s default print function for data frames and matrices is not an effective way to display the contents, especially in a html report. RStudio created a R package, DT, that is an interface to the JavaScript library DataTable. DT allows users to have interactive tables that includes searching, sorting, filtering and exporting! I routinely use these tables in my analysis reports.
Install the DT package from cran
First, one must install and load the DT package. Open up RStudio and run the following commands to install and load the DT package:
# Install the DT package
install.packages("DT")
# Load the DT package
library(DT)
Example Table
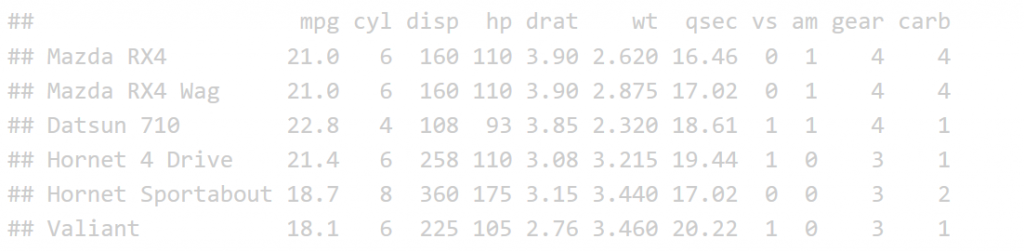
The print function is not the most effective was to display a table in an HTML R Markdown report.
print(head(mtcars))
Now let’s look at the datatable function for comparison. The input to the datatable function is a data frame or matrix. Let’s make a table with the preloaded iris data that’s in a data.frame. The basic call is DT::datatable(iris) but in our example I’ve added the filter option to the top of the table, and limited the number of entries to 5 per table. See code and table features below:
datatable(iris, filter = "top",
          options = list(pageLength = 5))
A screen shot of the output looks like:
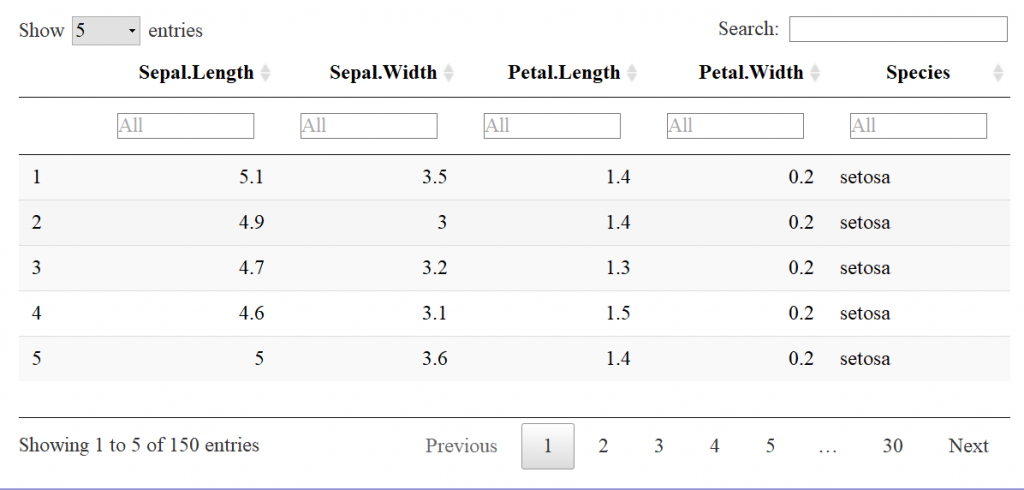
Already, the readability is much better than the base r function print. This is a JavaScript based table, stored in a HTML widget, so a flat image doesn’t convey all of the interactive features.
Features
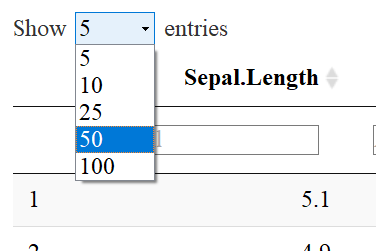
NUMBER OF ENTRIES TO DISPLAY
You’ll notice that there is a drop down menu that says: “Show 5 entries”. The default is 10, but I specified 5 as default with the code pageLength=5. One may select the number of entries to show by using the drop down menu like so:
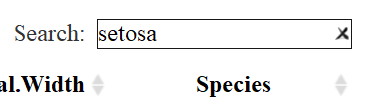
SEARCH BAR
The widget also includes a search bar on the top right corner which can be very useful when interactively exploring data. Note at the bottom of the table it shows you how many entries (rows) were found and are being displayed.

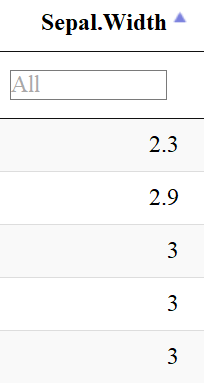
SORT COLUMNS
Notice that to the right of each column name are two arrows: ![]() One may sort by ascending or descending order and the direction of the blue arrow indicates by which direction you sorted the column.
One may sort by ascending or descending order and the direction of the blue arrow indicates by which direction you sorted the column.
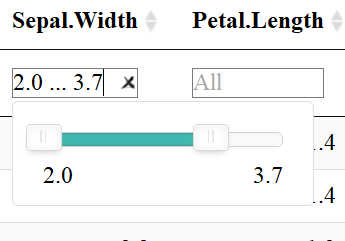
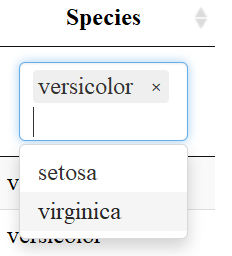
FILTER COLUMNS
The datatable function also allows users to filter each column depending on the datatype: filter numeric columns with a slider & filter columns of class factor with a drop down menu. One must add the filter = "top" (or bottom, etc.) to the code to enable this feature.
Export Data
Another useful aspect of the datatable function is the “Buttons” extension. This enables users to copy the table, save as a csv, excel or PDF file, or print the table. The table “remembers” what you’ve changed so far—so if you sort by Sepal Length, filter pedal width to > 1 and select species “versicolor” the copied/saved table will have these same restrictions.
datatable(iris,
          extensions = 'Buttons',
          options = list(dom = 'Bfrtip',
                         buttons = c('copy', 'csv', 'excel', 'pdf', 'print'))
The above code adds “buttons” to the top of the table like so:
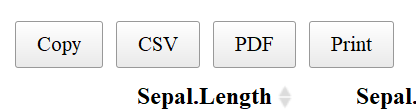
If one clicks “copy”, the table will be copied to your clipboard, “CSV” or “PDF” will save the table to the give file type, and “print” will bring put the table into a print friendly format and will bring up the print dialog box.
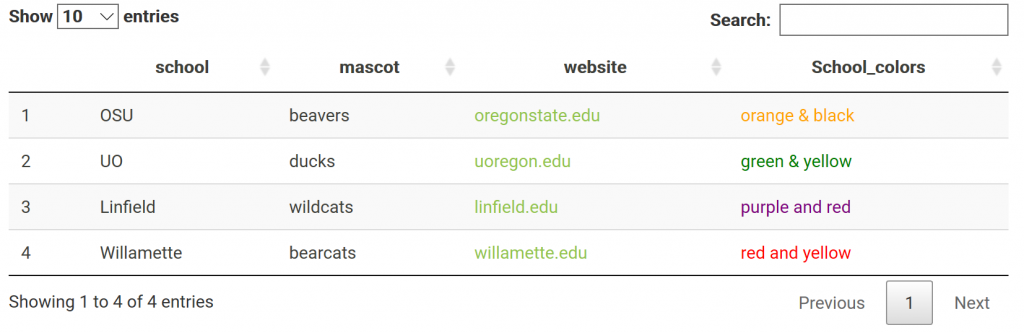
Links and Color
One may also have links in their table. Say you made a data frame with links you want to work in your html report. For example: a data frame of variants w/ links to their position in a genome browser. This is done through not escaping content in the table, specifically the column with the links. The links are made with html and must not be escaped to show up. This applies to other html as well; including color. For me, it was confusing that I had to not escape the html columns. Got it completely backwards the first time I tried it. NOTE: > got replaced with “& gt;” (with no spaces) when it is rendered on the blog… Need to find a fix!
# Make dataframe
df.link <- data.frame(school=c("OSU", "UO", "Linfield", "Willamette"),
                      mascot=c("beavers", "ducks", "wildcats", "bearcats"),
                      website=c('<a href="http://oregonstate.edu/">oregonstate.edu</a>',
                                '<a href="https://www.uoregon.edu/">uoregon.edu</a>',
                                '<a href="https://www.linfield.edu/">linfield.edu</a>',
                                '<a href="https://www.willamette.edu/">willamette.edu</a>'),
                      School_colors=c('<span style="color:orange">orange & black</span>',
                                        '<span style="color:green">green & yellow</span>',
                                        '<span style="color:purple">purple and red</span>',
                                        '<span style="color:red">red and yellow</span>'))

# When the html columns, 3 & 4, are not escaped, it works!
datatable(df.link, escape = c(1,2,3))
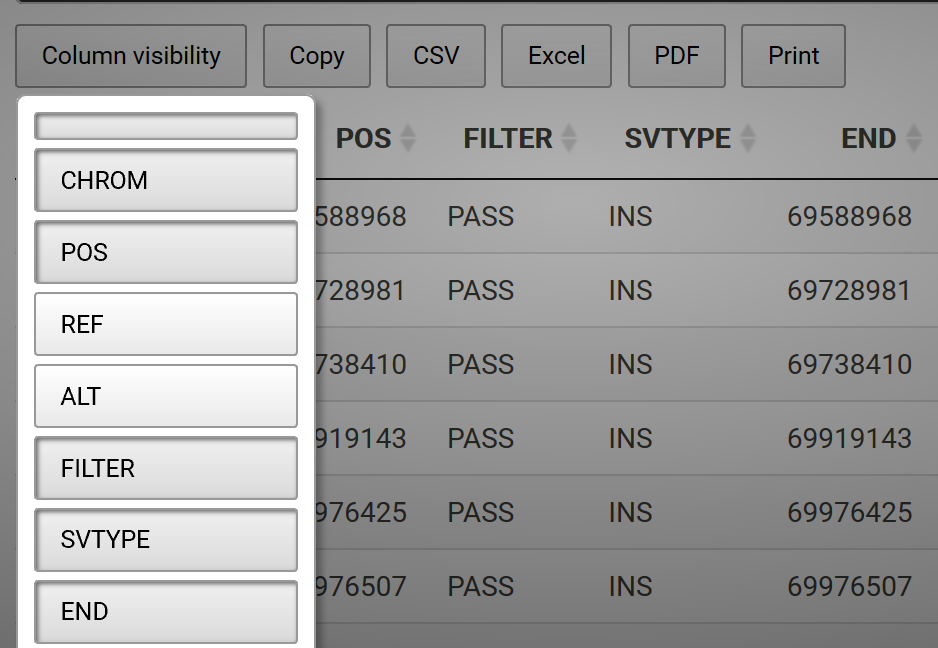
Column Visibility
One may also hide columns from visibility and add a button to add the column back interactively. For example, say we have a data frame called sv.all.i.in. We can hide columns 3 and 4, which are long sequences and disrupt the readability of the table, with the following code:
datatable(sv.all.i.in, extensions = 'Buttons',
          options = list(dom = 'Bfrtip', columnDefs = list(list(visible=FALSE, targets=c(3,4))),
                         buttons = list(I('colvis'),c('copy', 'csv', 'excel', 'pdf', 'print'))))
Learn More
There are many more useful features that you can add to your datatable! Learn more here: https://rstudio.github.io/DT/