Here at OSU, we have Google Analytics already set up on most sites. All the data lives under one account so we can get a sense of the big picture. But, if you work for an individual department or unit, you probably only want to see the data for your site, not everyone’s.
You can create a segment to see only your site’s data.
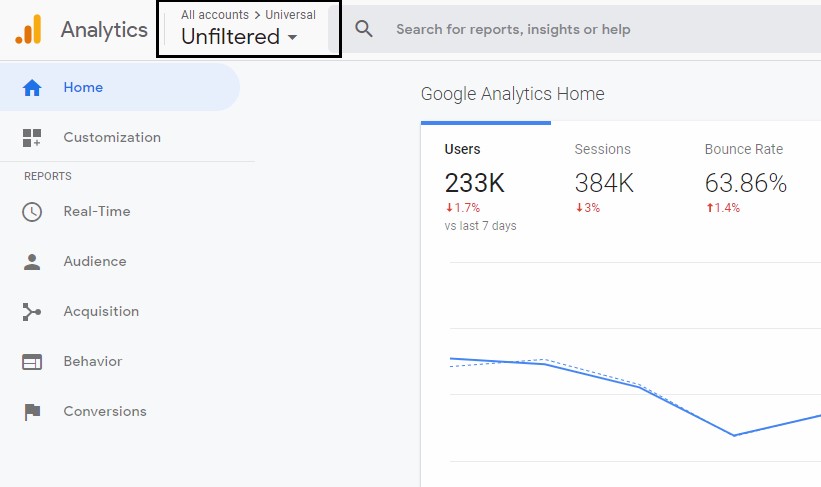
- Log into Google Analytics.
- Request access to the universal property if you haven’t already.
- Click on the property menu in the upper left-hand corner
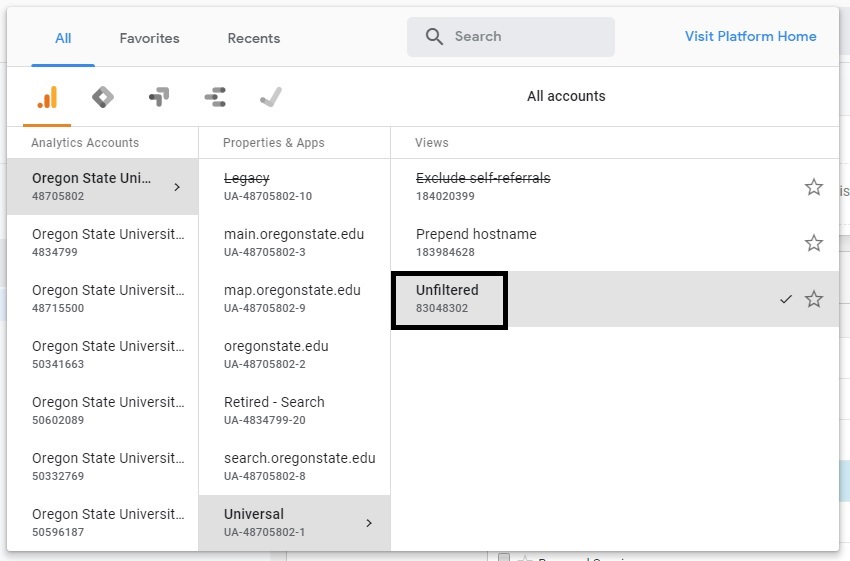
- Under the Oregon State University – Core account, select the Universal property and the Unfiltered view
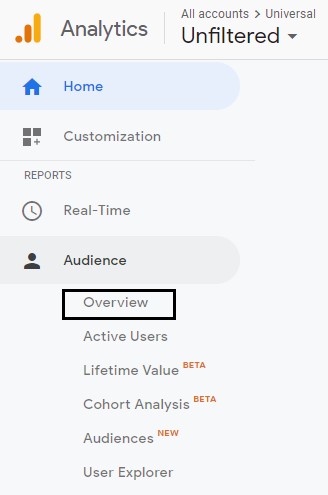
- Click on the Audience, then click on Overview
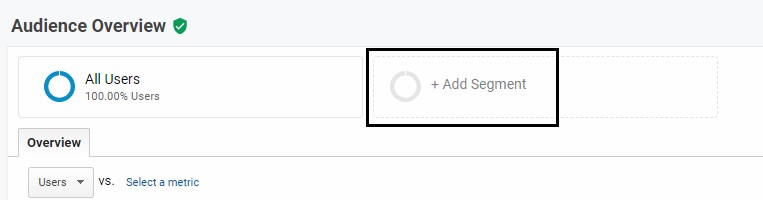
- Click on +Add Segment
- Click on New Segment

- Type a name into the Segment Name next to the blue Save button.
- Click on Conditions under Advanced
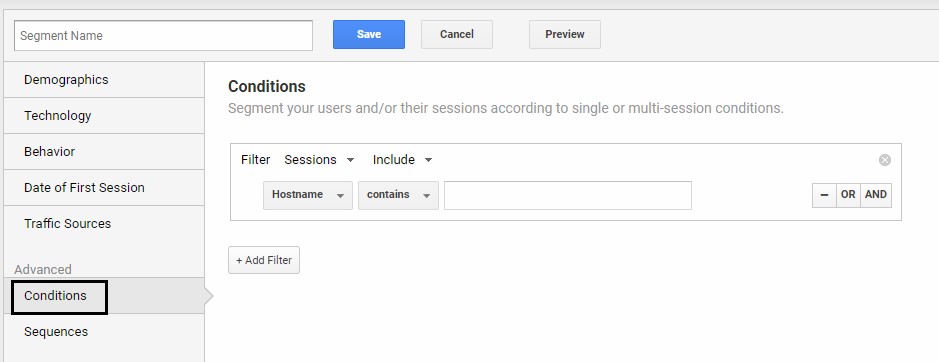
- Then click on Ad Content to change the dimension that you will filter by.
- Click in the search bar and start typing Hostname
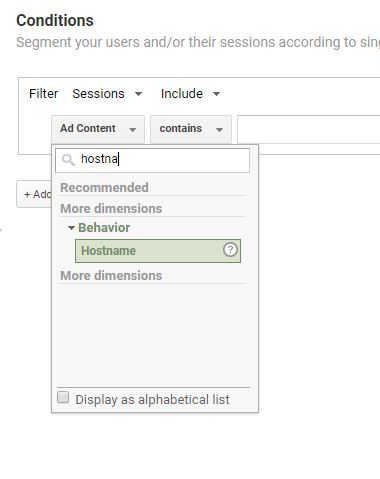
- Click on the search result to select it.
- Change the Contains option to Exactly Matches.
- In the text box, type in your site’s hostname. For example: communications.oregonstate.edu. Don’t include “www” or “https.”
- Then click the blue Save button.
You can now apply this segment to any report in Google Analytics to only see the data for your website. Here’s how:
- When viewing any report, click on the All Users segment, which is selected by default.
- This will bring up a list of all the segments you have created. Select the one you just created to see only your website data.
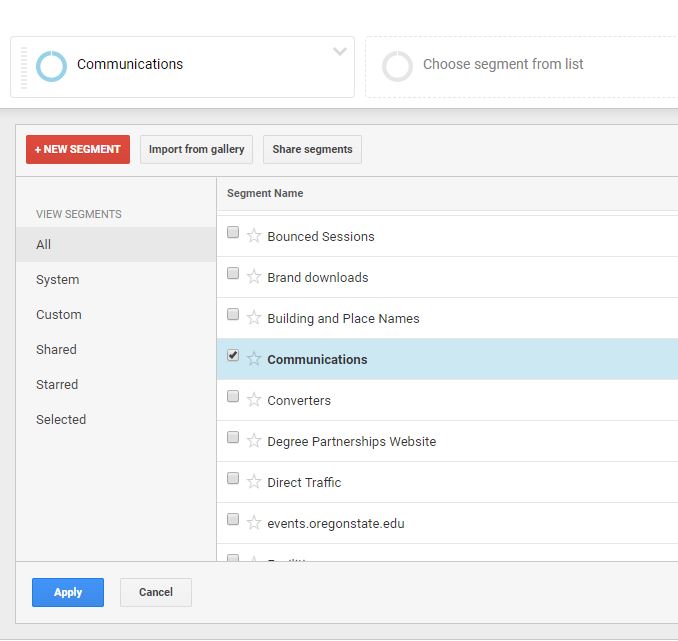
- Click on Apply, which will apply the segment to the data in the report. You can apply this to any report in Google Analytics, such as Behavior or Acquisition.
You can also check out pre-built segments that show a subset of data: visitors from the state of Ohio or people viewing your website with a tablet. There are a lot of options already there if you don’t want to build your own.
If you want to delve deeper, check out Google’s documentation on segments.