If you haven’t checked out beav.es/analytics, I encourage you to do so, now, without delay. It’s a dashboard that shows the analytics for your site at a glance. It’s useful if you need to look at basic statistics or want to easily share data with your stakeholders.
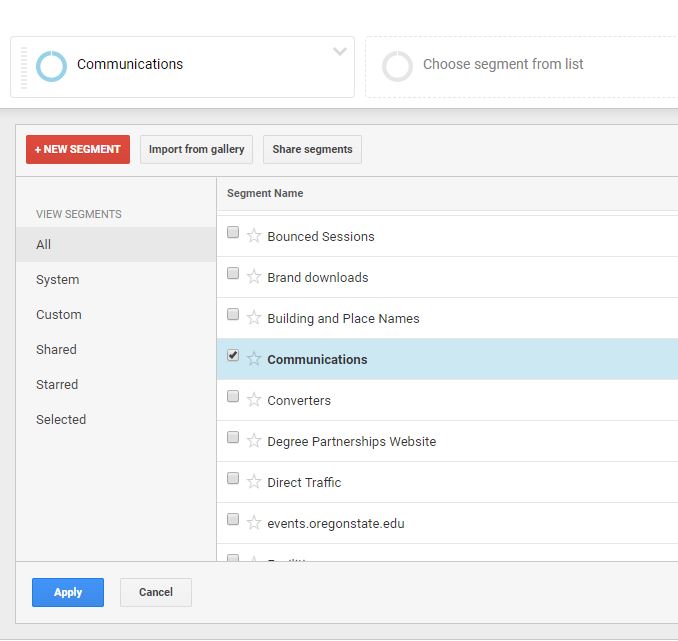
By default, the dashboard will show data for all centrally hosted sites at OSU. You can filter the data by selecting your site from the list in the left hand corner.
If you’re not familiar with Google Analytics vocabulary, here’s a guide to some of the terms.
Definitions
Pageviews
The number of times your pages have been viewed. If someone hits refresh on the page 8 times, all of those instances will be counted. If someone goes to another page and then comes back, it’s also counted.
It’s normal to see a dip in traffic on Saturdays and Sundays.
Sessions
Think of this as a time that someone got on their computer and clicked around on your site, then got up and watched videos of cats on their phone while sipping a cup of coffee. This would count as 1 session, even though they viewed multiple pages. The session ends when they’ve been inactive for 30 minutes or left your site. (There are a lot of cat videos out there, so they’ve been gone for a while.)
Top Content
Shows the pages with the highest number of pageviews. It lists the path portion (the end part) of the URL and won’t include the domain name.
For example: “communications.oregonstate.edu/brand-guide” would be listed as “/brand-guide”.
When it lists only “/” that indicates the homepage of your site.
Top Mediums
Are ways people find your site. Think of these as the broad categories, rather than specific sources like “google.com” or “search.oregonstate.edu”
Organic
Someone used a search engine, like Google, Bing, or Yahoo, to find your site. They clicked a result that wasn’t an ad.
None
Can mean several things. A visitor to your site may have:
- Typed the URL in the address bar
- Clicked on a link to your site in a desktop program like Outlook or Thunderbird
- Used a bookmark
- An aggressive ad blocker that prevents tracking
It’s better to think of “none” as more of an unknown category.
Referral
People visited by clicking a link on a different website. For example, a high school student is looking at colleges on the US News College Rankings list. In the section about OSU, they click on a link that goes to the admissions site. That would count as a referral.
Referrals can also be other OSU websites that are on separate domains or aren’t centrally hosted.
CPC/SEM
This is traffic generated through paid advertising campaigns.
Is just that. Someone clicked a link in an email.
Other Categories
When creating ads, you can assign names to a medium using a custom URL (UTM parameters). Other names in this list besides the default ones listed above are from these custom campaigns.
Landing/Exit Pages
Say you’re researching for your next vacation, so you Google “Hawaii beaches.” You click on the first search result that has a tranquil and idyllic picture of a pristine beach.
That page you landed on is probably not the homepage of a website, but rather a page nested within the site. That page, “Hawaii beaches,” is your landing page.
Then, say you click around on a couple of pages to check out standup paddle boarding, the snorkeling options, and then you reach the prices page. Yikes! That’s a tad out of your budget for the trip, so you go back to your search. The price page would be your exit page.
For more information about Google Analytics, you can check out their help center or come to Open Lab.