Categories
Digital Tips and Tutorials

How to create a segment in Google Analytics

Here at OSU, we have Google Analytics already set up on most sites. All the data lives under one account so we can get a sense of the big picture. But, if you work for an individual department or unit, you probably only want to see the data for your site, not everyone’s.

You can create a segment to see only your site’s data.

  1. Log into Google Analytics.
  2. Click on the property menu in the upper left-hand corner
  1. Under the Oregon State University – Core account, select the Universal property and the Unfiltered view
  1. Click on the Audience, then click on Overview
  1. Click on +Add Segment
  1. Click on New Segment
  1. Type a name into the Segment Name next to the blue Save button.
  2. Click on Conditions under Advanced
  1. Then click on Ad Content to change the dimension that you will filter by. 
  2. Click in the search bar and start typing Hostname
  1. Click on the search result to select it. 
  2. Change the Contains option to Exactly Matches.
  3. In the text box, type in your site’s hostname. For example: communications.oregonstate.edu. Don’t include “www” or “https.” 
  4. Then click the blue Save button.

You can now apply this segment to any report in Google Analytics to only see the data for your website. Here’s how:

  1. When viewing any report, click on the All Users segment, which is selected by default. 
  2. This will bring up a list of all the segments you have created. Select the one you just created to see only your website data. 
  1. Click on Apply, which will apply the segment to the data in the report. You can apply this to any report in Google Analytics, such as Behavior or Acquisition.

You can also check out pre-built segments that show a subset of data: visitors from the state of Ohio or people viewing your website with a tablet. There are a lot of options already there if you don’t want to build your own.

If you want to delve deeper, check out Google’s documentation on segments.

Categories
Social Media Tips and Tutorials

How to crosspost videos in Twitter Media Studio

Make sure you are logged in and viewing Studio.twitter.com or log in by going to Twitter Ads → Creatives tab → select Media.

Click the Upload button at the top-right of the page and select the video you want.

Give your video a name. For example, Benny learns how to cook | #GoBeavs

Select the best thumbnail. These should be catchy and draw in the viewers.

Next, click the sharing tab.

You can type the handle of the accounts you want to share with.
Example: @OregonState

Once completing the steps above, your video will be crossposted. However, it does not send a notification to the other account. It’s helpful to give them a heads up that you added it to their library.

How to know if a video has been crossposted to you:

In the upper left-hand corner where it says Library there is a dropdown menu. Click Shared Media to be able to view any content that has been crossposted to your account.

Once you are in the shared media section you can see everything that has been shared with you. To post, click the tweet button and add in your copy or other components. Then you can send it out directly or schedule for later! 

Crossposting will help us share content easily and collaborate more. If you have a big announcement or project coming up it doesn’t hurt to give people a heads up. Slack is a great tool for letting people know a video was crossposted.

We will not be able to share all content that is crossposted with us on the institutional level account (@oregonstate) but please don’t hesitate to share. We will do our best to integrate it into our schedule.

Categories
Digital Tips and Tutorials

Getting Started with Google Analytics

Google Analytics is a tool that shows you how people are using your website. You now have a few options for using it here at Oregon State University.

  1. Request access to the universal Google Analytics account if you want to just want to pop in and grab your data. We take care of the account level management for you. You will need to create a segment in order to see only your site’s data.
  2. Go to beav.es/analytics to view the university-wide dashboard. You can select your own site to see any date range of analytics. This is useful for sharing your data with stakeholders or if you don’t want to learn Google Analytics layout.
  3. Create your own Google Analytics account if you want to manage your own account and have more autonomy. You can manage user access, share with 3rd party companies, and do more advanced tasks. Once you’ve created your account, you’ll need to add the tracking ID to your Drupal site. Be sure to check with us first to see if there is already an account that we could transfer ownership to you.

You can get started on your own or come to Open Lab if you want some help.

Categories
Brand Guidelines

OSU branding and Illustration

Our brand style uses strong photography to tell the story visually. However, there are limited circumstances where illustrations may be used because a photo would not be effective. In cases like this, we ask that the illustrations only be used for one year, because the art could be considered a logo if used for multiple years. Please note that stylized, hand-drawn or cartoon images of beavers are not allowed.

If you are unsure if you are in a situation where you can use an illustration instead of a photo, we’ve put together a flow chart to quickly reach an answer: Download a printable version.


Just as a reminder, all the information below is available at our Illustration page in the OSU Brand tools.

Illustrations are allowed for:

  • Events
  • Magazines
  • Scientific Illustrations
  • On-campus awareness campaigns (intended to educate others about specific topics or issues, ie. bike safety, illness outbreaks)
  • Holiday cards
  • Motion graphics

Illustrations are not allowed for:

  • Ongoing programs
  • Repeated use from previous years
  • Stylized, hand-drawn or cartoon images of beavers
  • Recruitment materials for prospective students
  • External advertisements

Happy designing!

Categories
Digital Tips and Tutorials

Search Engine Optimization (SEO) Tips

You’ve created a beautiful webpage that has the most important information your department or organization can offer. It’s got great pictures, an attractive layout,  and well written, organized content. And you want the world to see it. Yet you get complaints that it can’t be found with a thorough Google search. Have no fear–there are a few simple things you can do to help your website become more visible in search results. The methods and techniques to increase findability of a site are called Search Engine Optimization (or SEO).

Create Good Content

One of the best things you can do for your SEO is to have well-written content that provides the information what your visitor is looking for. Clear and concise language will take you far. Search engines are about connecting people to the information they need. So if your webpage doesn’t accomplish the user’s goal, then it won’t show up high up in search results.

Hone Your Keywords

Keywords refer to what people type into the search bar. On a basic level, if your website has those same words, the search engine will display your website as a result. The keywords you choose should reflect the essence of your webpage. What answer does your webpage provide? What is your webpage about? What is your goal for this page? You can include keywords in your headings and copy of the page. But, don’t force them into every nook and cranny–the language should still be natural.

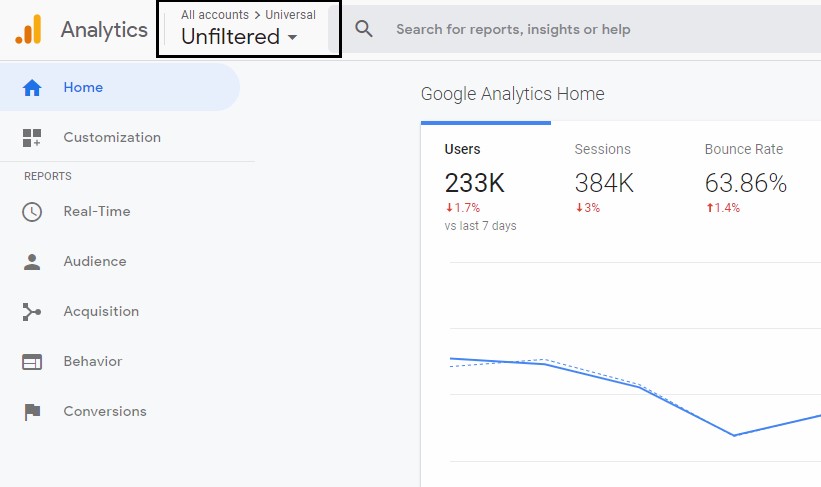
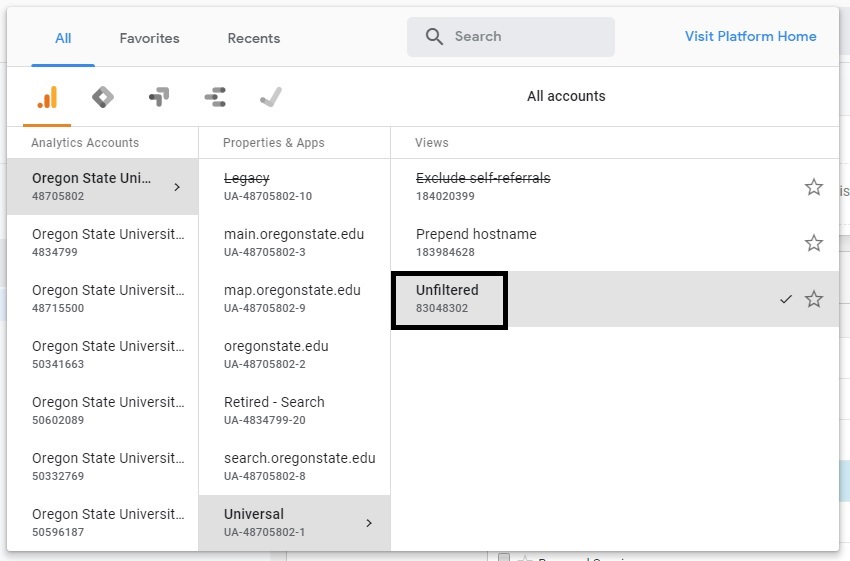
Don’t limit yourself to one word for each concept. Google’s ability to understand natural language is getting better every day, so be sure to include other words that you think your audience would use to find what you’re offering. Google Search Console will give you a good idea of what terms people are using to get to your site. If you have access to your department’s Google Analytics account, then you can set up Google Search Console.

Take Advantage of Meta Descriptions

Meta descriptions are the little blurb in a search result below the page title. OSU Drupal will pull the first sentences of your page as your meta description. However, sometimes, this isn’t the best source for an overall summary.

A solid meta description should draw someone to your site, but also provide an accurate description of the content. Meta descriptions in a search result display around 300 characters, so you have a small window to accomplish both of these things.

In OSU Drupal, you can add a meta description to any page. When editing the page, scroll to the bottom of the page and click on the Meta tags tab. Fill out the Description field with whatever you’d like to include. (Erase the “[node:summary]”) Click on Save to update your page with your newly minted meta description.

Write Accurate, Short, and Unique Page Titles

This one sounds basic, but it’s a common challenge. A title needs to describe succinctly what the webpage is all about. If you were plopped here without any other context from the rest of your site, would you know what this page is about? That’s how your visitor is often getting there–they didn’t carefully follow the navigation of your site, but rather they Googled what they needed and this is where they landed.

In OSU Drupal, the page title field feeds what is called the title meta tag. This tag is part of the metadata code for your page. Metadata code provides some basic information about your site to search engines. Whatever’s in the title meta tag will be displayed in the Google search result and on the browser tab when you’re on the page. There isn’t an exact word count or character limit for what will show up in a search result since it’s based on 600 pixel width. A good guideline is to keep it at 50-60 characters. So, if your page title is well written, there’s no further configuration you need to do.

Each page title should be unique, as in you shouldn’t have 2 pages with the same title. Generally speaking, it isn’t a good strategy to have duplicate content on your site anyway.


Follow these few steps and you’re well on your way to improving the visibility of your webpage. There’s a lot more to SEO, so if you want to learn more, check out Moz.com.

Categories
Microsoft Powerpoint Tips and Tutorials

Printing 4-up in Powerpoint


Today I’m going to show you how to print a Powerpoint template 4-up on an 8.5×11 page. I have a sample postcard that is a quarter size (5.5″x4.25″) front and back for mailing.

  • Once your design is complete, go to File>Print
  • Choose “Full Page Slides” under Print Layout, making sure “Scale to Fit Paper” and “High Quality” are checked.
  • Next, you’re going to trick the program. We want to print 4 fronts on one side, and 4 backs on the other. So in the “Slides” box, type: 1,1,1,1,2,2,2,2. This will print 4 of page 1, and 4 of page 2.
  • Select Printer Properties. Your print dialog box might look different from what is shown, but hopefully it will have a lot of the same options.
  • Under “Layout”, select “4 Pages per Sheet”. Leave the Page order as is, since it will be 4 of the same page.
  • Then under “2 sided” select “Short Edge Bind (Open Top/Left)” since this is in the Landscape view. If “Landscape” isn’t selected, choose it now.
  • Double-check that it is set to 4 Pages per Sheet, 2 Sided and say “Ok”. The view will still show a single page, but it will print 4-up on yours.
  • If you need to print multiple pages, change the number next to “Copies” at the top (ex. if you need 100 postcards, type 25 copies)


NOTE: There will be a white margin around the edge. This is common since printers aren’t able to print all the way to the edge, so you can choose to trim off that extra white, or allow for the extra buffer.


Showing the front and back


Thank you, and good luck.

Categories
Brand Guidelines

Beaver Orange – A User Guide

One of our greatest assets at Oregon State is our primary color. Beaver Orange is vibrant, distinct and provides a solid base for the larger color palette. Through the years we have worked to present a consistent color no matter the channel or medium you are working with. In conjunction with the Oregon State logo, this is the best way to present a unified visual identity to the marketplace.

To do this we provide different color builds for various uses.

  • Pantone 1665 for print jobs here on campus, through Printing and Mailing Services.
  • CMYK for off-set print jobs done through an outside vendor (bid through Printing and Mailing Services).
  • RGB for digital signage, presentations and as a fall back for less advanced design software (word, powerpoint, etc…)
  • Hex is used only for websites, applications and mobile applications.

This guide applies to our entire color palette. If you ever have a question don’t be afraid to toss it out to the OSU Communicators slack community or email University Marketing directly.

You can find our color palette in the OSU Brand Guide.

Update to RGB and Hex

Since the launch of our updated color palette, in April of 2017, we have lived with a very narrow scope for how we are able to use Beaver Orange on websites. Because we strive (and are required) to meet WCAG AA guidelines for accessibility we were unable to use orange and white together for text/background colors.

This greatly limited our creative and design staff across the university. To address this we made a very slight tweak to the Hex of Beaver Orange. Visually the change is nearly imperceptible but provides enough contrast to use orange, white and black combinations. For centrally administered web properties (through Web and Mobile Services) the colors have been updated automatically. We have been working with our decentralized partners to make sure they have anything needed to adjust to this change. If you need assistance or have questions please connect with Kegan Sims on Slack or by contacting University Marketing via email.

As a result of the update to the Hex, it made sense to update RGB as well. RGB is primarily used for material displayed digitally (signboards, email, presentations, etc..) but also in print if you are using basic programs such as Microsoft Word or Powerpoint for design. On rare occasions, graphics made using RGB colors end up on websites. In order to maintain as much consistency as possible, both the Hex and RGB were tweaked together. These changes are subtle and we don’t expect you to rush out and update your materials. As you update content or create new versions of your digital collateral that is a good time to make a change.

Categories
Adobe Illustrator Tips and Tutorials

OSU Branded Graphs as Brushes

OSU Graph Brushes for Adobe illustrator: Download


Oregon State’s graphs have a specific style that can take a while to create in Adobe Illustrator, even for seasoned designers. To simplify the graph making process, we’ve made downloadable brushes that let you create these graphs in just a couple clicks.

First, you’ll want to save the brush file somewhere that you can remember.

Within Adobe illustrator, create your graph and enter your data. Close out of the data panel and with your graph selected, choose “no fill” from the swatches panel. Change to the direct selection tool, select the center point in the middle of your graph, and delete it. You’ll notice it retains the points where the different values were, but has turned into a circle with no pies.

Open your Brushes window, and from the options drop down, select Open Brush Library > Other library…
Navigate to the brushes file, and you’ll see we have 9 brushes to choose from. They have names like Inner Line, Inner Bar, Outer line, which relate to how the graph is put together. You can select the different brushes and see what they do to the graph.

In the examples on our website you can see there are some with inner stripes, and a yellow outline, inner bars with an outline and so on. So let’s make this graph that has these notches.

Back in the Illustrator file, make sure the stroke is highlighted, and select Inner stripes 2. Open the appearance window, and go into the contents of the graph. From the options panel, select Add New Stroke. Then select Outer Line 2. From the appearance window, you can select the color of the outer line, and individually change the color of each of the pies.

This same style can work for bar graphs as well. Create your bar graph, enter your values, and delete the right-most points of each bar, so you’re left with lines. Select those lines, and select one of the “Inner” brushes.

It’s important to note that while these are still technically graphs with the data attached to them, if a number changes the graph resets. You’ll have to reselect the brushes and colors from the appearance panel.

Thank you, and good luck.

Categories
Microsoft Word Misc Tips and Tutorials

Read-Aloud Proofreading Method


Proofreading is an ongoing challenge for most writers, especially when reviewing our own work. Because we know what we mean to say, our brains often autocorrect for typos. And a spellcheck won’t catch some of the most common typos: a missing word, a wrong word that’s spelled correctly or the right word that’s in the wrong place.

Categories
Misc Tips and Tutorials

Printable Branding Cheat Sheets

Our brand is very robust, and we understand that it’s a lot to take in. For some, simply having a print-out to refer to is helpful, and as a result we’ve made two printable PDFs for quick reference. The first is a Branding Cheat sheet, showing quick references on logo use, color information and details on Oregon State University’s fonts. This by no means has the comprehensive information that would be found on the Oregon State Brand Site, but should help with common questions:

The second is a ‘how-to’ for navigating our templates and brand downloads, as well as using Microsoft Office to design:

Thank you, and good luck