So long, farewell, auf Wiedersehen, adieu

Well the time has come, the end of my summer internship. It’s been a long summer but I’ve had the chance to learn so much, and I’m so grateful for all the great people I’ve gotten the chance to meet this summer.

Even in my last week I got to experience some new things, during my time here I’ve learned that there’s always more to learn. Monday was nothing too exciting, we processed the Belle Fiore leaves from last week for NSC and then I worked on my report some. On Tuesday we pretty much just stayed in the lab, I set up all the stuff we would need for the rest of the week and in the afternoon Cody and I ran enzymatics on some of the Belle Fiore samples. 

Cedars

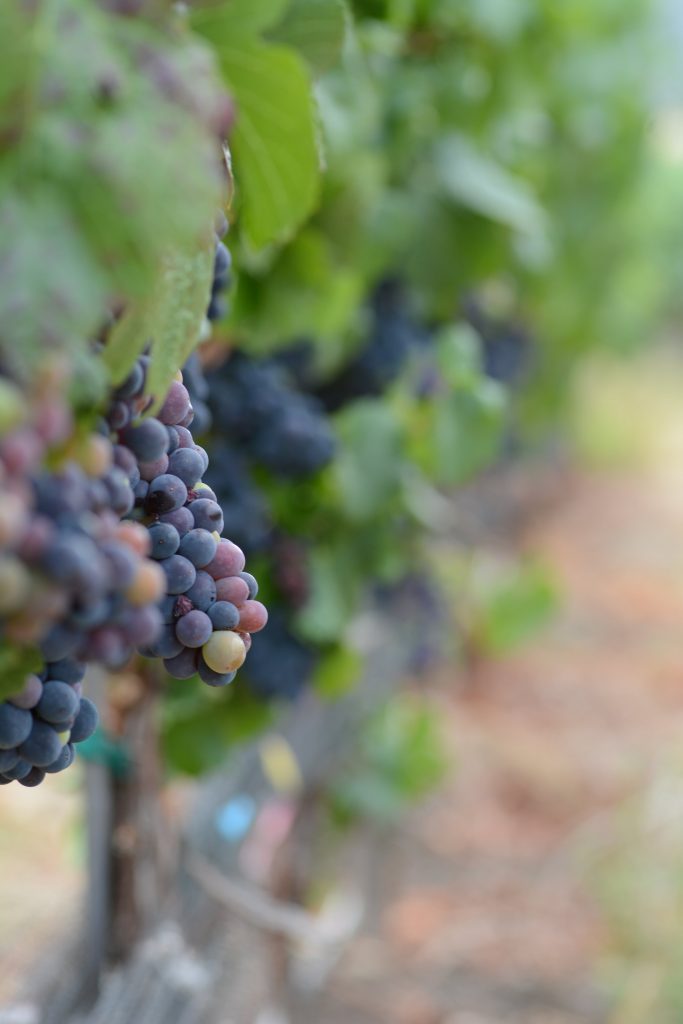
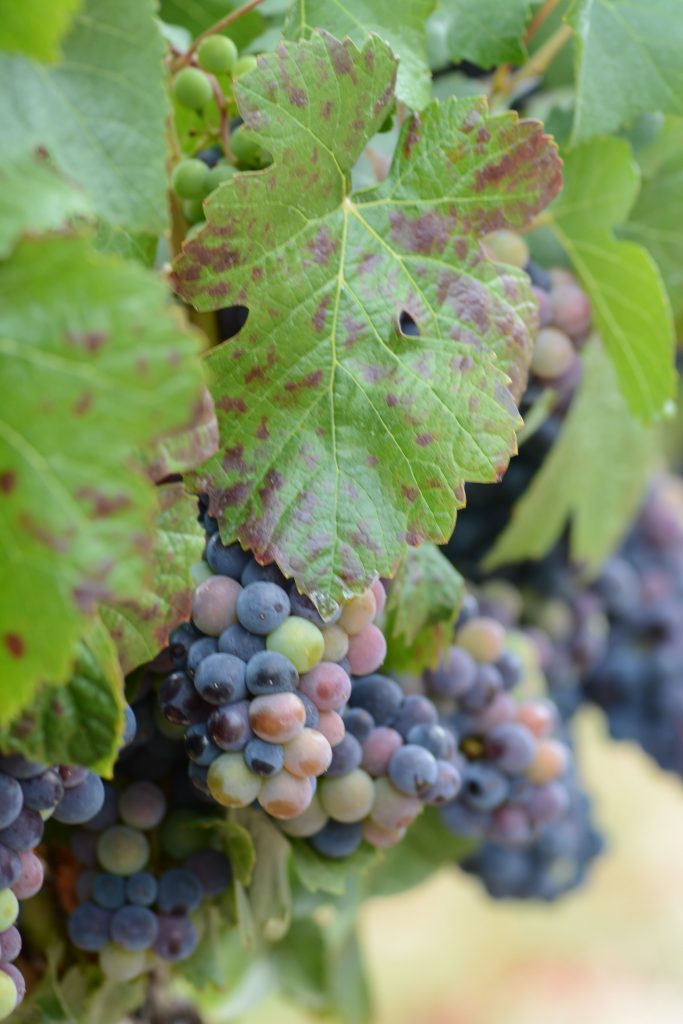
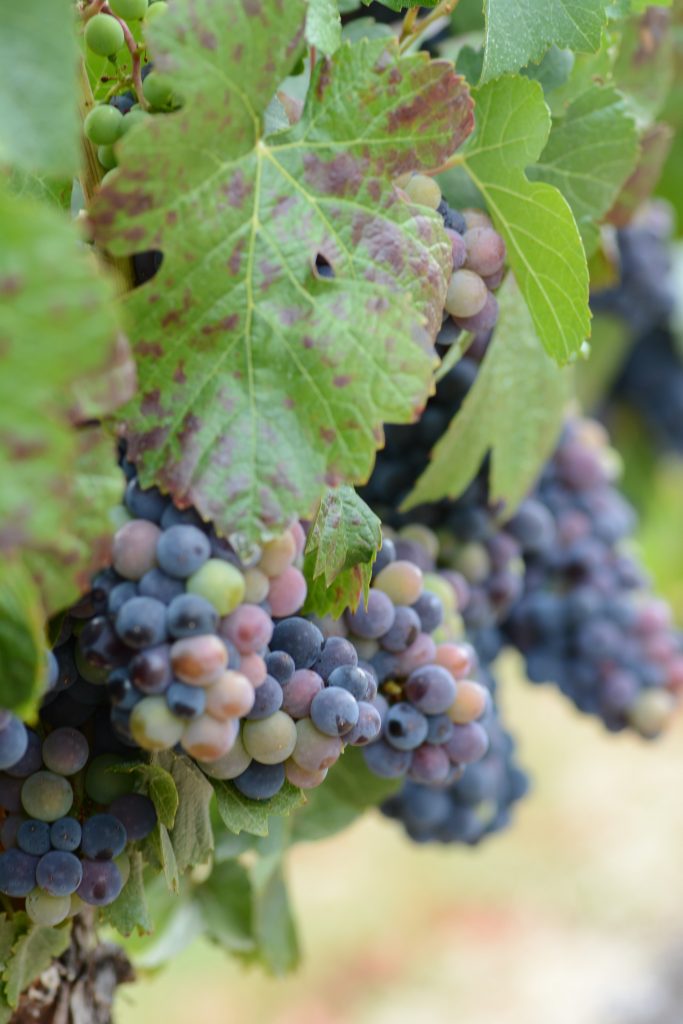
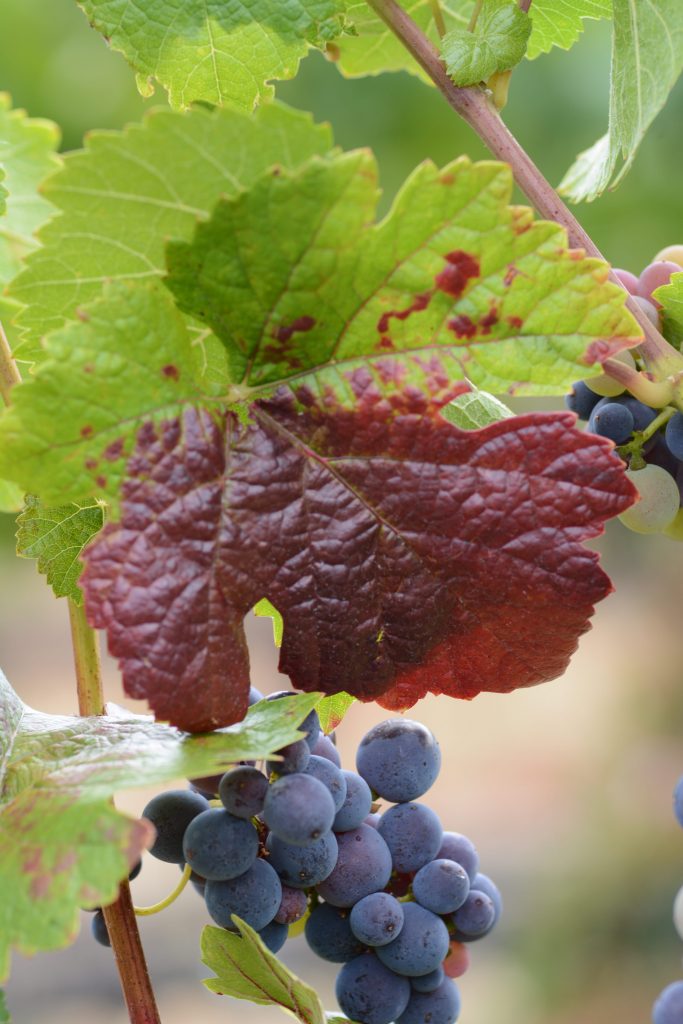
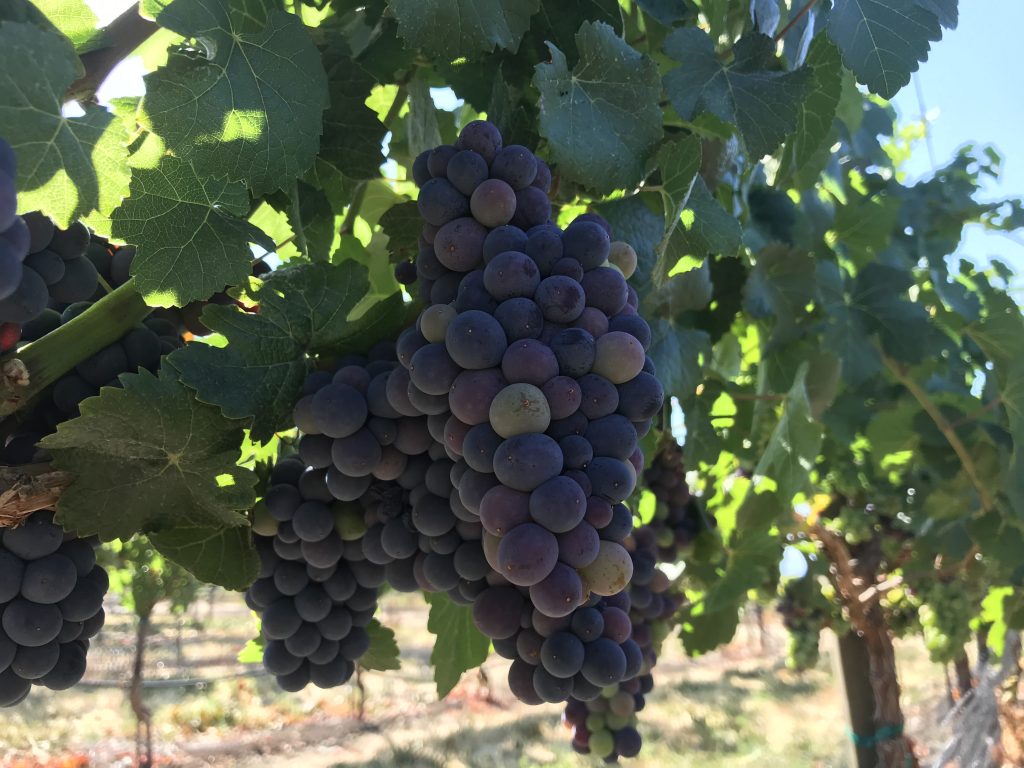
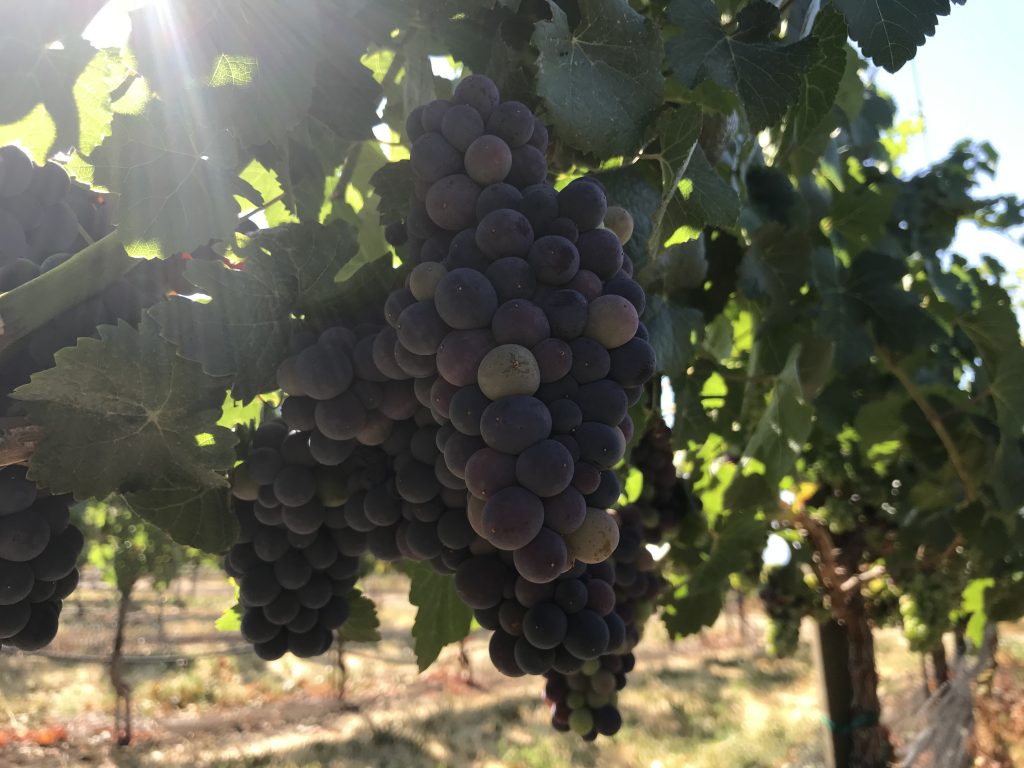
Wednesday morning was when the fun really began. We all had to meet up at the station an hour earlier than normal so that we could head over to Cedars, one of our vineyards sites that I had not yet visited. The reason we went over so early in the morning was because at that vineyard site, it’s harvest time! At least for Pinot, which is what our research block consisted of. While we were out there, they had their mechanical harvester going. Essentially the mechanical harvester goes over the vines and hits the row of vines, sending vibrations through it that knock off the grapes. It was pretty cool to watch. 

Machine harvester dumping berries into bin.

After watching the harvester we got to work and sampled our research block. We subsampled six clusters, two from each central vine, so that we could conduct a cluster analysis, and take measurements of how much the rachis (Stem of the cluster) weighs, and along with some other measurements we can sort of calculate/estimate how much weight is lost due to mechanical harvesting. After that we counted and removed all the clusters from three central vines in each experimental block. We then weighed them and collected them to be sent up to OSU for further analysis. 

Clusters collected from cedars for analysis.

On Thursday we went out to Redlands and set up the bins, and flagging for harvest as well as cleaned up the vines so when it comes to harvest time it will be a lot easier for us. We also took some berry samples and on Friday morning we ran a juice panel on the samples.

Friday afternoon we had a huge goodbye barbecue for myself and some of the other interns. It was a huge potluck and everyone had an amazing time. It was a great way to say goodbye to all the wonderful people I got to work with over the summer. I want to say thank you to Alexander Levin for letting me work in his lab for the summer and also a thank you to Cody, Joey, Ricky and Reese for making this summer a great internship experience. Also a thank you to the OSU College of Agriculture and the OSU Southern Oregon Research and Extension Center for providing me with this amazing opportunity.

A wild time

This week has been wild, with harvest coming up there’s been a lot to do. On top of that a lot of crazy things have happened this week. On Tuesday Joey, Ricky and I went out to Redlands like normal, we took SWP measurements as well as shade board and paso panel measurements. When we first got that we began tagging the vines that we will be harvesting from, since we don’t want to have to harvest every single one. As we were going down the first row, we got near the end and I noticed some movement out of the corner of my eye, lo and behold there’s a little skunk! It didn’t look like a full grown one but we weren’t taking any chances, we did all the shade measurements and sort of just worked around it. Then when it came to doing the SWP there wasn’t really a way around because we have to push the cart down the row so Ricky went ahead and started throwing some dirt clumps near the little guy and eventually got it to move a couple rows over so we could get back to work. At the time it was a little scary because I really wasn’t looking forward to getting sprayed but once we got the situation all handled its pretty funny looking back on it now.

On Wednesday we (Cody and I) went out to Belle Fiore to collect some berry samples and take some LICOR measurements.

LICOR Machine

While I was walking around collecting the berry samples I noticed this little bee with its head completely in one of the grapes!

On our way heading out from Belle Fiore we also noticed a family of Turkeys roaming through the vineyard, there looked to be about 8 or 9 of them just eating some of the berries off the ground.

On Thursday we went out to Grestoni to collect some berry samples from there, but on our way into the vineyard site, we saw what looked to be a falcon (I’m not entirely sure?) hopping through the vineyard carrying a squirrel about the same size as itself. I think it was too big for it to fly away with it. On Friday we went back to Grestoni and took some shade measurements and some SWP measurements. Overall it was a pretty crazy week, although with all the wildlife we saw I think it may have been one of the most interesting weeks yet.

install.packages(weekly blog)

As mentioned in last weeks blog, I’ve been working on some R analysis for the data we received from OSU. Essentially we’re using the nutritional data we receive to look at the differences between our treatments. We have two trials going on at Belle Fiore, a thinning and irrigation trial and a fertilizer and irrigation trial, I am focusing on the fertilizer trial for my report and poster.

For the fertilizer trial we have four replicates of the four treatment combinations, control irrigation and fertilizer (CC), control irrigation and supplemental fertilizer (CS), supplemental irrigation and control fertilizer (SC), and lastly supplemental irrigation and fertilizer (SS). We use codes as sort of a short annotation, C for control, S for supplemental, and when looking at the code irrigation always comes first. We also use a block design so that if there is variance within the vineyard, for example the west side is dryer than the east, then the blocks or our replicates will keep that from affecting the data. I’ve included a map of the fertilizer treatment below. Rows 1-4 create block 1, rows 5-8 are block 2, rows 9-12 are block 3, and rows 13-16 are block 4.

Belle Fiore Fertilizer Experiment Plot Map

For the purposes of R analysis we combine the results from each replicate and using R we calculate the least squares means (LS means). We use least squares mean because it minimizes the sum of the squared residuals, meaning it reduces the difference calculated between the observed value and the value produced by the model. This is what helps eliminate any difference between the blocks. We then use those values calculated for each treatment and compare the treatments to see if there is a significant difference between the treatments. The resulting table looks like this:

Table of least squares means

You’ll notice a letter after each value, the letters just tell us if there is a significant difference between the values. Those that are followed by the same number are not significantly different (P < 0.5). For example in the Manganese (Mn) data for blades CC, CS, and SS are all followed by the letter a so they are not significantly different but, SC is followed by just the letter b which means it is significantly different compared to CC and CS, but not SS because its also followed by the letter b. It’s a little confusing but once you get it, it all makes sense.

We also use R to perform an Analysis of Variance or ANOVA for short. We use a two way ANOVA to study the relationship between our treatment parameters, to see if there is a significant difference between just irrigation and fertilizer and the interaction between the two. The resulting analysis gives us a table of p-values as follows:

Table of p-values. *= 0.05 **= 0.01 ***= 0.001

In this table I’ve highlighted all the p-values that are significantly different. The interesting thing about comparing the p-values to the LS means is that while according to the p-values a certain treatment may be considered significantly different when looking at the LS means there is no significant difference, for example if you look at Copper (Cu). This is due to the fact that LS means uses a confidence interval to determine significant difference, and sometimes the interval is too large for it to be determined a significant difference. This is why we look at both LS means and p-values, they’re both important and tell us different things about our data.

That was pretty much how I spent my Monday, looking at R outputs and trying to determine what they mean. The rest of the week was pretty normal. On Tuesday I performed a DNA extraction and worked on my report. On Wednesday morning we went out to Belle Fiore and berry sampled, during which we got rained on for like 30 seconds. In the afternoon I got to do an entire juice panel by myself which was pretty cool and honestly didn’t take as long as I thought it would. Then on Thursday we went out to Grestoni and berry sampled, and in the afternoon we took Spad measurements, LICOR photosynthesis analysis, SWP and took the leaves back with us to perform Chlorophyll analysis later.

Photo of Belle Fiore when it decided to rain on us.

Hopefully sometime next week I’ll get the second set of data back from OSU so that I can run those numbers through R and compare them to our first set of data. Also if you didn’t get the reference in the title it’s supposed to be a pun/reference to R studio script. Until next time, I hope everyone has a great Labor Day weekend!

Let’s get down to business

This week was sort of bittersweet, as we had to say goodbye to Reese, although we sent him off with a great BBQ on Thursday. Everyone brought something so it was more of a little potluck, we had steak brought in by Ricky and cooked on the BBQ by everyone? It took a team effort to get the BBQ up and running, we ran into some difficulties with the propane. We also had pico de gallo and chips, made by me, elote made by Alex, salad made by Cody, and blackberry zucchini bread brought in by Joey. Overall it was a great time and a wonderful way to send off a member of the team.

Other than that, the week pretty much went as it normally does. On Monday we went to Grestoni to sample some more vines for PCR. We’ve been berry sampling so much that we need more Red Blotch positive and negatives vines identified so that we know what were sampling. On Tuesday Cody and I performed DNA extractions on the new samples in the morning and then ran the PCR in the afternoon, which pretty much took up the whole day.

On Wednesday we went out to Belle Fiore to take another Berry Sample but we also had a little photoshoot, mostly I just walked around, took some pictures of the landscape, Cody wanted some pictures of Red Blotch incidence so we got some of those, overall it was pretty fun and here are some of my favorites. (I’ll probably make another post of all of my favorites!)

When we got back from Belle Fiore we ran the full juice panel. On Thursday morning we went back out to Grestoni to do the actual berry sampling on the new vines and in the afternoon we ran the full juice panel on those berries. On Friday and sort of throughout the rest of the week I worked on the Belle Fiore nutritional analysis results we received from OSU, specifically on our fertilizer experiment, which is what I am writing my report on and what my poster will be about. Right now we only have the data for our first sampling time point, but when I have the rest of the results I’ll probably post them in another blog. Essentially with the results we receive I’ve been inputting the data into R Studio and then analyzed using two-way analysis of variance or ANOVA, to see if there’s a significant difference between the treatments. 

Along with that I’ve begun to write a short report about the fertilizer experiment at Belle Fiore, when it’s finished I will either link it or put it in another blog. The report writing process is about as much reading as it is writing, probably more actually, but it’s also very insightful because while I’m writing to inform others I’m also learning a lot while doing so.

Well that’s it for this week, until next time!

Same Old Same Old

This week sort of followed the usual routine that we’ve gotten into. Monday was spent out at Redlands where we took SWP’s, Paso Panel and Shadeboard measurements as well as Berry Sampling. After this week though we won’t be doing nearly as much out at Redlands. On Tuesday we ran the full juice panel (Weight, subsample for Phenolics, Brix, pH, and TA) for Redlands, we also went out to Grestoni to take some SWP’s for samples that are positive and negative for Red Blotch. 

On Wednesday we went out to Belle Fiore and took some berry samples and SWP’s. We also ran the full juice panel on those berries as well as took a sample of juice to run enzymatics on later.

Grapes at Belle Fiore

On Thursday we went back out to Grestoni to collect some berry and cluster samples for… you guessed it! A juice panel!

Lastly on Friday me and Cody went out and took more leaf samples at the Lombard block to get a veraison time point for the nutritional analysis so that we can compare the results I took earlier in the summer. We sent those off and I should hopefully have the results back in a couple weeks! Overall nothing out of the ordinary happened this week, although I am looking forward to next week because we’re going out to Belle Fiore as usual, but this time we’re going to be having a little photoshoot so that we can have photos to use for whatever. I’ll try to include some that we take, until next time!

Another example of grapes at Belle Fiore

On That Grind

It has certainly been a busy week, let me tell you. As usual we started off Monday heading out to the Redlands site, but this time along with SWP we got to do some berry sampling! For berry sampling depending on the site we usually pick 50-60 berries for a representative of that specific treatment. We then use those berries for a multitude of various results that all provide us with different information. The first thing we do with each bag of berries is collect the weight. The second step is from each set of berries we sub-sample 20 to be used for phenolics later. After that we crush the remaining berries with our hands to get all of the juice out, which we then pour into a 15 mL centrifuge tube. We then put all of those centrifuge tubes into a centrifuge to spin down any solid particulates in the juice. After that we pour the juice into a 50 mL centrifuge tube, and discard the old tubes with the solid matter. After that we begin collecting results.

With this juice we test for many different things. One thing we look at is pH, which is done using  pH probe. We also test for brix using a refractometer. Brix are used as an indicator for veraison and when to harvest. With the juice we also take 1 mL of each sample and set it aside for enzymatic analysis. Lastly using a ratio of 5 mL of the juice to 20 mL of DI water we run all the samples through an acid titration.  It’s a long process and it takes up almost the whole day but it’s actually kind of fun.

Grapes at Belle Fiore

On Tuesday we went out to Grestoni to collect some leaf samples but this time we did things a little differently. We started off by picking a leaf from a preselected fine, somewhere around mid-canopy. We then used a SPAD meter, which gives us a relative SPAD value which is proportional to the amount of chlorophyll in the leaf. We then used the same leaf to take a photosynthesis reading using a Licor Photosynthesis and Gas Exchange Analyzer. After that we bag the leaf for SWP. After SWP we take the leaf back to the lab where we cut out 1 square centimeter for chlorophyll extraction, we weigh the rest and put it in the incubator for NSC. 

On Wednesday we went to Belle Fiore to collect some berry samples, as well as leaf samples for NSC (Non-Structural Carbohydrates, which I talked about in an earlier blog) and leaf samples for nutritional analysis which we sent off to OSU.

Bags for Berry and Leaf Sampling at Belle Fiore

On Thursday we went back to Grestoni to collect Berry and cluster samples. Cluster samples meaning we take the entire cluster off the vine for analysis. Lastly on Friday we spent the whole day in the lab, partly because it was raining and thundering outside and partly because we needed to run some of the samples through NSC. So as you can now tell it was a very busy week indeed.

Halfway Done?

Somehow this summer has gone by amazingly fast. I’ve reached the halfway point in my internship, which also means I’m halfway done with these blogs! It’s crazy how fast its all gone but you know what people say “Time flies when you’re having fun”.

These past couple of days have honestly been a little crazy and I’ve got to learn so much more in such a short time. Just this last week the Research and Extension Center, in collaboration with the Rogue Valley Winegrowers Association, hosted its annual Southern Oregon Wine Grape Field Day. We got to go to various vineyards throughout Southern Oregon and learn about how they run their vineyards and why they do what they do. Our first stop was Troon Vineyard, which is an organic and biodynamic farm/vineyard. Biodynamic farming is sort of a relatively new concept, in which the farm or vineyard is viewed as a single entity. The requirements for biodynamic farming are actually quite interesting. Some requirements include, using natural materials, soils, and compost to sustain the vineyard, having other plants and animals onsite such as ducks, horses, or sheep live on the soil and fertilize it. Other requirements include the forbidden use of chemical fertilizers and pesticides. The purpose of biodynamic farming is to create a more natural, self-sustaining farm that can continue on for many generations. The second vineyard we visited was Hummingbird estate which is a relatively new vineyard, so we discussed new plantings, as well as cultivar and rootstock selection.

View at Hummingbird Estate

Our last stop of the day was here at the Research and Extension center where we visited all of our research vineyards here on site. After lunch, we had an amazing talk from Glenn McGourty about “Evaluation of Vineyards, Fruit and Wine Affected by Wild Fire Smoke”. 

The rest of the week consisted of PCR and DNA extractions, but most importantly Nutritional Analysis results! After sampling and sending off results a couple weeks ago I have received ⅔ of the lab results, so a big portion of my week was figuring out a way to present the data. After a lot of research and R Studio stuff I came up with these plots as a first draft at presenting the data.

I’m still working on them and trying to figure out if there might be a better way to present the data while also waiting on the results from OSU. I will also be sampling again here in a couple weeks and sending off those samples. Overall things have been picking up and with berry and cluster sampling coming up, there’s gonna be a lot more things to do… hopefully.

DNA and Vines Galore

This week was a little all over the spectrum of what I got to do. On Monday we did the normal Redlands visit, Stem Water Potential, Shadeboard and Paso Panel measurements (I lied last week when I said we didn’t have to do that anymore, we just have to do them once a week!). Tuesday was a little more exciting, we put drip line into the new demo block here at the research center, which we then got to plant later in the week. The demo block is to be used, as well a demo for farmers and home growers in the area, to kind of showcase different varieties of grapes, different trellis styles, and eventually show the growth variances of 4 year old vines compared to 3, 2, and 1 year old vines. For right now the demo vineyard consists of multiple varieties of wine grapes, table grapes and raisin grapes. 

On Wednesday we also had to finish putting up the drip line in the new “to be named” research block also here at the extension center. This new research block is going to be planted Monday and will consist of 2 grape varieties (Pinot Noir and Cabernet Sauvignon) grafted onto 10 different rootstocks, with 20 vines per treatment with 5 reps, plus the addition of border rows for a total of roughly 2,400 vines. On Friday to prepare for the planting, I had the pleasure of organizing all of the vines into buckets so that we can set the bucket at the beginning of the row and just plant, and not have to worry about messing up the order of the vine/treatment placement. 

Vines being sorted into buckets, to be planted in new research block on Monday.

Throughout the week I got to work on some DNA extractions which was pretty cool, and there’s still a lot more to do. I also got to shadow Joey and watch him do some PCR, which happens after DNA extraction. Overall, this week definitely had a lot of variety to the tasks and projects we are working on which was kind of nice.

A rollercoaster whirlwind of a week

I think a major thing I’ve learned in the past couple of weeks is that working in a lab can sometimes feel like a rollercoaster. There’s really slows day where nothing but reading articles happens and then there’s days where its just go-go-go and it’s non-stop work. I prefer the busy days more because then I have something to do and it’s also a lot more exciting. Monday started off pretty normal. Went to Redlands with Joey, Ricky and Reese, took some Stem Water Potentials, Paso Panel and Shadeboard measurements which I’ve talked about before.

Mortar and Pestle used for grinding samples.

On Tuesday I got to learn something new by helping out Cody with some Non-structural carbohydrate (NSC) quantification. Which is quite a long process but essentially after grinding up the samples (I got to use a mortar and pestle, which sort of made me feel like an ancient medicine man), and mixing them with supernatant and diluting it, incubating it, etc. In the end we use the absorbance of the leaf samples to quantify how much starch and sugars are in a sample. We’re hoping to use this information to just get another perspective into what the different treatments in our experiment are doing and what their effect on the plant is.

On Wednesday and Thursday I got to do my own little side project on the Lombard Vineyard Block here on site. Essentially we are doing a little test with the different analytical labs in the area that do Plant Nutrient Analysis Testing. Looking at the cost of the test, what kind of results they give us, how long it takes to get the results, and a few other things. On Wednesday I was mostly just squaring everything away for the project, calling the labs to double check prices and asking how much sample matter they need, etc. On Thursday I got to go out and sample the Lombard block all by myself. There are two different varieties of grapes (Pinot Noir and Chardonnay) in the lombard block so I sampled both of them, I ended up collecting 216 leaf blades and petioles of each variety and then split those between the three labs we were sending them to (OSU Central Analytical Laboratory, A & L Labs, and Dellavalle Labs) so that each lab received four samples consisting of, Pinot Noir petioles, Pinot Noir leaves, Chardonnay petioles, and Chardonnay leaves. Before sending them off I had to separate the leaf blades and petioles which took a while. Then in the afternoon, with the help of Joey, I sent all the samples off to the various labs! Which actually took a lot longer than you might think, honestly the mailing process wasn’t that difficult it just took forever.

On Friday I went back out to Redlands with Joey and Ricky to take some more Stem Water Potentials and at least for a little while our last Shadeboard and Paso Panel measurements. I must say, I don’t know if it was the fact that it was Friday and the week was almost over, or because we had one less person than normal but going out to Redlands on Friday was HOT. Overall the most difficult, but also my favorite part of the week was getting to conduct my own little experiment. I probably won’t get the results for awhile so we’ll have to wait and see what comes out of it but I’ll make sure to update in future logs!