With the changing of the season, gray whales are starting their southbound migration that will end in the lagoons off the Baja California Mexico. The migration of the gray whale is the longest migration of any mammal—the round trip totals ~10,000 miles (Pike, 1962)!
Like these gray whales, I am also undertaking my own “migration” as I leave Newport to start my post-Master’s journey. However, my migration will be a little shorter than the gray whale’s journey—only ~3,000 miles—as I head back to the east coast. As I talked about in my previous blog, I have finished my thesis studying the energetics of gray whale foraging behaviors and I attended my commencement ceremony at the University of British Columbia last Wednesday. As my time with the GEMM Lab comes to a close, I want to take some time to reflect on my time in Newport.
Me in my graduation regalia (right) and my co-supervisor Andrew Trites holding the university mace (left) after my commencement ceremony at the University of British Columbia rose garden.
Many depictions of scientists show them working in isolation but in my time with the GEMM Lab I got to fully experience the collaborative nature of science. My thesis was a part of the GEMM Lab’s Gray whale Response to Ambient Noise Informed by Technology and Ecology (GRANITE) project and I worked closely with the GRANITE team to help achieve the project’s research goals. The GRANITE team has annual meetings where team members give updates on their contributions to the project and flush out ideas in a series of very busy days. I found these collaborative meetings very helpful to ensure that I was keeping the big picture of the gray whale study system in mind while working with the energetics data I explored for my thesis. The collaborative nature of the GRANITE project provided the opportunity to learn from people that have a different skill set from my own and expose me to many different types of analysis.
GRANITE team members hard at work thinking about gray whales and their physiological response to noise.
This summer I also was able to participate in outreach with the partnership of the Oregon State University Marine Mammal Institute and the Eugene Exploding Whales (the alternate identity of the Eugene Emeralds) minor league baseball team to promote the Oregon Gray Whale License plates. It was exciting to talk to baseball fans about marine mammals and be able to demonstrate that the Gray Whale License plate sales are truly making a difference for the gray whales off the Oregon coast. In fact, the minimally invasive suction cup tags used in to collect the data I analyzed in my thesis were funded by the OSU Gray Whale License plate fund!
Photo of the GEMM Lab promoting Oregon Gray Whale License plates at the Eugene Exploding Whales baseball game. If you haven’t already, be sure to “Put a whale on your tail!” to help support marine mammal research off the Oregon Coast.
Outside of the amazing science opportunities, I have thoroughly enjoyed the privilege of exploring Newport and the Oregon coast. I was lucky enough to find lots of agates and enjoyed consistently spotting gray whale blows on my many beach walks. I experienced so many breathtaking views from hikes (God’s thumb was my personal favorite). I got to attend an Oregon State Beavers football game where we crushed Stanford! And most of all, I am so thankful for all the friends I’ve made in my time here. These warm memories, and the knowledge that I can always come back, will help make it a little easier to start my migration away from Newport.
Me and my friends outside of Reser Stadium for the Oregon State Beavers football game vs Stanford this season. Go Beavs!!!
Me and my friends celebrating after my defense.
Did you enjoy this blog? Want to learn more about marine life, research, and conservation? Subscribe to our blog and get a weekly message when we post a new blog. Just add your name and email into the subscribe box below
References
Pike, G. C. (1962). Migration and feeding of the gray whale (Eschrichtius gibbosus). Journal of the Fisheries Research Board of Canada, 19(5), 815–838. https://doi.org/10.1139/f62-051
Dr. KC Bierlich, Postdoctoral Scholar, OSU Department of Fisheries, Wildlife, & Conservation Sciences, Geospatial Ecology of Marine Megafauna (GEMM) Lab
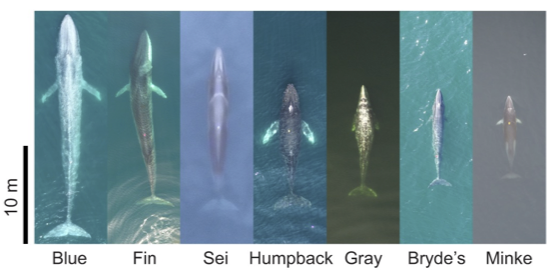
Baleen whales are known for their gigantism and encompass a wide range in body sizes extending from blue whales that are the largest animals to live on earth (max length ~30 m) to minke whales (max length ~10 m) that are the smallest of baleen whales (Fig. 1). While all baleen whales are filter feeders, a group called the rorquals use a feeding strategy known as lunge feeding (or intermittent engulfment filtration), which involves engulfing large volumes of prey-laden water at high speeds and then filtering the water out of their mouth using their baleen as a “sieve”. There is positive allometry associated with this feeding technique and body size, meaning that as whales are larger, this feeding strategy becomes more efficient due to increased engulfment of water volume per each lunge feeding event. In other words, a bigger body size equates to a much larger mouthful of food. For example, a minke whale (body length ~7-10 m) will engulf water volume equivalent to ~42% of its body mass, while a blue whale (~21-24 m) engulfs ~135%. Thus, filter feeding enables gigantism through efficient exploitation of large, dense patches of prey. An interesting question then arises: what is the minimum body size at which filter feeding is still efficient? Or in other words, why are the smallest of the baleen whales, minke whales, not smaller? For this blog, I will highlight a study published today in Nature Ecology and Evolution titled “Minke whale feeding rate limitations suggest constraints on the minimum body size for engulfment filtration feeding” led by friend and collaborator of the GEMM Lab Dr. Dave Cade and included myself and other collaborators as co-authors from Stanford University, UC Santa Cruz, Cascadia Research Collective, Duke University, and University of Queensland.
Figure 1. Aerial imagery collected using drones of several baleen whales of various sizes. Each species shown is considered a rorqual whale, except for gray whales. Figure from Segre et al. (2022)
The largest animals of today are marine filter feeders, such as whale sharks, manta rays, and baleen whales, which all share parallel evolutionary histories in which their large body sizes and filter-feeding morphologies are derived from smaller-bodied ancestors that targeted single prey items. Changes in ocean productivity increased the concentrations of smaller prey in the oceans around 5 million years ago, enabling filter feeding as an efficient feeding strategy through capture of abundant aggregations of prey by filtering large volumes of water. It is interesting to note, that within these filter feeding lineages of animals, there are groups of animals that are single-prey foragers with smaller body sizes. For example, the whale shark is the only filter feeder amongst the carpet sharks and the manta ray is much larger than other rays that feed on single prey items. Amongst cetaceans, the smallest single-prey foragers, dolphins (~2-3 m) and porpoises (~1.4-1.9 m), are much smaller than the smallest of the filter feeding cetaceans, minke whales (~7-10 m). These common differences in body sizes and feeding strategies within lineages suggest that there may be minimum body size requirements for this filter feeding strategy to be efficient.
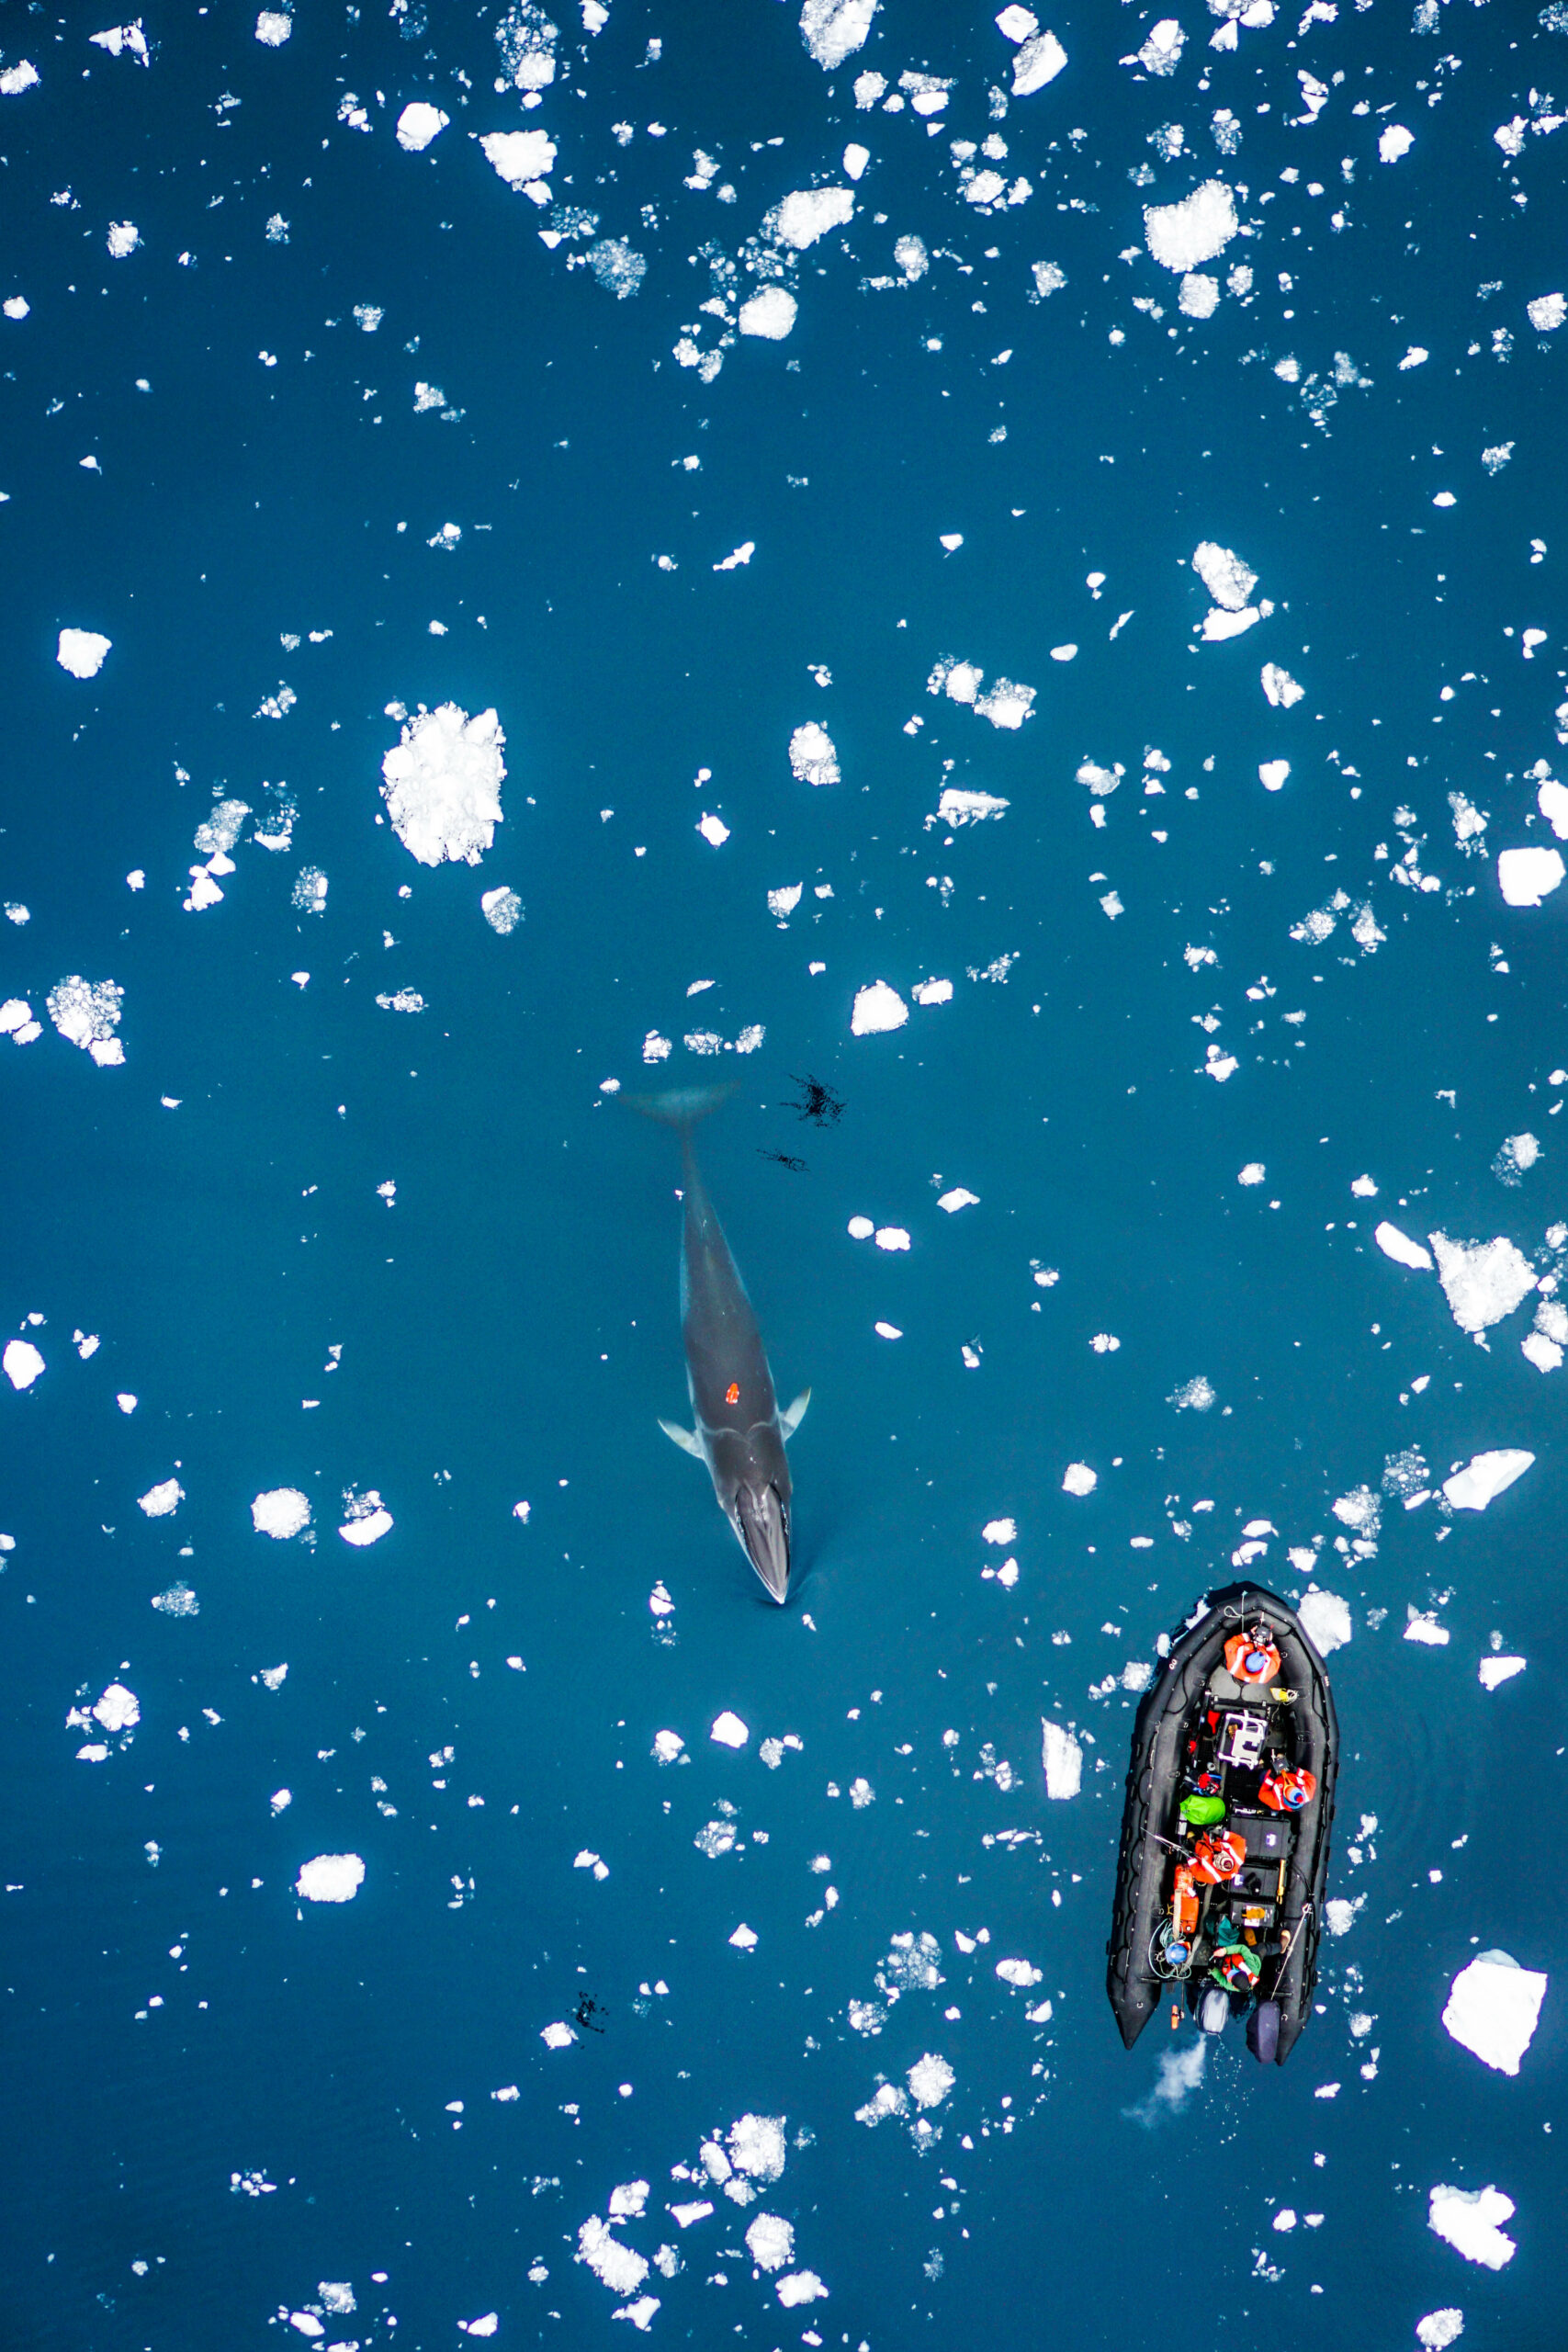
To investigate the limits on minimum body size for filter feeding, our study explored the foraging behavior of Antarctic minke whales, the smallest of the rorqual baleen whales, along the Western Antarctic Peninsula. Our team tagged a total of 23 individuals using non-invasive suction cup tags, like the ones we use for our tagging component in the GEMM Lab’s GRANITE project (see this blog for more details). One of my roles on the project was to obtain aerial imagery of the minke whales using drones to obtain body length measurements (sound familiar?) (Figs. 2-4). Flying drones in Antarctica over minke whales was an amazing experience. The minke whales were often found deep within the bays amongst ice floes and brash ice where they can be very tricky to spot, as they’ll often surface and then quickly disappear, hence their nickname “sneaky minkes”. They also appear “playful” and “athletic” as they are incredibly quick and maneuverable, doing barrel rolls and quick bank turns while they swim. Check out my past blog to read more on accounts of flying over these amazing whales.
Figure 2. Drone image of our team about to place a noninvasive suction cup biologging tag on an Antarctic minke whale. Photo credit: Duke University Marine Robotics and Remote Sensing Lab.Figure 3. A drone image of a newly tagged and curious Antarctic minke whale approaching our research team. Photo credit: Duke University Marine Robotics and Remote Sensing Lab.Figure 4. A drone image of a group of Antarctic minke whales swimming through the icy waters along the Antarctic Peninsula. Photo credit: Duke University Marine Robotics and Remote Sensing Lab.
In total, our team collected 437 hours of tag data consisting of day- and night-time foraging behaviors. While the proportion of time spent foraging and the number of lunges per dive (~3-4) was similar between day- and night-time foraging, daytime foraging was much deeper (~72 m) compared to nighttime foraging (~28 m) due to vertical migration of Antarctic krill, their main food source. Overall, nighttime foraging was much more intense than daytime foraging, with an average of 165 lunges per hour during the night compared to 53 lunges per hour during the day. These shallower nighttime dives enabled quicker surface sequences for replenishing oxygen reserves to then return to foraging, whereas the deeper dives during the day required longer surface recovery times before beginning another foraging dive. Thus, nighttime dives are a more efficient and critical component of minke whale foraging.
When it comes to body size, there was no relationship between dive depth and dive duration with body length, except for daytime deep dives, where longer minke whales dove for longer periods than smaller whales. These longer dive times also require longer surface times to replenish oxygen reserves. Longer minke whales can gulp larger amounts of food and thus need longer filtration times to process water from each engulfment. For example, a 9 m minke whale will take 50% longer to filter water through its baleen compared to a 5 m minke whale. In turn, smaller minke whales would need to feed more frequently than larger minke whales in order to maintain efficient foraging. This decreasing efficiency with smaller body size shines light on a broader trend for filter feeders that we refer to in our study as the minimum-size constraint (MSC) hypothesis: “while the maximum size of a filter-feeding body plan will be restricted by physical properties, the minimum size is restricted by the energetic efficiency of filter feeding and the time required to extract sufficient particles from the water” (Cade et al. 2023). When we examined the scaling of maximum feeding rates of minke whales, we found evidence of a minimum size constraint on efficiency at lengths around 5 m. Interestingly, the weaning length of minke whales is reported to be 4.5 – 5.5 m. Before weaning, newborn/yearling minke whales that are smaller than 4.5 – 5.5 m have a different foraging strategy where they are dependent on maternal milk. Thus, it is likely that the body size at weaning is influenced by the minimum size at which this specialized foraging technique of lunge feeding becomes efficient.
This study helps inform the evolutionary pathway for filter feeding whales and suggests that efficient filter feeding and gigantism likely co-evolved within the last 5 million years when ocean conditions changed to support larger prey patches suitable for lunge feeding. It is interesting to think about the MSC hypothesis for other baleen whale species that employ alternative filter feeding techniques, such as gray whales that generally use a form of filter feeding called suction feeding. Gray whales are estimated to have a birth length of ~4.6 m (Agbayani et al., 2020), and the body length of newly weaned calves that we have observed along the Oregon Coast from drone imagery seem to be ~8 – 9 m. Perhaps this is the minimum size of when suction feeding becomes efficient for a gray whale? This is something the GEMM Lab hopes to further explore as we continue to collect foraging data from suction cup tags and behavior and body size measurements from drone imagery.
References
Agbayani, S., Fortune, S. M., & Trites, A. W. (2020). Growth and development of North Pacific gray whales (Eschrichtius robustus). Journal of Mammalogy, 101(3), 742-754.
Cade, D.E., Kahane-Rapport, S.R., Gough, W.T., Bierlich, K.C., Linksy, J.M.J., Johnston, D.W., Goldbogen, J.A., Friedlaender, A.S. (2023). Ultra-high feeding rates of Antarctic minke whales imply a lower limit for body size in engulfment filtration feeders. Nature Ecology and Evolution. https://www.nature.com/articles/s41559-023-01993-2
Paolo S. Segre, William T. Gough, Edward A. Roualdes, David E. Cade, Max F. Czapanskiy, James Fahlbusch, Shirel R. Kahane-Rapport, William K. Oestreich, Lars Bejder, K. C. Bierlich, Julia A. Burrows, John Calambokidis, Ellen M. Chenoweth, Jacopo di Clemente, John W. Durban, Holly Fearnbach, Frank E. Fish, Ari S. Friedlaender, Peter Hegelund, David W. Johnston, Douglas P. Nowacek, Machiel G. Oudejans, Gwenith S. Penry, Jean Potvin, Malene Simon, Andrew Stanworth, Janice M. Straley, Andrew Szabo, Simone K. A. Videsen, Fleur Visser, Caroline R. Weir, David N. Wiley, Jeremy A. Goldbogen; Scaling of maneuvering performance in baleen whales: larger whales outperform expectations. J Exp Biol 1 March 2022; 225 (5): jeb243224. doi: https://doi.org/10.1242/jeb.243224
Hello! My name is Kate Colson and I am a master’s student at the University of British Columbia, co-supervised by Dr. Andrew Trites of the Marine Mammal Research Unit and Dr. Leigh Torres of the GEMM Lab. As part of my thesis work, I have had the opportunity to spend the summer field season with Leigh and the GEMM Lab team.
For my master’s I am studying the foraging energetics of Pacific Coast Feeding Group (PCFG) gray whales as part of the much larger Gray whale Response to Ambient Noise Informed by Technology and Ecology (GRANITE) project. Quantifying the energy expenditure of PCFG gray whales during foraging can help establish a baseline for how disturbance impacts the ability of this unique population to meet their energy needs. Additionally, determining how many calories are burned during different PCFG foraging behaviors might help explain why some gray whales are in better body condition than others.
To understand how much energy different PCFG foraging behaviors cost, I am using data from suction cup tags we have temporarily applied on PCFG gray whales (Figure 1). You can read more about the why the GEMM Lab started using these tags in an earlier blog here. What I want to talk about in this blog is how exactly we can use this tag data to estimate energy expenditure of PCFG gray whales.
Figure 1. The famous “Scarlett” with a suction cup tag just attached using a carbon fiber pole (seen on far right). This minimally invasive tag has many data sensors, all of which sample at high frequencies, that can allow for an estimation of energy expenditure for different gray whale behaviors. Source: GEMM Lab; National Marine Fisheries Service (NMFS) permit no. 21678
The suction cups tags used in this project have many data sensors that are useful for describing the movement of the tagged whale including accelerometers, magnetometers, gyroscopes, and pressure sensors, and all are sampling at high frequencies. For example, the accelerometer is taking 400 measurements per second! The accelerometer, magnetometer, and gyroscope take measurements in 3 dimensions along the X, Y, and Z-axes. The whale’s movement around the X-axis indicates roll (if the whale is swimming on its side), while movement around the Y-axis indicates pitch (if the whales head is oriented towards the surface or the sea floor). Changes in the whale’s movement around the Z-axis indicates if the whale is changing its swimming direction. Together, all of these sensors can describe the dive profile, body orientation, fluking behavior, and fine-scale body movements of the animal down to the second (Figure 2). This allows for the behavior of the tagged whale to be specifically described for the entirety of the tag deployment.
Figure 2.An example of what the tag sensor data looks like. The top panels show the depth of the animal and can be used to determine the diving behavior of the whale. The middle panels show the body roll of the whale (the X axis) —a roll value close to 0 means the whale is swimming “normally” with no rotation to either side, while a higher roll value means the whale is positioned on its side. The bottom panels show the fluking behavior of the animal: each spike is the whale using its tail to propel itself through the water, with higher spikes indicating a stronger fluke stroke. Source: GEMM Lab, NMFS permit no. 21678
Although these suction cup tags are a great advancement in collecting fine-scale data, they do not have a sensor that actually measures the whale’s metabolism, or rate of calories burned by the whale. Thus, to use this fine-scale tag data as an estimate for energy expenditure, a summary metric must be calculated from the data and used as a proxy. The most common metric found in the literature is Overall Dynamic Body Acceleration (ODBA) and many papers have been published discussing the pros and cons of using ODBA as a proxy for energy expenditure (Brown et al., 2013; Gleiss et al., 2011; Halsey, 2017; Halsey et al., 2011; Wilson et al., 2020). The theory behind ODBA is that because an animal’s metabolic rate is primarily comprised of movement costs, then measuring the acceleration of the body is an effective way of determining energy expenditure. This theory might seem very abstract, but if you have ever worn a Fitbit or similar fitness tracking device to estimate how many calories you’ve burned during a workout, the same principle applies. Those fitness devices use accelerometers and other sensors, to measure the movement of your limbs and produce estimates of energy used.
So now that we’ve established that the goal of my research is to essentially use these suction cup tags as Fitbits for PCFG gray whales, let’s look at how accelerometry data has been used to detect foraging behavior in large whales so far. Many accelerometry tagging studies have used rorquals as a focal species (see Shadwick et al. (2019) for a review). Well-known rorqual species include humpback, fin, and blue whales. These species forage by using lunges to bulk feed on dense prey patches in the water column. Foraging lunges are indicated by isolated periods of high acceleration that are easily detectable in the tag data (Figure 3; Cade et al., 2016; Izadi et al., 2022).
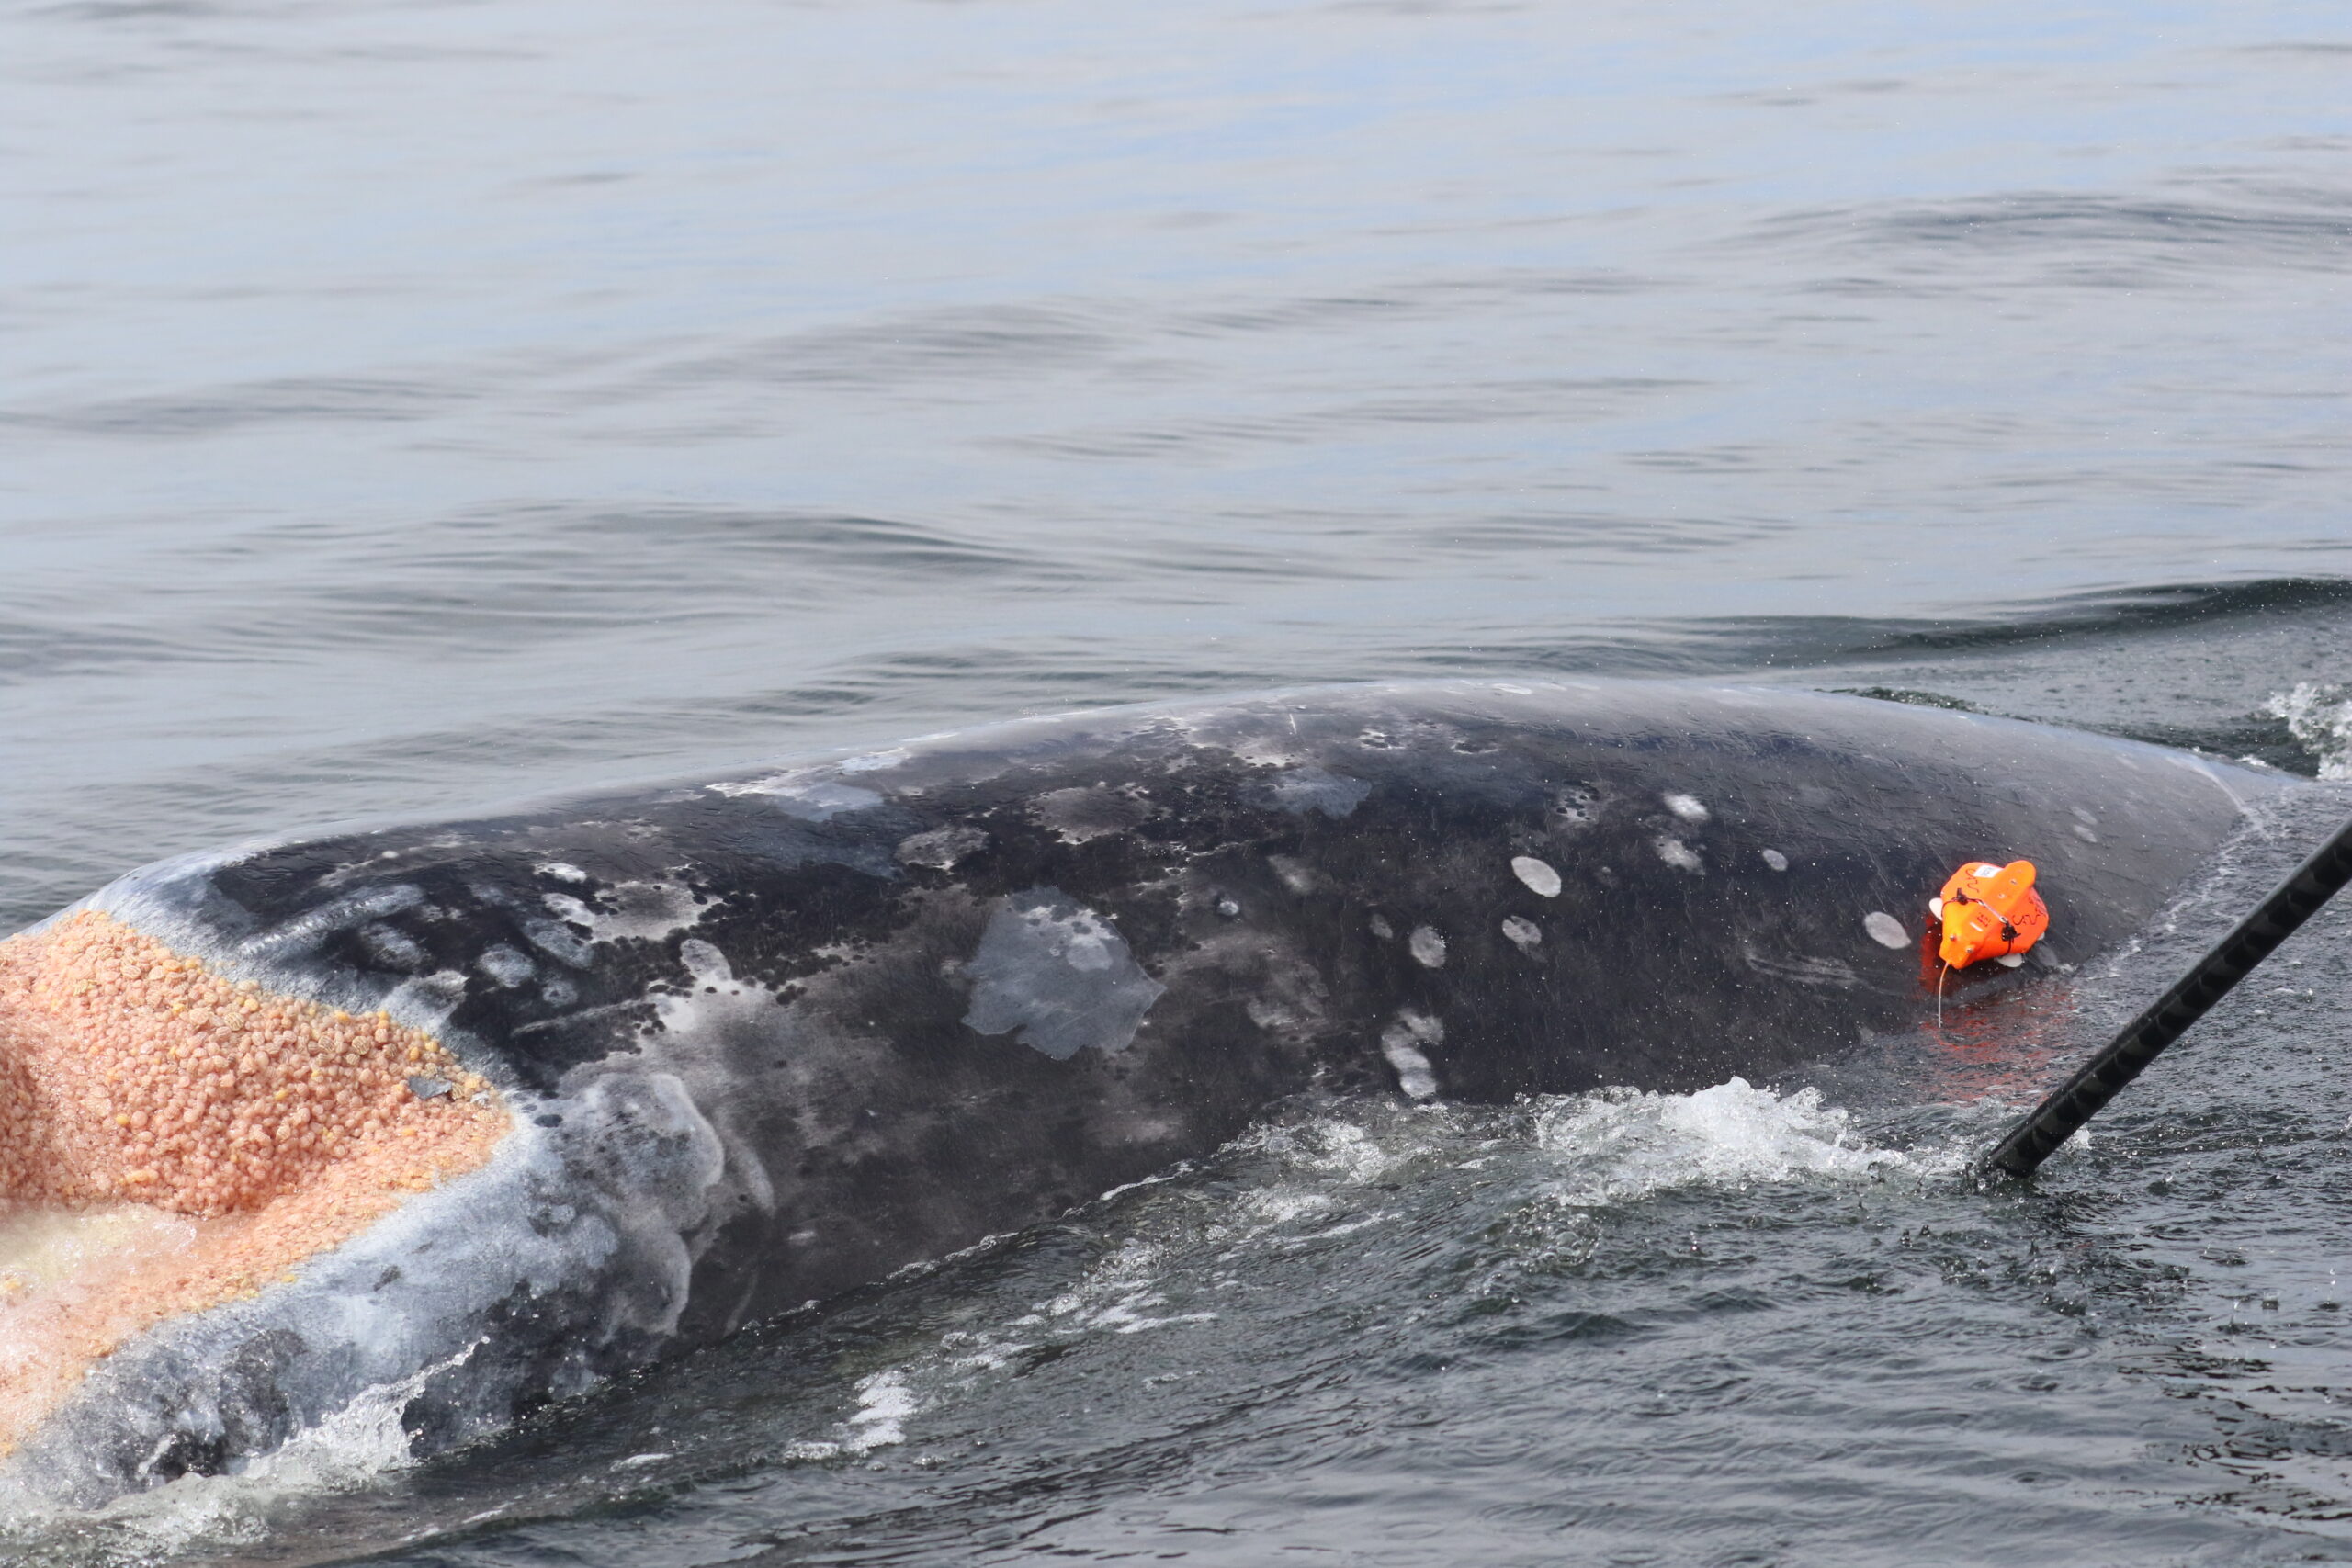
Figure 3.Top image: A foraging blue whale performing a surface lunge (Photo credit: GEMM Lab). Note the dense aggregation of krill in the whale’s mouth. Bottom image: The signature acceleration signal for lunge feeding (adapted from Izadi et al., 2022). Each color represents one of the 3D axes of whale movement. The discrete periods of high acceleration represent lunges.
However, gray whales feed very differently from rorquals. Gray whales primarily suction feed on the benthos, using their head to dig into the sediment and filter prey out of the mud using their baleen. Yet, PCFG gray whales often perform many other foraging behaviors such as headstanding and side-swimming (Torres et al., 2018). Additionally, PCFG gray whales tend to feed in water depths that are often shallower than their body length. This shallow depth makes it difficult to isolate signals of foraging in the accelerometry data from random variation in the data and separate the tag data into periods of foraging behaviors (Figure 4).
Figure 4.Top image: A foraging PCFG gray whale rolls on its side to feed on mysid prey. Bottom image: The graph shows the accelerometry data from our suction cup tags that can be used to calculate Overall Dynamic Body Acceleration (ODBA) as a way to estimate energy expenditure. Each color represents a different axis in the 3D motion of the whale. The X-axis is the horizontal axis shows forward and backward movement of the whale, the Y-axis shows the side-to-side movement of the whale, and the Z-axis shows the up-down motion of the whale. Note how there are no clear periods of high acceleration in all 3 axes simultaneously to indicate different foraging behaviors like is apparent during lunges of rorqual whales. However, there is a pattern showing that when acceleration in the Z-axis (blue line) is positive, the X- and Y-axes (red and green lines) are negative. Source: GEMM Lab; NMSF permit no. 21678
But there is still hope! Thanks to the GEMM Lab’s previous work describing the foraging behavior of the PCFG sub-group using drone footage, and the video footage available from the suction cup tags deployed on PCFG gray whales, the body orientation calculated from the tag data can be a useful indication of foraging. Specifically, high body roll is apparent in many foraging behaviors known to be used by the PCFG, and when the tag data indicates that the PCFG gray whale is rolled onto its sides, lots of sediment (and sometimes even swarms of mysid prey) is seen in the tag video footage. Therefore, I am busy isolating these high roll events in the collected tag data to identify specific foraging events.
My next steps after isolating all the roll events will be to use other variables such as duration of the roll event and body pitch (i.e., if the whales head is angled down), to define different foraging behaviors present in the tag data. Then, I will use the accelerometry data to quantify the energetic cost of performing these behaviors, perhaps using ODBA. Hopefully when I visit the GEMM Lab again next summer, I will be ready to share which foraging behavior leads to PCFG gray whales burning the most calories!
References:
Brown, D. D., Kays, R., Wikelski, M., Wilson, R., & Klimley, A. P. (2013). Observing the unwatchable through acceleration logging of animal behavior. Animal Biotelemetry, 1(1), 1–16. https://doi.org/10.1186/2050-3385-1-20
Cade, D. E., Friedlaender, A. S., Calambokidis, J., & Goldbogen, J. A. (2016). Kinematic diversity in rorqual whale feeding mechanisms. Current Biology, 26(19), 2617–2624. https://doi.org/10.1016/j.cub.2016.07.037
Gleiss, A. C., Wilson, R. P., & Shepard, E. L. C. (2011). Making overall dynamic body acceleration work: On the theory of acceleration as a proxy for energy expenditure. Methods in Ecology and Evolution, 2(1), 23–33. https://doi.org/10.1111/j.2041-210X.2010.00057.x
Halsey, L. G. (2017). Relationships grow with time: A note of caution about energy expenditure-proxy correlations, focussing on accelerometry as an example. Functional Ecology, 31(6), 1176–1183. https://doi.org/10.1111/1365-2435.12822
Halsey, L. G., Shepard, E. L. C., & Wilson, R. P. (2011). Assessing the development and application of the accelerometry technique for estimating energy expenditure. Comparative Biochemistry and Physiology – A Molecular and Integrative Physiology, 158(3), 305–314. https://doi.org/10.1016/j.cbpa.2010.09.002
Izadi, S., Aguilar de Soto, N., Constantine, R., & Johnson, M. (2022). Feeding tactics of resident Bryde’s whales in New Zealand. Marine Mammal Science, 1–14. https://doi.org/10.1111/mms.12918
Shadwick, R. E., Potvin, J., & Goldbogen, J. A. (2019). Lunge feeding in rorqual whales. Physiology, 34, 409–418. https://doi.org/10.1152/physiol.00010.2019
Torres, L. G., Nieukirk, S. L., Lemos, L., & Chandler, T. E. (2018). Drone up! Quantifying whale behavior from a new perspective improves observational capacity. Frontiers in Marine Science, 5, 1–14. https://doi.org/10.3389/fmars.2018.00319
Wilson, R. P., Börger, L., Holton, M. D., Scantlebury, D. M., Gómez-Laich, A., Quintana, F., Rosell, F., Graf, P. M., Williams, H., Gunner, R., Hopkins, L., Marks, N., Geraldi, N. R., Duarte, C. M., Scott, R., Strano, M. S., Robotka, H., Eizaguirre, C., Fahlman, A., & Shepard, E. L. C. (2020). Estimates for energy expenditure in free-living animals using acceleration proxies: A reappraisal. Journal of Animal Ecology, 89(1), 161–172. https://doi.org/10.1111/1365-2656.13040
“Violent” and “greedy” are words often used to describe gulls in populous areas where food or trash are readily available. Humans are used to seeing gulls in parking lots, parks, and plazas eating left over crumbs. Many people have even experienced menacing gulls ripping food away from their hands. Anecdotes like these have caused people to have negative perceptions of gulls. But could the repulsive attitude towards these birds be changed with evidence that not all gulls are the same? Well, Oregon may be home to an odd bunch.
Last year, the Seabird Oceanography Lab in conjunction with the GEMM Lab began putting GPS trackers on western gulls (Laurus occidentalis) off the Oregon Coast. One of the goals was to determine where gulls scavenge for food while raising chicks: at sea or on land in association with humans. We were particularly interested to see if western gulls in Oregon would behave similarly to western gulls in California, some of which make trips to the nearest landfill during the breeding season to bring not only food but also potentially harmful pathogens back to the colony.
During the 2015 breeding season, 10 commercially brand ‘i-gotU’ GPS data loggers were placed on gulls from ‘Cleft-in-the-Rock’ colony in Yachats, Oregon. The tags provided GPS locations at intervals of two minutes that determined the general habitat use areas (marine vs. terrestrial). After a two-week period, we were able to recapture six birds, remove tags, and download the data. We found that these western gulls stayed close to the colony and foraged in nearby intertidal and marine zones (Figure 1). Birds showed high site faithfulness by visiting the same foraging spots away from colony. It was interesting to see that inland habitat use did not extend past 1.3 miles from shore and the only waste facility within such boundaries did not attract any birds (Figure 1). Tagged birds never crossed the 101 Highway, but rather occurred at beaches in state parks such as Neptune and Yachats Ocean Road.
Figure 1. Tracks from 6 western gulls, each color representing a unique bird, from the Cleft-in-the-Rock colony carrying micro-GPS units.
While it is hard to determine whether gulls avoided anthropogenic sources of food at the beach, preliminary analysis shows a high percentage of time spent in marine and intertidal habitat zones by half of the individuals (Figure 2). At a first glance, this is not as much as it seemed on the tracking map (Figure 1), but it nonetheless confirms that these gulls seek food in natural areas. Moreover, time spent at the colony is represented as time spent on coastal habitat on the graph, and thus “coastal” foraging values are over represented. To get a more exact estimate of coastal habitat use, future analysis will have to exclude colony locations and distinguish foraging versus resting behaviors.
Figure 2. Bar plot of the percentage of time spent in three distinct habitats for each gull carrying a GPS unit. The three-letter code represents the unique Bird ID.
‘Cleft-in-the-Rock’ is unique and its surroundings may explain why there was high foraging in intertidal and marine zones rather than within city limits. (The Cleft colony can also be tricky to get to, with a close eye on the tide at all times – See video below). The colony site is close to the Cape Perpetua Scenic Area and surrounded by recently established conservation zones: the Cape Perpetua Marine Reserve Area, Marine Protected Area, and Seabird Protected Area (Figure 1). Each of these areas has different regulatory rules on what is allowed to take, which you can read about here. The implication of these protected areas in place means there is more food for wildlife! Moreover, the city of Yachats has a small population of 703 inhabitants (based on 2013 U.S Census Bureau). The small population allows the city to be relatively clean, and the waste facility is not spewing rotten odors into the air like in many big cities such as Santa Cruz (population of 62,864) where our collaborative gull study takes place. Thus, in Yachats, there is more limited odor or visual incentive to attract birds to landfills.
Field crew descends headland slope to reach ‘Cleft-in-the-Rock’ gull island in Yachats, OR (colony can be seen in distance across the water). The team must wear wetsuits and carry equipment in dry bags for protection during water crossing.
In order to determine whether gull habitat use in Yachats is a trend for all western gulls in Oregon, we need to track birds at more sites and for a longer time. That is why during the breeding season of 2016, we will be placing 30 new tags on gulls and include a new colony into the study, ‘Hunters Island’. The new colony is situated near the Pistol River, between Gold Beach and Brookings in southern Oregon, and it is part of the Oregon Islands Wildlife Refuge.
We will have 10 ‘i-gotU’ tags (Figure 3) and 20 CATS tags (Figure 4), the latter are solar powered and can collect data for several weeks, months, and hopefully even years! These tags do not need to be retrieved for data download; rather data can be accessed remotely, providing minimal disturbance to the gulls and colony. With long-term data, we can explore further into the important feeding areas for western gulls, examine rates of foraging in different habitats, and determine how extensive intertidal and marine foraging is throughout the year.
Figure 3. Taping an i-gotU tag for temporary attachment on the tail feathers of a gull.
Figure 4. Rehearsing the placement and harness attachment of a CATS tag which must be secured on the bird‘s back, looping around the wings and hips.
We are excited to kick start our field season in the next couple of weeks and see how well the new tags work. We know that some questions will be solved and many new questions will arise; and we cannot wait to start this gull-filled adventure!
References
Osterback, A.M., Frechette, D., Hayes, S., Shaffer, S., & Moore, J. (2015). Long-term shifts in anthropogenic subsidies to gulls and implications for an imperiled fish. Biological Conservation, 191: 606–613.