From land, sea,… and space: searching for whales in the vast ocean

By Solène Derville, Postdoc, OSU Department of Fisheries, Wildlife, and Conservation Science, Geospatial Ecology of Marine Megafauna Lab

The ocean is vast.

What I mean is that the vastness of the ocean is very hard to mentally visualize. When facing a conservation issue such as increased whale entanglement along the US West Coast (see OPAL project ), a tempting solution may  be to suggest « let’s go see where the whales are and report their location to the fishermen?! ». But, it only takes a little calculation to realize how impractical this idea is.

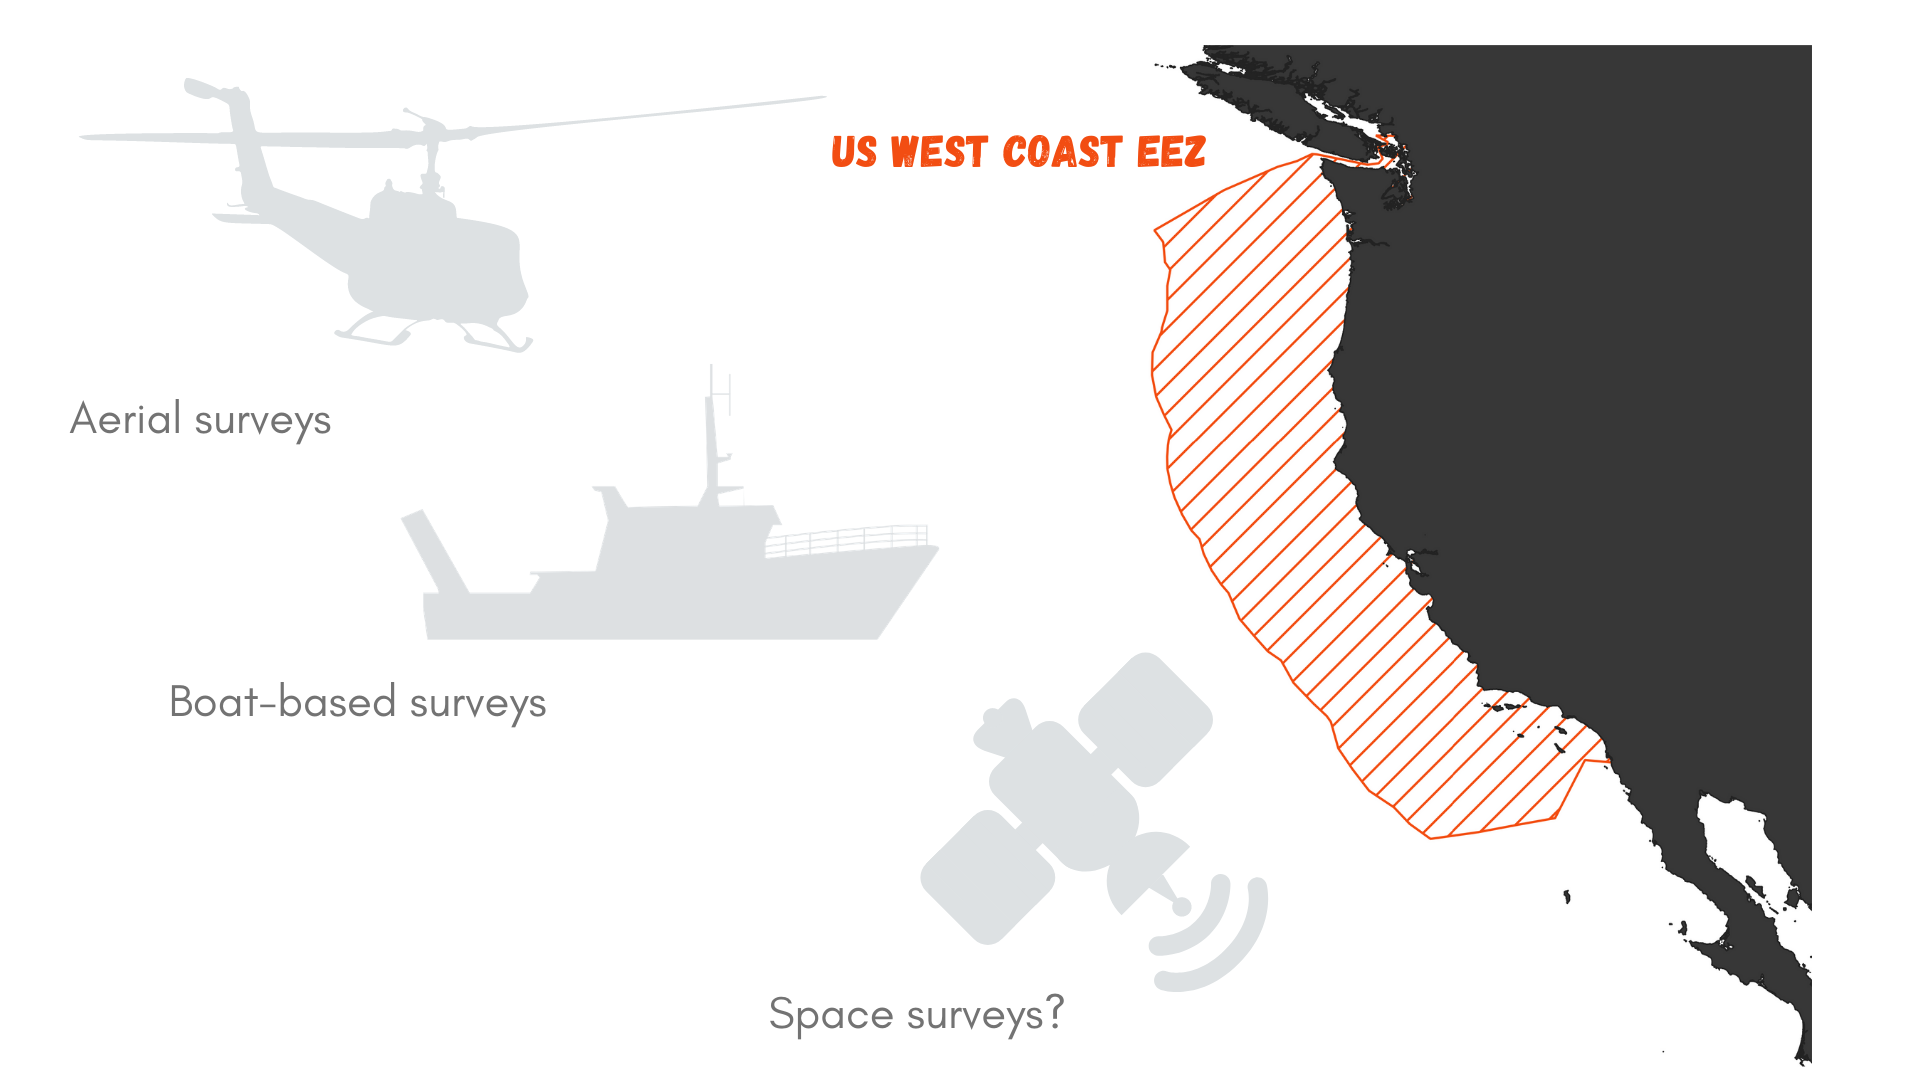
Let’s roll out the numbers. The US West Coast exclusive economic zone (EEZ) stretches from the coast out to 200 nautical miles offshore, as prescribed by the 1982 United Nations Convention on the Law of the Sea. It covers an area of 825,549 km² (Figure 1). Now, imagine that you wish to survey this area for marine mammals. Using a vessel such as the R/V Bell M. Shimada that is used for the Northern California Current Ecosystem surveys cruises (NCC cruises, see Dawn and Rachel’s last blog), we may detect whales at a distance of roughly 6 km (based on my preliminary results). This distance of detection depends on the height of the observer, hence the height of the flying bridge where she/he is standing (the observer’s height may also be accounted for, but unless she/he is a professional basket-ball player, I think it can be neglected here). The Shimada is quite a large ship and it’s flying bridge is 13 meters above the water. Two observers may survey the water on each side of the trackline.

Considering that the vessel is moving at 8 knots (~15 km/h), we may expect to be effectively surveying 180 km² per hour (6x2x15). That’s not too bad, right?

Again, perspective is the key. If we divide the West Coast EEZ surface by 180 km² we can estimate that it would take 2,752 hours to survey this entire region. With an average of 12 hours of daylight, this takes us to…

382 DAYS OF SURVEY, searching for marine mammals over the US West Coast. Considering that observations cannot be undertaken on days with bad weather (fog, heavy rain, strong winds…), it might take more than a year and a half to complete the survey! And what would the marine mammals have done in the meantime? Move…

This little math exercise proves that exhaustively searching for the needle in the haystack from a vessel is not the way to go if we are to describe whale distribution and help mitigate the risk of entanglement. And using another platform of observation is not necessarily the solution. The OPAL project has relied on a great collaboration with the United States Coast Guard to survey Oregon waters. The USCG helicopters travel fast compared to a vessel, about 90 knots (167 km/h). As a result, more ground is covered but the speed at which it is traveling prevents the observer from detecting whales that are very far away. Based on the last analysis I ran for the OPAL project, whales are usually detected up to 3 km from the helicopter (only 5 % of sightings exceed that distance). In addition, the helicopter generally only has capacity for one observer at a time.

If we replicate the survey time calculation from above for the USCG helicopter, we realize that even with a fast-moving aerial survey platform it would still take 137 days to cover the West Coast EEZ.

Figure 1. What is the best survey method to document marine mammal occurrence in the US West Coast Exclusive Economic zone (EEZ)?

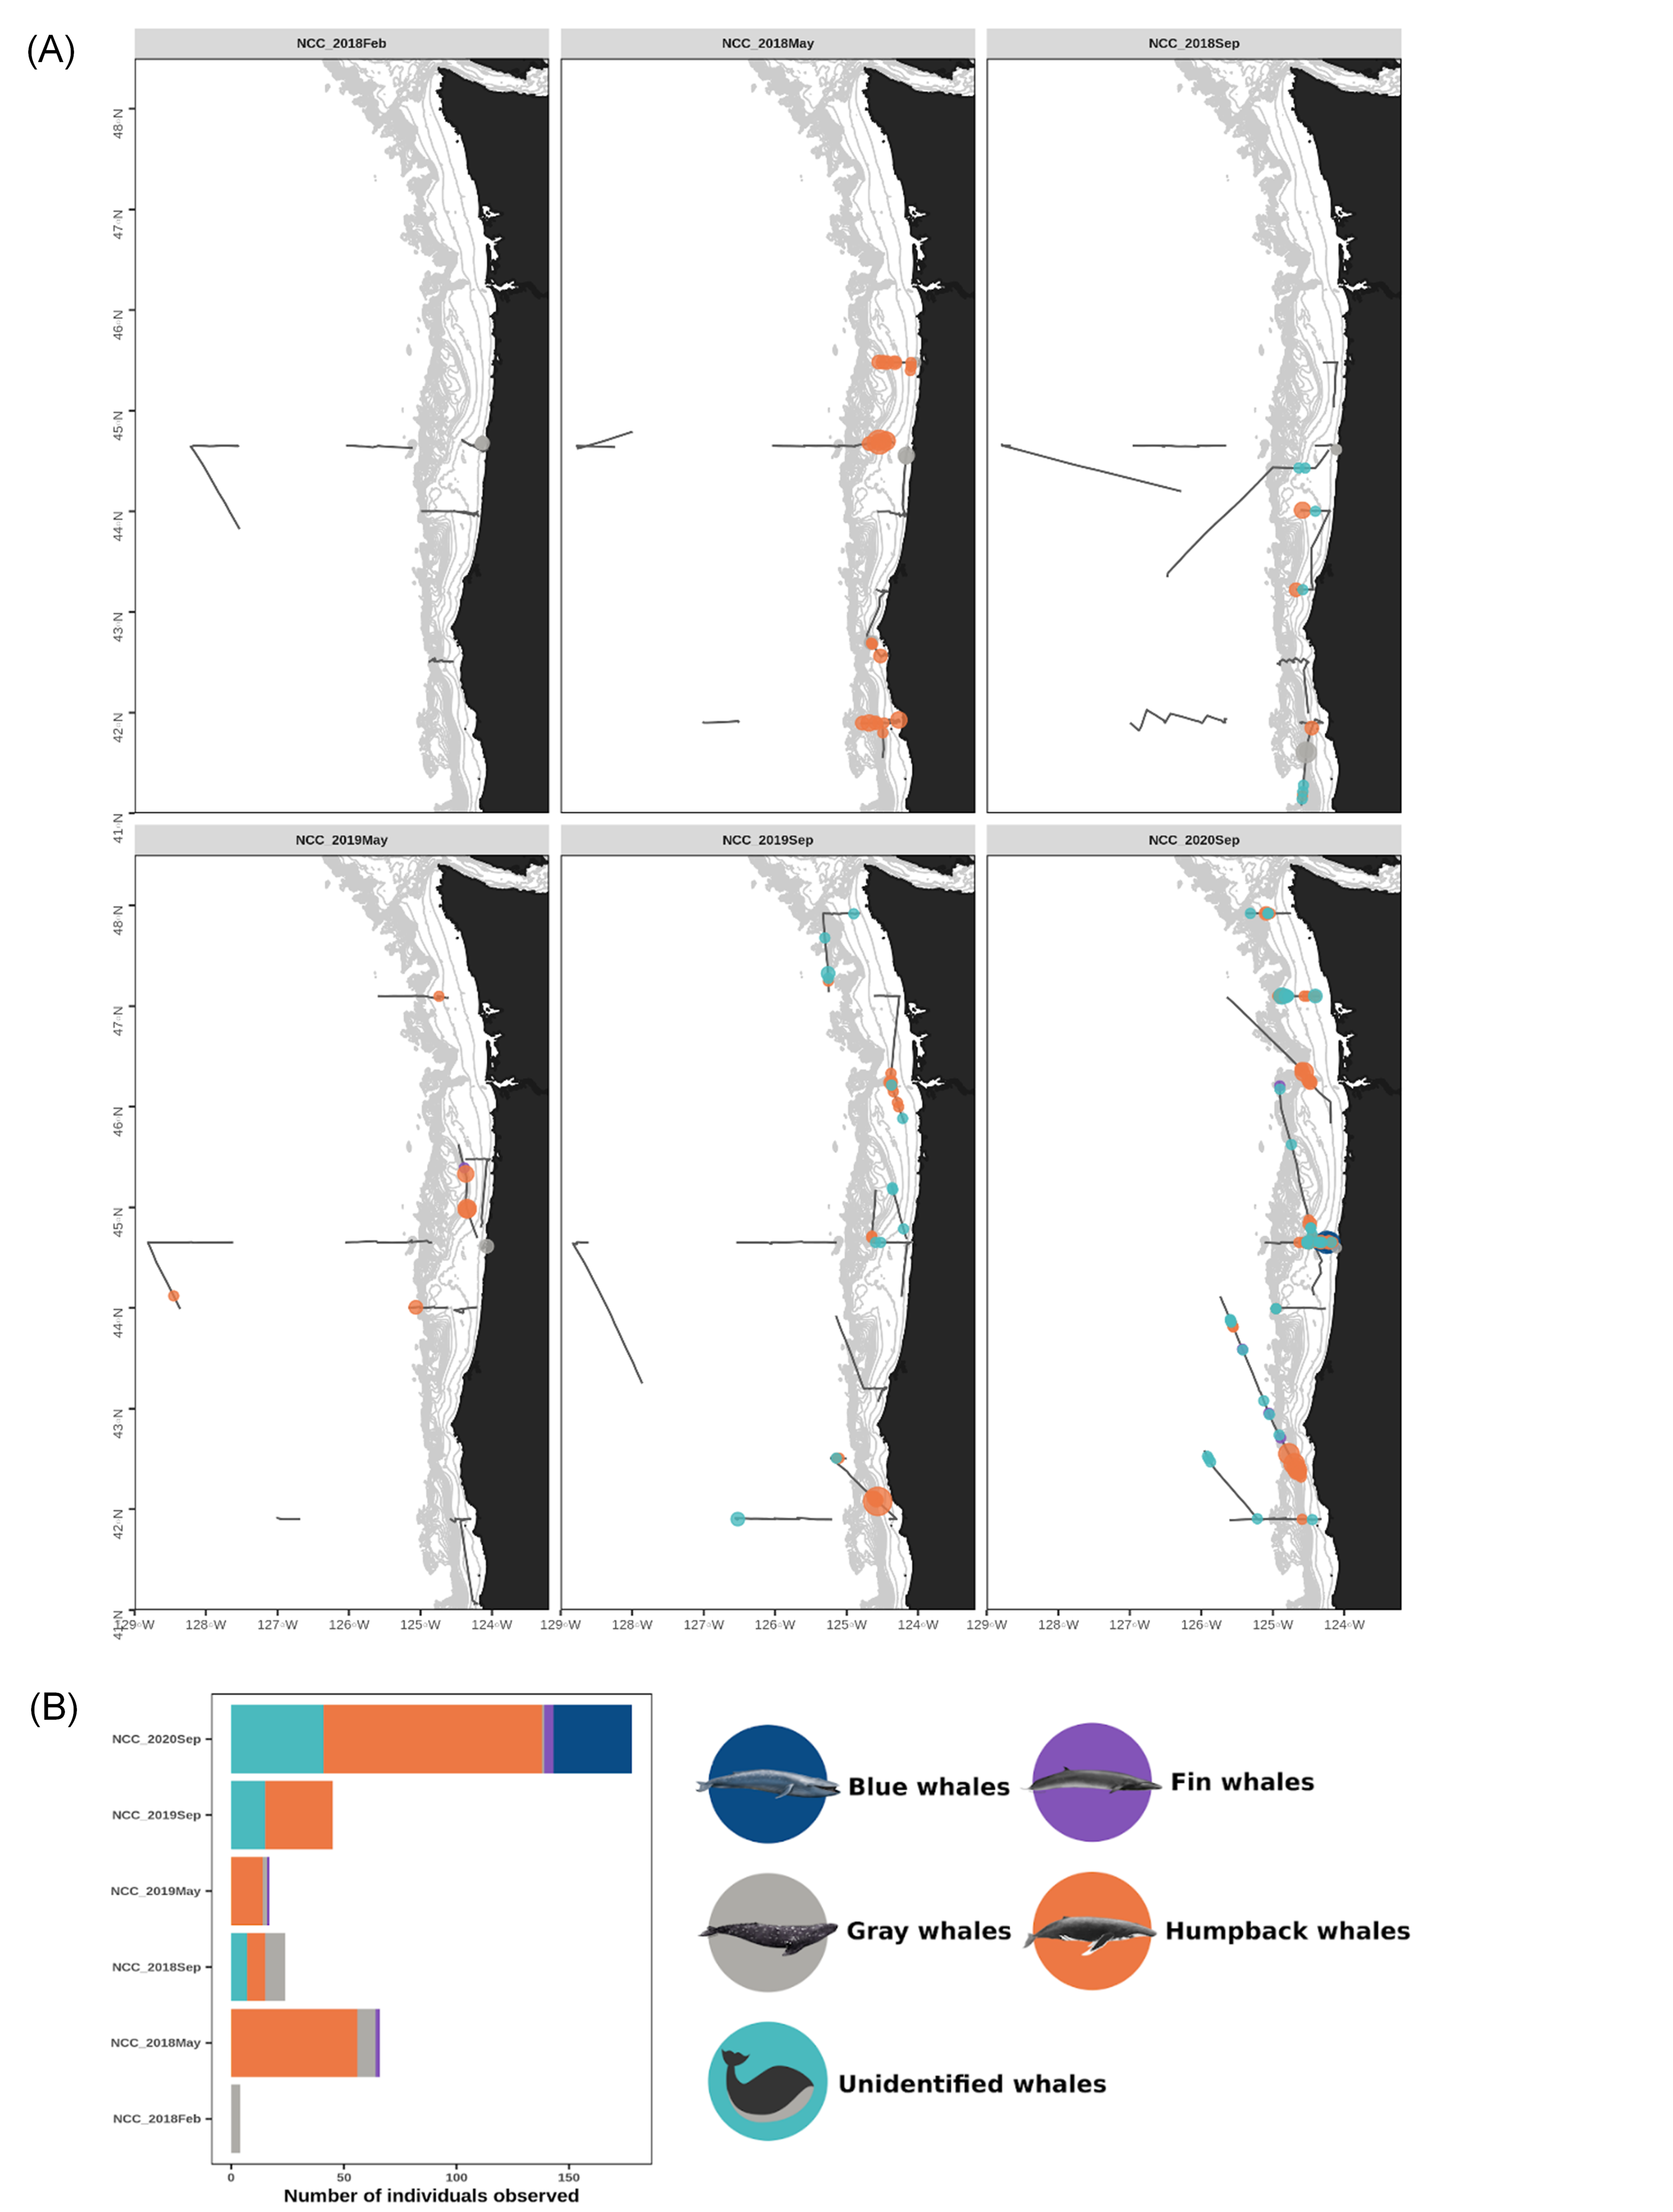
First, we can model and extrapolate. This approach is the path we are taking with the OPAL project: we survey Oregon waters in 4 different areas along the coast each month, then model observed whale densities as a function of topographic and oceanographic variables, and then predict whale probability of presence over the entire region. These predictions are based on the assumption that our survey design effectively sampled the variety of environmental conditions experienced by whales over the study region, which it certainly did considering that all sites are surveyed year-round.

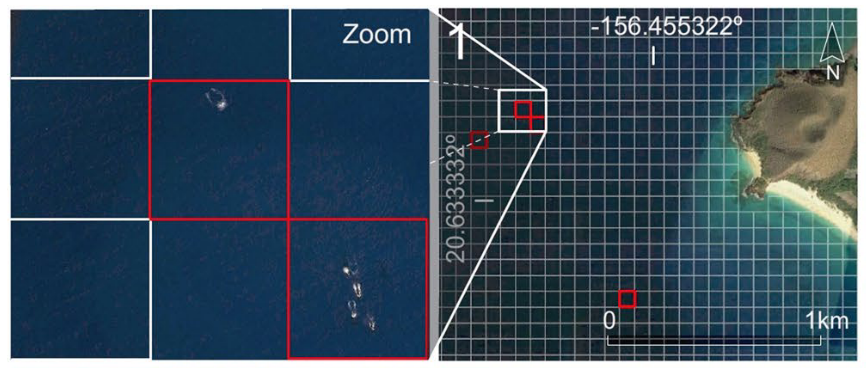
An alternative approach that has been recently discussed in the GEMM Llab, is the use of satellite images to detect whales along the coast. A communication entitled « The Potential of Satellite Imagery for Surveying Whales » was published last month in the Sensors Journal (Höschle et al., 2021) and presents the opportunities offered by this relatively new technology. The WorldView-3 satellite, owned by the company Digitalglobe and launched in 2016, has made it possible to commercialize imagery with a resolution never reached before, of the order of 30 cm per pixel. These very high resolution (VHR) satellite images make it possible to identify several species of large whales (Cubaynes et al. al., 2019) and to estimate their density (Bamford et al., 2020). Furthermore, machine learning algorithms, such as Neural Networks, have proved quite efficient at automatically detecting whales in satellite images (Guirado et al., 2019, Figure 2). While several new ultra-high resolution imaging satellites are expected to be launched in 2021 (by Maxar Technologies and Airbus), this “remote” approach looks like a promising avenue to detect whales over vast regions while drinking a cup of coffee at the office.

Figure 2. Illustration of a whale detection algorithm working on a gridded satellite image (DigitalGlobe). Source: Guirado et al., 2019.

But like any other data collection method, satellites have their drawbacks. We recently discovered that these VHR satellites are routinely switched off while passing above the ocean. Specific inquiries would need to be made to acquire data over our study areas, which would be at great expense. One of the cheapest provider I found is the Soar platform, that provides images at 50 cm resolution in partnership with the Chinese Aerospace Science and Technology Corporation. They advertise daily images anywhere on earth at $10 USD per km². This might sound cheap at first glance, but circling back to our US West Coast EEZ area calculations, we estimate that surveying this region entirely with satellite imagery would cost more than $8 million USD.

Yet, we have to look forward. The use of satellite imagery is likely to broaden and increase in the coming years, with a possible decrease in cost. Quoting Höschle et al. (2021) ‘To protect our world’s oceans, we need a global effort and we need to create opportunities for that to happen’.

Will satellites soon save whales?


References

Bamford, C. C. G. et al. A comparison of baleen whale density estimates derived from overlapping satellite imagery and a shipborne survey. Sci. Rep. 10, 1–12 (2020).

Cubaynes, H. C., Fretwell, P. T., Bamford, C., Gerrish, L. & Jackson, J. A. Whales from space: Four mysticete species described using new VHR satellite imagery. Mar. Mammal Sci. 35, 466–491 (2019).

Guirado, E., Tabik, S., Rivas, M. L., Alcaraz-Segura, D. & Herrera, F. Whale counting in satellite and aerial images with deep learning. Sci. Rep. 9, 1–12 (2019).

Höschle, C., Cubaynes, H. C., Clarke, P. J., Humphries, G. & Borowicz, A. The potential of satellite imagery for surveying whales. Sensors 21, 1–6 (2021).

Lessons learned from (not) going to sea

By Rachel Kaplan1 and Dawn Barlow2

1PhD student, Oregon State University College of Earth, Ocean, and Atmospheric Sciences and Department of Fisheries and Wildlife, Geospatial Ecology of Marine Megafauna Lab

2PhD Candidate, Oregon State University Department of Fisheries and Wildlife, Geospatial Ecology of Marine Megafauna Lab

“Hurry up and wait.” A familiar phrase to anyone who has conducted field research. A flurry of preparations, followed by a waiting game—waiting for the weather, waiting for the right conditions, waiting for unforeseen hiccups to be resolved. We do our best to minimize unknowns and unexpected challenges, but there is always uncertainty associated with any endeavor to collect data at sea. We cannot control the whims of the ocean; only respond as best we can.

On 15 February 2021, we were scheduled to board the NOAA Ship Bell M. Shimada as marine mammal observers for the Northern California Current (NCC) ecosystem survey, a recurring research cruise that takes place several times each year. The GEMM Lab has participated in this multidisciplinary data collection effort since 2018, and we are amassing a rich dataset of marine mammal distribution in the region that is incorporated into the OPAL project. February is the middle of wintertime in the North Pacific, making survey conditions challenging. For an illustration of this, look no further than at the distribution of sightings made during the February 2018 cruise (Fig. 1), when rough sea conditions meant only a few whales were spotted.

Figure 1. (A) Map of marine mammal survey effort (gray tracklines) and baleen whale sightings recorded onboard the NOAA ship R/V Shimada during each of the NCC research cruises to-date and (B) number of individuals sighted per cruise since 2018. Note the amount of survey effort conducted in February 2018 (top left panel) compared to the very low number of whales sighted. Data summary and figures courtesy of Solene Derville.

Now, this is February 2021 and the world is still in the midst of navigating the global coronavirus pandemic that has affected every aspect of our lives. The September 2020 NCC cruise was the first NOAA fisheries cruise to set sail since the pandemic began, and all scientists and crew followed a strict shelter-in-place protocol among other COVID risk mitigation measures. Similarly, we sheltered in place in preparation for the February 2021 cruise. But here’s where the weather comes in yet again. Not only did we have to worry about winter weather at sea, but the inclement conditions across the country meant our COVID tests were delayed in transit—and we could not board the ship until everyone tested negative. By the time our results were in, the marine forecast was foreboding, and the Captain determined that the weather window for our planned return to port had closed.

So, we are still on shore. The ship never left the dock, and NCC February 2021 will go on the record as “NAs” rather than sightings of marine mammal presence or absence. So it goes. We can dedicate all our energy to studying the ocean and these spectacularly dynamic systems, but we cannot control them. It is an important and humbling reminder. But as we have continued to learn over the past year, there are always silver linings to be found.

Even though we never made it to the ship, it turns out there’s a lot you can get done onshore. Dawn has sailed on several NCC cruises before, and one of the goals this time was to train Rachel for her first stint at marine mammal survey work. This began at Dawn’s house in Newport, where we sheltered in place together for the week prior to our departure date.

We walked through the iPad program we use to enter data, looked through field guides, and talked over how to respond in different scenarios we might encounter while surveying for marine mammals at sea. We also joined Solene, a postdoc working on the OPAL project, for a Zoom meeting to edit the distance sampling protocol document. It was great training to discuss the finer points of data collection together, with respect to how that data will ultimately be worked into our species distribution models.

The February NCC cruise is famously rough, and a tough time to sight whales (Fig. 1). This low sighting rate arises from a combination of factors: baleen whales typically spend the winter months on their breeding grounds in lower latitudes so their density in Oregon waters is lower, and the notorious winter sea state makes sighting conditions difficult. Solene signed off our Zoom call with, “Go collect that high-quality absence data, girls!” It was a good reminder that not seeing whales is just as important scientifically as seeing them—though sometimes, of course, it’s not possible to even get out where you can’t see them. Furthermore, all absence data is not created equal. The quality of the absence data we can collect deteriorates along with the weather conditions. When we ultimately use these survey data to fuel species distribution models, it’s important to account for our confidence in the periods with no whale sightings.

In addition to the training we were able to conduct on land, the biggest silver lining came just from sheltering in place together. We had only met over Zoom previously, and spending this time together gave us the opportunity to get to know each other in real life and become friends. The week involved a lot of fabulous cooking, rainy walks, and an ungodly number of peanut butter cups. Even though the cruise couldn’t happen, it was such a rich week. The NCC cruises take place several times each year, and the next one is scheduled for May 2021. We’ll keep our fingers crossed for fair winds and negative COVID tests in May!

Figure 2. Dawn’s dog Quin was a great shelter in place buddy. She was not sad that the cruise was canceled.

Tales from the birds in the nest (on the ship at sea)

Clara Bird, PhD Student, OSU Department of Fisheries and Wildlife, Geospatial Ecology of Marine Megafauna Lab

Greetings from the NOAA research vessel Shimada! As you may know from previous blogs, usually one member of the GEMM Lab goes on the Northern California Current (NCC) ecosystem survey cruises as a marine mammal observer to collect data for the project Where are whales in Oregon waters? But for this September 2020 cruise we have two observers on-board. I’m at-sea  with fellow GEMM lab student Dawn Barlow to learn the ropes and procedures for how we collect data. This research cruise is exciting for a few reasons: first, this is my first cruise as a marine mammal observer! And second, this is the first NOAA Northwest Fisheries Science Center research cruise since the COVID-19 pandemic began in the United States.

Our job as observers involves surveying for marine mammals from the flying bridge, which is the upper most deck of the ship, above the Bridge where the officers command the vessel. Here, we are referred to as the “birds in the nest” by the officers (something I find fitting given my last name). We spend our time looking out at the water with our binoculars searching for any sign of a marine mammal. These signs include: a blow, a fluke, a flipper, or the splash of a dolphin. Surveys involve long stretches of time staring at the ocean seeing nothing but blue waves, punctuated by exciting moments. The level of excitement of these moments can range from finally seeing a blow in the distance to seeing a whale breach! As of the time I’m writing this blog, we’ve been at sea for six days and have four more to go, so I will describe the things we’ve seen and my experience being on a primarily oceanographic research cruise.

We started day one transiting offshore of Newport, right into some whale soup! What started as a few distant blows quickly became an ocean full of whales. Dawn and I were some-what frantic as we worked to keep track of the many humpback and blue whales that were around us (I saw my first blue whale!). We even saw a humpback whale breaching! This introduction to marine mammal observation was an exciting exercise in keeping track of blows and rapid species identification. Day two was pretty similar, as we spent the day travelling back inshore along the same path we had followed offshore on day one. It was cool to see that there were still many whales in the same area.

On day three we woke up to dense fog, and overall pretty poor conditions for marine mammal observing. One of the challenges of this work is that not only does bad weather make it hard to see, but it also makes it hard for us to be able to say that mammals were truly absent. In bad observation conditions we cannot know if we did not see anything because the animals were not there or if we just could not see them through the swell, fog or white-caps. However, by the late afternoon the fog cleared and we had a spectacular end of the day. We saw a killer whale breach (Image 1) and a humpback whale tail lobbing (smacking it’s fluke against the surface of the water) in front of a stunning sunset (Image 2).

(Top) Figure 1. A killer whale breaching. Photo credit: Clara Bird. (Bottom) Figure 2. A humpback whale fluke at sunset. Photo credit: Dawn Barlow.

Day four was a bit of a marine mammal work reality check. While spectacular evenings like day three are memorable and exhilarating, they tend to be rare. The weather conditions on day four were pretty poor and we ended up surveying from the bridge for most of the day and not seeing much. Conditions improved on day five and we had some fun dolphin sightings where they came and rode on the wake from the bow, and observed a sperm whale blow in the distance!

The weather was not great today (day six), especially in the morning, but we did have one particularly exciting sighting right along the edge of Heceta Bank. While we were stopped at an oceanographic sampling station, we were visited by a group of ~30 pacific white sided dolphins who spent about half an hour swimming around the ship. We also saw several humpback whales, a fur seal, and a Mola mola (Ocean sunfish)! It was incredible to be surrounded by so many different species, all so close to the ship at the same time.

Overall, it has been wonderful to be out at sea after the many isolating months of COVID. And, it has been an exciting and interesting experience being surrounded by non-whale scientists who think about this ecosystem from a different perspective. This cruise is focused on biological oceanography, so I have had the great opportunity to learn from these amazing scientists about what they study and what oceanographic patterns they document. It’s a good reminder of our interconnected research. While it’s been cool to observe marine mammals and think about something totally different from my research on gray whale behavior, I have also enjoyed finding the similarities. For example, just last night I had a conversation with a graduate student researching forams (check out this link to learn more about these super cool tiny organisms!). Even though the organisms we study are polar opposites in terms of size, we actually found out that we had a good bit in common because we both use images to study our study species and have both encountered similar unexpected technical challenges in our methods.

I am thoroughly enjoying my time being one of the “birds in the nest”, contributing data to this important project, and meeting these wonderful scientists. If you are curious about how the rest of the cruise goes, make sure to check out Dawn’s blog next week!