An ‘X’travaganza! Introducing the Marine Mammal Institute’s Center of Drone Excellence (CODEX)

Dr. KC Bierlich, Postdoctoral Scholar, OSU Department of Fisheries, Wildlife, & Conservation Sciences, Geospatial Ecology of Marine Megafauna Lab

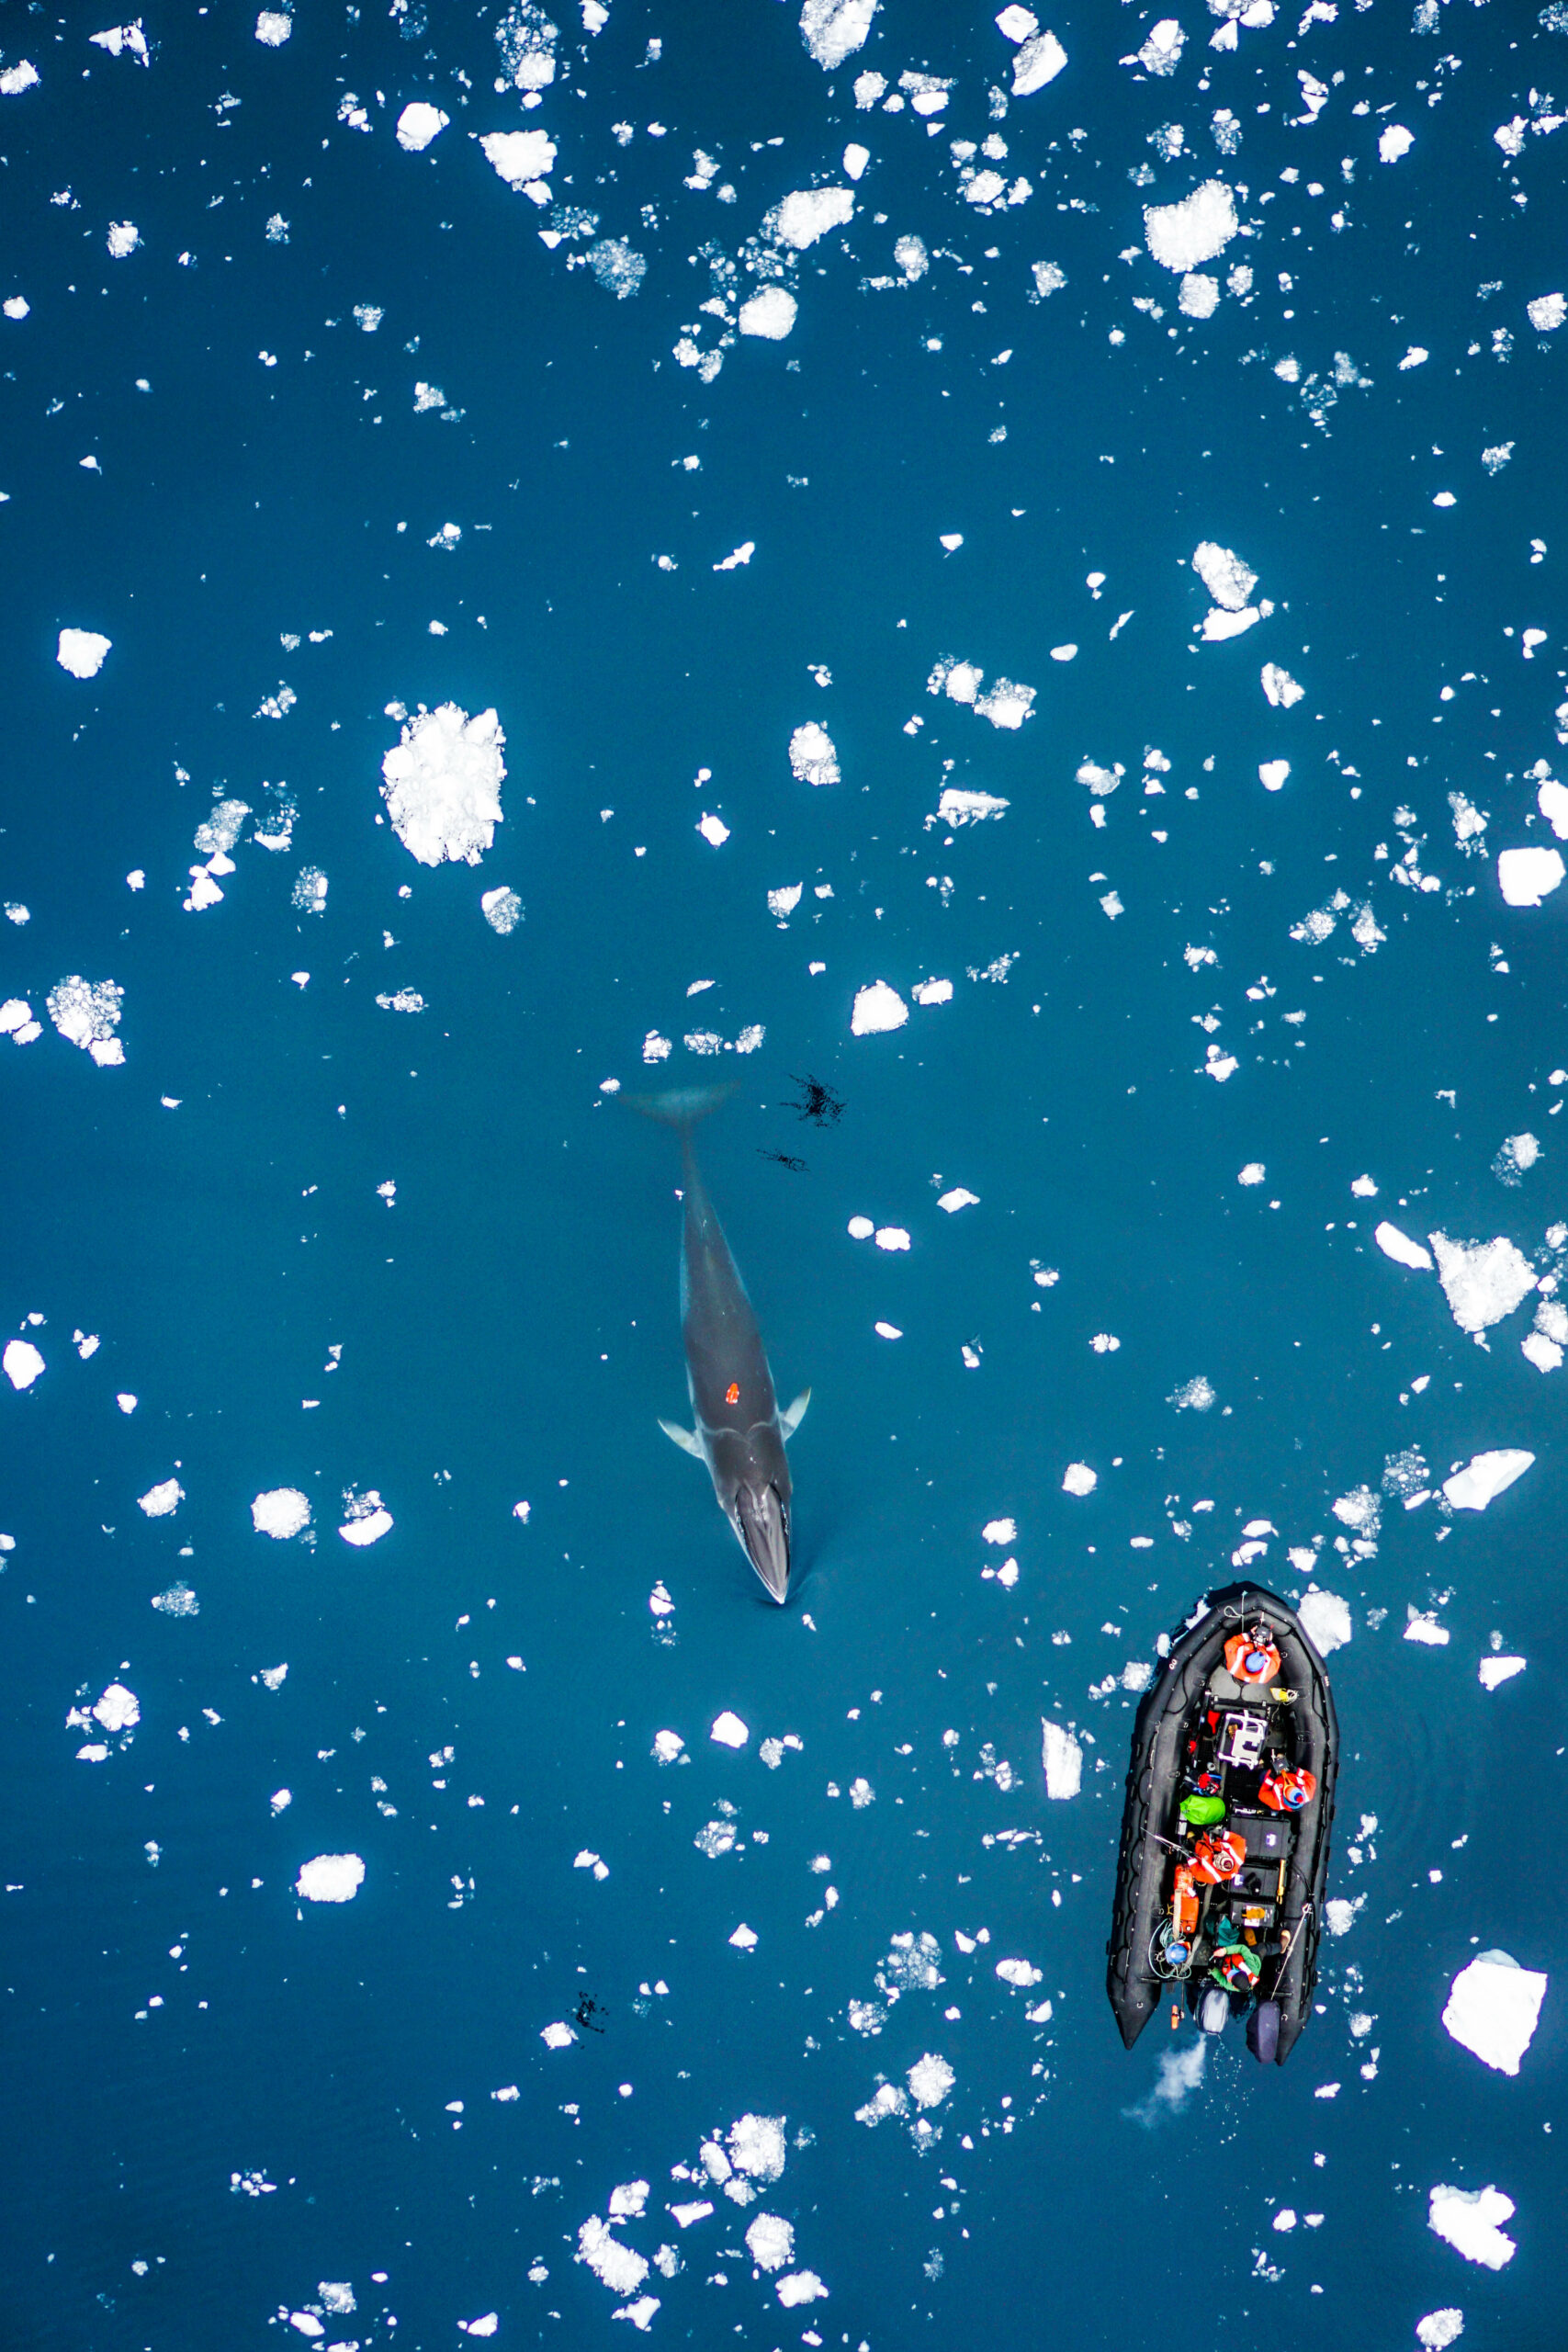
Drones are becoming more and more prevalent in marine mammal research, particularly for non-invasively obtaining morphological measurements of cetaceans via photogrammetry to identify important health metrics (see this and this previous blog). For example, the GEMM Lab uses drones for the GRANITE Project to study Pacific Coast Feeding Group (PCFG) gray whales and we have found that PCFG whales are skinnier and morphologically shorter with smaller skulls and flukes compared to the larger Eastern North Pacific (ENP) population. The GEMM Lab has also used drones to document variation in body condition across years and within a season, to diagnose pregnancy, and even measure blowholes.

While drone-based photogrammetry can provide major insight into cetacean ecology, several drone systems and protocols are used across the scientific community in these efforts, and no consistent method or centralized framework is established for quantifying and incorporating measurement uncertainty associated with these different drones. This lack of standardization restricts comparability across datasets, thus hindering our ability to effectively monitor populations and understand the drivers of variation (e.g., pollution, climate change, injury, noise).

We are excited to announce the Marine Mammal Institute’s (MMI) Center of Drone Excellence (CODEX), which focuses on developing analytical methods for using drones to non-invasively monitor marine mammal populations. CODEX is led by GEMM Lab member’s KC Bierlich, Leigh Torres, and Clara Bird and consists of other team members within and outside OSU. We draw from many years of trials, errors, headaches, and effort working with drones to study cetacean ecology in a variety of habitats and conditions on many different species.

Already CODEX has developed several open-source hardware and software tools. We developed, produced, and published LidarBoX (Bierlich et al., 2023), which is a 3D printed enclosure for a LiDAR altimeter system that can be easily attached and swapped between commercially available drones (i.e., DJI Inspire, DJI Mavic, and DJI Phantom) (Figure 1). Having a LidarBoX installed helps researchers obtain altitude readings with greater accuracy, yielding morphological measurements with less uncertainty. Since we developed LidarBoX, we have received over 35 orders to build this unit for other labs in national and international universities.

Figure 1. A ‘LidarBoX’ attached to a DJI Inspire 2. The LidarBoX is a 3D printed enclosure containing a LiDAR altimeter to help obtain more accurate altitude readings.

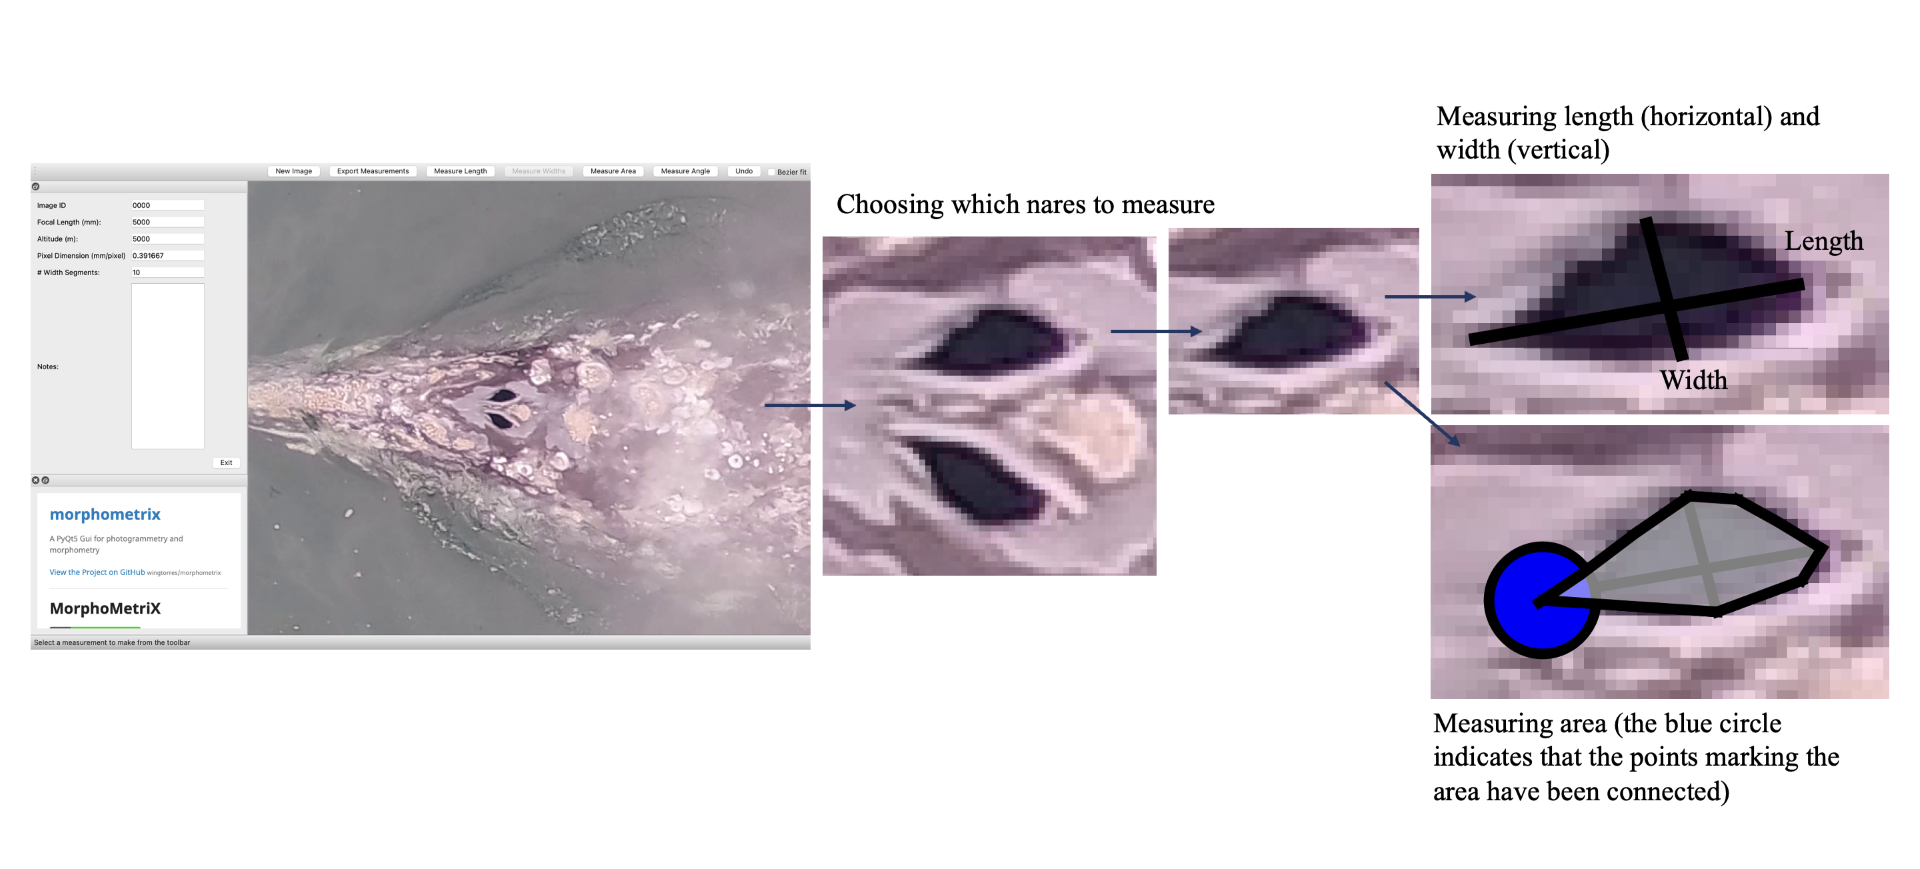
Additionally, CODEX recently released MorphoMetriX version 2 (v2), an easy-to-use photogrammetry software that provides users with the flexibility to obtain custom morphological measurements of megafauna in imagery with no knowledge of any scripting language (Torres and Bierlich, 2020). CollatriX is a user-friendly software for collating multiple MorphoMetriX outputs into a single dataframe and linking important metadata to photogrammetric measurements, such as altitude measured with a LidarBoX (Bird and Bierlich, 2020). CollatriX also automatically calculates several body condition metrics based on measurements from MorphoMetriX v2. CollatriX v2 is currently in beta-testing and scheduled to be released late Spring 2024. 

Figure 2. An example of a Pygmy blue whale imported into MorphoMetriX v2, open-source photogrammetry software. 

CODEX also recently developed two automated tools to help speed up the laborious manual processing of drone videos for obtaining morphological measurements (Bierlich & Karki et al., in revision). DeteX is a graphical user interface (GUI) that uses a deep learning model for automated detection of cetaceans in drone-based videos. Researchers can input their drone-based videos and DeteX will output frames containing whales at the surface. Users can then select which frames they want to use for measuring individual whales and then input these selected frames into XtraX, which is a GUI that uses a deep learning model to automatically extract body length and body condition measurements of cetaceans (Figure 4). We found automated measurements from XtraX to be similar (within 5%) of manual measurements. Importantly, using DeteX and XtraX takes about 10% of the time it would take to manually process the same videos, demonstrating how these tools greatly speed up obtaining key morphological data while maintaining accuracy, which is critical for effectively monitoring population health.

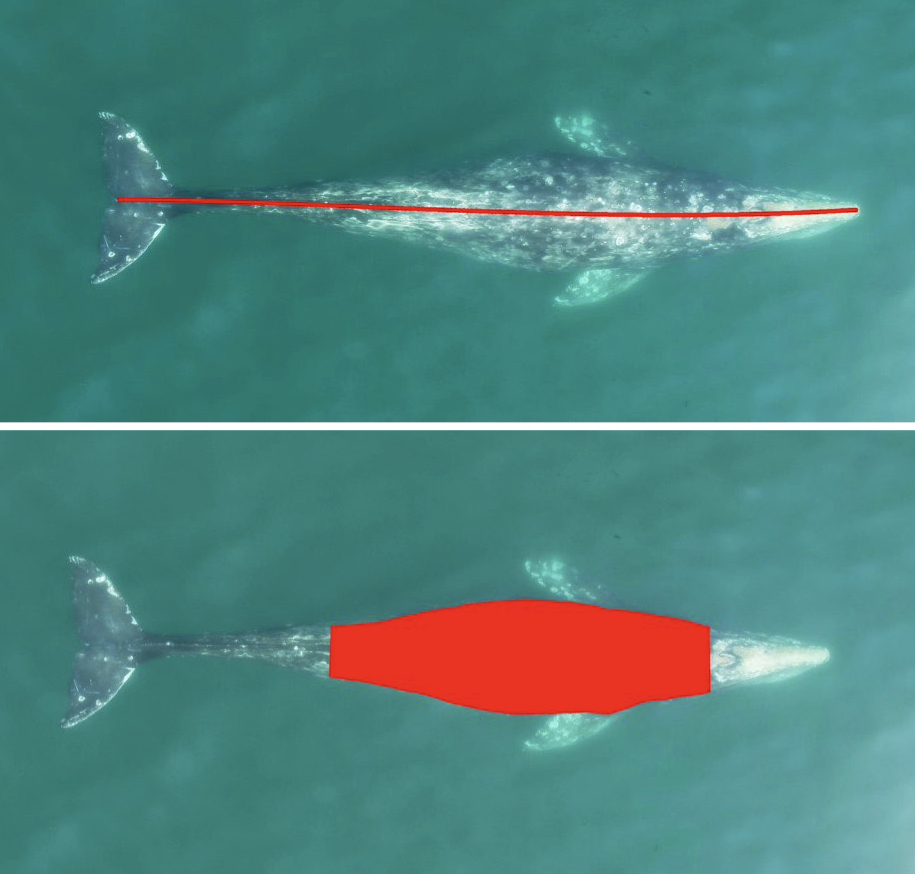
Figure 3. An example of an automated body length (top) and body condition (bottom) measurement of a gray whale using XtraX (Bierlich & Karki et al., in revision).

CODEX is also in the process of developing Xcertainty, an R package that uses a Bayesian statistical model to quantify and incorporate uncertainty associated with measurements from different drones (see this blog). Xcertainty is based on the Bayesian statistical model developed by Bierlich et al., (2021b; 2021a), which has been utilized by many studies with several different drones to compare body condition and body morphology across individuals and populations  (Bierlich et al., 2022; Torres et al., 2022; Barlow et al., 2023). Rather than a single point-estimate of a length measurement for an individual, Xcertainty produces a distribution of length measurements for an individual so that the length of a whale can be described by the mean of this distribution, and its uncertainty as the the variance or an interval around the mean (Figure 4). These outputs ensure measurements are robust and comparable across different drones because they provide a measure of the uncertainty around each measurement. For instance, a measurement with more uncertainty will have a wider distribution. The uncertainty associated with each measurement can be incorporated into analyses, which is key when detecting important differences or changes in individuals or populations, such as changes in body condition (blog).

Figure 4. An example of a posterior predictive distribution for total length of an individual blue whale produced by the ‘Xcertainty’ R package. The black bars represent the uncertainty around the mean value (the black dot) – the longer black bars represent the 95% highest posterior density (HPD) interval, and the shorter black bars represent the 65% HPD interval. 

CODEX has integrated all these lessons learned, open-source tools, and analytical approaches into a single framework of suggested best practices to help researchers enhance the quality, speed, and accuracy of obtaining important morphological measurements to manage vulnerable populations. These tools and frameworks are designed to be accommodating and accessible to researchers on various budgets and to facilitate cross-lab collaborations. CODEX plans to host workshops to educate and train researchers using drones on how to apply these tools within this framework within their own research practices. Potential future directions for CODEX include developing a system for using drones to drop suction-cup tags on whales and to collect thermal imagery of whales for health assessments. Stay up to date with all the CODEX ‘X’travaganza here: https://mmi.oregonstate.edu/centers-excellence/codex.  

Huge shout out to Suzie Winquist for designing the artwork for CODEX!

References

Barlow, D.R., Bierlich, K.C., Oestreich, W.K., Chiang, G., Durban, J.W., Goldbogen, J.A., Johnston, D.W., Leslie, M.S., Moore, M.J., Ryan, J.P. and Torres, L.G., 2023. Shaped by Their Environment: Variation in Blue Whale Morphology across Three Productive Coastal Ecosystems. Integrative Organismal Biology, [online] 5(1). https://doi.org/10.1093/iob/obad039.

Bierlich, K., Karki, S., Bird, C.N., Fern, A. and Torres, L.G., n.d. Automated body length and condition measurements of whales from drone videos for rapid assessment of population health. Marine Mammal Science.

Bierlich, K.C., Hewitt, J., Bird, C.N., Schick, R.S., Friedlaender, A., Torres, L.G., Dale, J., Goldbogen, J., Read, A.J., Calambokidis, J. and Johnston, D.W., 2021a. Comparing Uncertainty Associated With 1-, 2-, and 3D Aerial Photogrammetry-Based Body Condition Measurements of Baleen Whales. Frontiers in Marine Science, 8. https://doi.org/10.3389/fmars.2021.749943.

Bierlich, K.C., Hewitt, J., Schick, R.S., Pallin, L., Dale, J., Friedlaender, A.S., Christiansen, F., Sprogis, K.R., Dawn, A.H., Bird, C.N., Larsen, G.D., Nichols, R., Shero, M.R., Goldbogen, J., Read, A.J. and Johnston, D.W., 2022. Seasonal gain in body condition of foraging humpback whales along the Western Antarctic Peninsula. Frontiers in Marine Science, 9(1036860), pp.1–16. https://doi.org/10.3389/fmars.2022.1036860.

Bierlich, K.C., Schick, R.S., Hewitt, J., Dale, J., Goldbogen, J.A., Friedlaender, A.S. and Johnston, D.W., 2021b. Bayesian approach for predicting photogrammetric uncertainty in morphometric measurements derived from drones. Marine Ecology Progress Series, 673, pp.193–210. https://doi.org/10.3354/meps13814.

Bird, C. and Bierlich, K.C., 2020. CollatriX: A GUI to collate MorphoMetriX outputs. Journal of Open Source Software, 5(51), pp.2323–2328. https://doi.org/10.21105/joss.02328.

Torres, L.G., Bird, C.N., Rodríguez-González, F., Christiansen, F., Bejder, L., Lemos, L., Urban R, J., Swartz, S., Willoughby, A., Hewitt, J. and Bierlich, K.C., 2022. Range-Wide Comparison of Gray Whale Body Condition Reveals Contrasting Sub-Population Health Characteristics and Vulnerability to Environmental Change. Frontiers in Marine Science, 9(April), pp.1–13. https://doi.org/10.3389/fmars.2022.867258.

Torres, W. and Bierlich, K.C., 2020. MorphoMetriX: a photogrammetric measurement GUI for morphometric analysis of megafauna. Journal of Open Source Software, 5(45), pp.1825–1826. https://doi.org/10.21105/joss.01825.

Every breath [a whale] takes: How and why we study cetacean respiration

Clara Bird, PhD Candidate, OSU Department of Fisheries, Wildlife, and Conservation Sciences, Geospatial Ecology of Marine Megafauna Lab

We need energy to function and survive. For animals in the wild who may have limited food availability, knowing how they spend their energy is a critical question for many scientists because it fundamentally informs how we understand their decisions about where they go and what they do. The entire field of foraging theory is founded on the concept that animals optimize their ratio of energy in and energy out so that they have enough energy to survive, reproduce (pass on their genes), watch out for threats, if need be, and rest. And, if we understand an animal’s ‘typical’ energy budget, we can then try to predict how disturbance or environmental change will affect their actual energy budgets as a consequence of that change. But how do we measure energy expenditure?

The most commonly measured energy currency is oxygen. Since our cells use oxygen to produce energy (this is why we need oxygen to live), we can measure oxygen consumption as a metric of energy expenditure. The more oxygen we consume, the more energy we’re expending. In ideal lab settings, oxygen consumption can be accurately measured by placing the subject in a chamber where the oxygen flow can be controlled (Speakman, 1999). However, you can probably see how that approach is problematic for measuring oxygen consumption in most large free-living animals, especially cetaceans. It isn’t exactly feasible to put a whale in a box.

Image 1. A great tit in a metabolic chamber. Figure 1 from Broggi et al., 2009

Fortunately, a tool called a spirometer was developed to measure oxygen consumption in restrained cetaceans. A spirometer is a device that can be placed over the blowhole(s) of an individual to accurately measure the amount of air that is exhaled and inhaled (Figure 1).  For trained cetaceans in captivity (e.g., dolphins), spirometers can be used to quantify how respiration changes after the animal performs certain behaviors (Fahlman et al., 2019). The breathing patterns of diving mammals are particularly interesting because they cannot breathe during most of their exercise (energy expenditure) as they are underwater. So, their breathing patterns after a dive tell us a lot about how much energy they spent during that dive. For example, Fahlman et al. (2019) used spirometer data from dolphins in captivity to study how their breathing patterns changed while recovering from dives of different durations. Interestingly, they found that after longer dives, dolphins took larger breaths (i.e., inhaled more air) while recovering but did not change the number of breaths. This finding is particularly relevant to the work we are conducting in the GEMM lab, where we utilize breathing patterns to quantify the energy expenditure of cetaceans in the wild, where spirometers cannot be used.

Figure 1. Figure 1 from Sumich et al. (2023). Left: a spirometer being held over the blow holes of JJ, a gray whale calf at sea world in 1997; one of the rare times that a large baleen whale was in captivity and available for these measurements. Right: example of a plot created using the data from a spirometer over JJ’s blow holes. The duration of a “blow” (exhale followed by immediate inhale) is on the x-axis, the flow rate (in liters per second) is on the y-axis. The positive curve during the exhale shows that the whale strongly exhales a lot of air very quickly, then the negative curve shows the whale inhaling a lot of air very quickly.

In a previous blog, I described how inter-breath intervals (the time between consecutive blows) are useful for estimating energy expenditure in free-living cetaceans. Essentially, a shorter interval indicates that the whale was just engaged in an energetically demanding activity. When you’re recovering from a sprint, you breathe faster (i.e., with shorter inter-breath intervals), than when you’re recovering from a walk. However, a big assumption in using inter-breath intervals as a proxy for energy expenditure is that every breath is equal. But as Fahlman et al. emphasize in their 2016 paper, every blow is not equal (Fahlman et al., 2016). In addition to varying the time between breaths, an animal can vary the intensity of each breath (e.g., Fahlman et al., 2019), the duration of each breath (Sumich et al., 2023), the number of breaths, and even the expansion of their nostrils (Nazario et al., 2022; check out this blog for more).

Image 2. Gray whale blow. Source: https://www.lajollalight.com/sdljl-natural-la-jolla-winter-wildlife-2015jan08-story.html

Altogether, this means that it’s important to measure every breath and that no one metric tells the complete story. This also means my research question focused on comparing the energetic costs of different tactics is more complicated than I originally thought. If we go back to the first blog I wrote on this topic, I was planning ons only using inter-breath intervals to estimate energy expenditure. Fast forward four years, with all my new knowledge gained on respiration variability, I’ve modified my plan and now I’m working to first understand how all these different metrics of breathing relate to each other. Then, I’ll compare how breathing varies between different foraging tactics, which is an important follow up to my questions around individual specialization of foraging tactics. If different whales are using different foraging behaviors, does that mean they’re spending different amounts of energy? If so, are certain behaviors more advantageous than others? Of course, these answers are incomplete without understanding the prey the whales are eating, but that’s something that PhD student Nat Chazal is working to understand (check out her recent blog here).  For now, I’m working on bringing integrating all the measures of breathing, then we will start putting the story together and finding some answers to our pressing questions. 

Did you enjoy this blog? Want to learn more about marine life, research, and conservation? Subscribe to our blog and get a weekly alert when we make a new post! Just add your name into the subscribe box below!

Loading

References

Broggi, J., Hohtola, E., Koivula, K., Orell, M., & Nilsson, J. (2009). Long‐term repeatability of winter basal metabolic rate and mass in a wild passerine. Functional Ecology23(4), 768–773. https://doi.org/10.1111/j.1365-2435.2009.01561.x

Fahlman, A., Brodsky, M., Miedler, S., Dennison, S., Ivančić, M., Levine, G., Rocho-Levine, J., Manley, M., Rocabert, J., & Borque-Espinosa, A. (2019). Ventilation and gas exchange before and after voluntary static surface breath-holds in clinically healthy bottlenose dolphins, Tursiops truncatus. Journal of Experimental Biology222(5), jeb192211. https://doi.org/10.1242/jeb.192211

Fahlman, A., van der Hoop, J., Moore, M. J., Levine, G., Rocho-Levine, J., & Brodsky, M. (2016). Estimating energetics in cetaceans from respiratory frequency: Why we need to understand physiology. Biology Open,5(4), 436–442. https://doi.org/10.1242/bio.017251

Nazario, E. C., Cade, D. E., Bierlich, K. C., Czapanskiy, M. F., Goldbogen, J. A., Kahane-Rapport, S. R., Hoop, J. M. van der, Luis, M. T. S., & Friedlaender, A. S. (2022). Baleen whale inhalation variability revealed using animal-borne video tags. PeerJ10, e13724. https://doi.org/10.7717/peerj.13724

Speakman, J. R. (1999). The Cost of Living: Field Metabolic Rates of Small Mammals. In A. H. Fitter & D. G. Raffaelli (Eds.), Advances in Ecological Research (Vol. 30, pp. 177–297). Academic Press. https://doi.org/10.1016/S0065-2504(08)60019-7

Sumich, J. L., Albertson, R., Torres, L. G., Bird, C. N., Bierlich, K. C., & Harris, C. (2023). Using audio and UAS-based video for estimating tidal lung volumes of resting and active adult gray whales (Eschrichtius robustus). Marine Mammal Science1(8). https://doi.org/10.1111/mms.13081

How big, how blue, how beautiful! Studying the impacts of climate change on big, (and beautiful) blue whales

Dr. KC Bierlich, Postdoctoral Scholar, OSU Department of Fisheries, Wildlife, & Conservation Sciences, Geospatial Ecology of Marine Megafauna Lab

The SAPPHIRE Project is in full swing, as we spend our days aboard the R/V Star Keys searching for krill and blue whales (Figure 1) in the South Taranaki Bight (STB) region of Aotearoa New Zealand. We are investigating how changing ocean conditions impact krill availability and quality, and how this in turn impacts blue whale behavior, health, and reproduction. Understanding the link between changing environmental conditions on prey species and predators is key to understanding the larger implications of climate change on ocean food webs and each populations’ resiliency. 

Figure 1. The SAPPHIRE team searching for blue whales. Top left) KC Bierlich, top right) Dawn Barlow, bottom left) Dawn Barlow, Kim Bernard (left to right), bottom right) KC Bierlich, Dawn Barlow, Leigh Torres, Mike Ogle (left to right).  

One of the many components of the SAPPHIRE Project is to understand how foraging success of blue whales is influenced by environmental variation (see this recent blog written by Dr. Dawn Barlow introducing each component of the project). When you cannot go to a grocery store or restaurant any time you are hungry, you must rely on stored energy from previous feeds to fuel energy needs. Body condition reflects an individual’s stored energy in the body as a result of feeding and thus represents the foraging success of an individual, which can then affect its potential for reproductive output and the individual’s overall health (see this previous blog). As discussed in a previous blog, drones serve as a valuable tool for obtaining morphological measurements of whales to estimate their body condition. We are using drones to collect aerial imagery of pygmy blue whales to obtain body condition measurements late in the foraging season between years 2024 and 2026 of the SAPPHIRE Project (Figure 2). We are quantifying body condition as Body Area Index (BAI), which is a relative measure standardized by the total length of the whale and well suited for comparing individuals and populations (Figure 3). 

The GEMM Lab recently published an article led by Dr. Dawn Barlow where we investigated the differences in BAI between three blue whale populations: Eastern North Pacific blue whales feeding in Monterey Bay, California; Chilean blue whales feeding in the Corcovado Gulf; and New Zealand Pygmy blue whales feeding in the STB (Barlow et al., 2023). These three populations are interesting to compare since blue whales that feed in Monterey Bay and Corcovado Gulf migrate to and from these seasonally productive feeding grounds, while the Pygmy blue whales stay in Aotearoa New Zealand year-round. Interestingly, the Pygmy blue whales had higher BAI (were fatter) compared to the other two regions despite relatively lower productivity in their foraging grounds. This difference in body condition may be due to different life history strategies where the non-migratory Pygmy blue whales may be able to feed as opportunities arrive, while the migratory strategies of the Eastern North Pacific and Chilean blue whales require good timing to access high abundant prey. Another interesting and unexpected result from our blue whale comparison was that Pygmy blue whales are not so “pygmy”; they are actually the same size as Eastern North Pacific and Chilean blue whales, with an average size around 22 m. Our findings from this blue whale comparison leads us to more questions about how environmental conditions that vary from year to year influence body condition and reproduction of these “not so pygmy” blue whales. 

Figure 2. An aerial image of a Pygmy blue whale in the South Taranaki Bight region of Aotearoa New Zealand collected during the SAPPHIRE 2024 field season using a DJI Inspire 2 drone. 
Figure 3. A drone image of a Pygmy blue whale and the length and body width measurements used to estimate Body Area Index (BAI), represented by the shaded blue region. Width measurements will also be used to help identify pregnant individuals.

The GEMM Lab has been studying this population of Pygmy blue whales in the STB since 2013 and found that years designated as a marine heatwave resulted with a reduction in blue whale feeding activity. Interestingly, breeding activity is also reduced during marine heatwaves in the following season when compared to the breeding season following a more productive, typical foraging season. These findings indicate that fluctuations in the environment, such as marine heatwaves, may affect not only foraging success, but also reproduction in Pygmy blue whales. 

To help us better understand reproductive patterns across years, we will use body width measurements from drone images paired with hormone concentrations collected from fecal and biopsy samples to identify pregnant individuals. Progesterone is a hormone secreted in the ovaries of mammals during the estrous cycle and gestation, making it the predominant hormone responsible for sustaining pregnancy. Recently, the GEMM Lab’s Dr. Alejandro Fernandez-Ajo wrote a blog discussing his publication identifying pregnant individual gray whales using drone-based body width measurements and progesterone concentrations from fecal samples (Fernandez et al., 2023). While individuals that were pregnant had higher levels of progesterone compared to when they were not pregnant, the body width at 50% of the body length served as a more reliable method for detecting pregnancy in gray whales. We will use similar methods to help identify pregnancy in Pygmy blue whales for the SAPPHIRE Project where will we examine body width measurement paired with progesterone concentrations collected from fecal and biopsy samples to identify pregnant individuals. We hope our work will help to better understand how climate change will influence Pygmy blue whale body condition and reproduction, and thus the overall health and resiliency of the population. Stay tuned! 

References

Barlow, D. R., Bierlich, K. C., Oestreich, W. K., Chiang, G., Durban, J. W., Goldbogen, J. A., Johnston, D. W., Leslie, M. S., Moore, M. J., Ryan, J. P., & Torres, L. G. (2023). Shaped by Their Environment: Variation in Blue Whale Morphology across Three Productive Coastal Ecosystems. Integrative Organismal Biology, 5(1). https://doi.org/10.1093/iob/obad039

Fernandez Ajó, A., Pirotta, E., Bierlich, K. C., Hildebrand, L., Bird, C. N., Hunt, K. E., Buck, C. L., New, L., Dillon, D., & Torres, L. G. (2023). Assessment of a non-invasive approach to pregnancy diagnosis in gray whales through drone-based photogrammetry and faecal hormone analysis. Royal Society Open Science10(7), 230452. https://doi.org/10.1098/rsos.230452

A smaller sized gray whale: recent publication finds PCFG whales are smaller than ENP whales

Dr. KC Bierlich, Postdoctoral Scholar, OSU Department of Fisheries, Wildlife, & Conservation Sciences, Geospatial Ecology of Marine Megafauna (GEMM) Lab

A recent blog post by GEMM Lab’s PhD Candidate Clara Bird gave a recap of our 8th consecutive GRANITEfield season this year. In her blog, Clara highlighted that we saw 71 individual gray whales this season, 61 of which we have seen in previous years and identified as belonging to the Pacific Coast Feeding Group (PCFG). With an estimated population size of around 212 individuals, this means that we saw almost 1/3 of the PCFG population this season alone. Since the GEMM Lab first started collecting data on PCFG gray whales in 2016, we have collected drone imagery on over 120 individuals, which is over half the PCFG population. This dataset provides incredible opportunity to get to know these individuals and observe them from year to year as they grow and mature through different life history stages, such as producing a calf. A question our research team has been interested in is what makes a PCFG whale different from an Eastern North Pacific (ENP) gray whale, which has a population size around 16,000 individuals and feed predominantly in the Arctic during the summer months? For this blog, I will highlight findings from our recent publication in Biology Letters (Bierlich et al., 2023) comparing the morphology (body length, skull, and fluke size) between PCFG and ENP populations. 

Body size and shape reflect how an animal functions in their environment and can provide details on an individual’s current health, reproductive status, and energetic requirements. Understanding how animals grow is a key component for monitoring the health of populations and their vulnerability to climate change and other stressors in their environment.  As such, collecting accurate morphological measurements of individuals is essential to model growth and infer their health. Collecting such morphological measurements of whales is challenging, as you cannot ask a whale to hold still while you prepare the tape measure, but as discussed in a previous blog, drones provide a non-invasive method to collect body size measurements of whales. Photogrammetry is a non-invasive technique used to obtain morphological measurements of animals from photographs. The GEMM Lab uses drone-based photogrammetry to obtain morphological measurements of PCFG gray whales, such as their body length, skull length (as snout-to-blowhole), and fluke span (see Figure 1). 

Figure 1. Morphological measurements obtained via photogrammetry of a Pacific Coast Feeding Group (PCFG) gray whale. These measurements were used to compare to individuals from the Eastern North Pacific (ENP) population. 

As mentioned in this previous blog, we use photo-identification to identify unique individual gray whales based on markings on their body. This method is helpful for linking all the data we are collecting (morphology, hormones, behavior, new scarring and skin conditions, etc.) to each individual whale. An individual’s sightings history can also be used to estimate their age, either as a ‘minimum age’ based on the date of first sighting or a ‘known age’ if the individual was seen as a calf. By combining the length measurements from drone-based photogrammetry and age estimates from photo-identification history, we can construct length-at-age growth models to examine how PCFG gray whales grow. While no study has previously examined length-at-age growth models specifically for PCFG gray whales, another study constructed growth curves for ENP gray whales using body length and age estimates obtained from whaling, strandings, and aerial photogrammetry (Agbayani et al., 2020). For our study, we utilized these datasets and compared length-at-age growth, snout-to-blowhole length, and fluke span between PCFG and ENP whales. We used Bayesian statistics to account and incorporate the various levels of uncertainty associated with data collected (i.e., measurements from whaling vs. drone, ‘minimum age’ vs. ‘known age’). 

We found that while both populations grow at similar rates, PCFG gray whales reach smaller adult lengths than ENP. This difference was more extreme for females, where PCFG females were ~1 m (~3 ft) shorter than ENP females and PCFG males were ~0.5 m (1.5 ft) shorter than ENP males (Figure 2, Figure 3). We also found that ENP males and females have slightly larger skulls and flukes than PCFG male and females, respectively. Our results suggest PCFG whales are shaped differently than ENP whales (Figure 3)! These results are also interesting in light of our previous published study that found PCFG whales are skinnier than ENP whales (see this previous blog post). 

Figure 2. Growth curves (von Bertalanffy–Putter) for length-at-age comparing male and female ENP and PCFG gray whales (shading represents 95% highest posterior density intervals). Points represent mean length and median age. Vertical bars represent photogrammetric uncertainty. Dashed horizontal lines represent uncertainty in age estimates.

Figure 3. Schematic highlighting the differences in body size between Pacific Coast Feeding Group (PCFG) and Eastern North Pacific (ENP) gray whales. 

Our results raise some interesting questions regarding why PCFG are smaller: Is this difference in size and shape normal for this population and are they healthy? Or is this difference a sign that they are stressed, unhealthy and/or not getting enough to eat? Larger individuals are typically found at higher latitudes (this pattern is called Bergmann’s Rule), which could explain why ENP whales are larger since they feed in the Arctic. Yet many species, including fish, birds, reptiles, and mammals, have experienced reductions in body size due to changes in habitat and anthropogenic stressors (Gardner et al., 2011). The PCFG range is within closer proximity to major population centers compared to the ENP foraging grounds in the Arctic, which could plausibly cause increased stress levels, leading to decreased growth. 

The smaller morphology of PCFG may also be related to the different foraging tactics they employ on different prey and habitat types than ENP whales. Animal morphology is linked to behavior and habitat (see this blogpost). ENP whales feeding in the Arctic generally forage on benthic amphipods, while PCFG whales switch between benthic, epibenthic and planktonic prey, but mostly target epibenthic mysids. Within the PCFG range, gray whales often forage in rocky kelp beds close to shore in shallow water depths (approx. 10 m) that are on average four times shallower than whales feeding in the Arctic. The prey in the PCFG range is also found to be of equal or higher caloric value than prey in the Arctic range (see this blog), which is interesting since PCFG were found to be skinnier.

It is also unclear when the PCFG formed? ENP and PCFG whales are genetically similar, but photo-identification history reveals that calves born into the PCFG usually return to forage in this PCFG range, suggesting matrilineal site fidelity that contributes to the population structure. PCFG whales were first documented off our Oregon Coast in the 1970s (Figure 4). Though, from examining old whaling records, there may have been PCFG gray whales foraging off the coasts of Northern California to British Columbia since the 1920s.

Figure 4. First reports of summer-resident gray whales along the Oregon coast, likely part of the Pacific Coast Feeding Group. Capital Journal, August 9, 1976, pg. 2.

Altogether, our finding led us to two hypotheses: 1) the PCFG range provides an ecological opportunity for smaller whales to feed on a different prey type in a shallow environment, or 2) the PCFG range is an ecological trap, where individuals gain less energy due to energetically costly feeding behaviors in complex habitat while potentially targeting lower density prey, causing them to be skinnier and have decreased growth. Key questions remain for our research team regarding potential consequences of the smaller sized PCFG whales, such as does the smaller body size equate to reduced resilience to environmental and anthropogenic stressors? Does smaller size effect fecundity and population fitness? Stay tuned as we learn more about this unique and fascinating smaller sized gray whale. 

References

Agbayani, S., Fortune, S. M. E., & Trites, A. W. (2020). Growth and development of North Pacific gray whales (Eschrichtius robustus). Journal of Mammalogy101(3), 742–754. https://doi.org/10.1093/jmammal/gyaa028

Bierlich, K. C., Kane, A., Hildebrand, L., Bird, C. N., Fernandez Ajo, A., Stewart, J. D., Hewitt, J., Hildebrand, I., Sumich, J., & Torres, L. G. (2023). Downsized: gray whales using an alternative foraging ground have smaller morphology. Biology Letters19(8). https://doi.org/10.1098/rsbl.2023.0043

Gardner, J. L., Peters, A., Kearney, M. R., Joseph, L., & Heinsohn, R. (2011). Declining body size: A third universal response to warming? Trends in Ecology and Evolution26(6), 285–291. https://doi.org/10.1016/j.tree.2011.03.005

The whales keep coming and we keep learning: a wrap up of the eighth GRANITE field season.

Clara Bird, PhD Candidate, OSU Department of Fisheries, Wildlife, and Conservation Sciences, Geospatial Ecology of Marine Megafauna Lab

As you may remember, last year’s field season was a remarkable summer for our team. We were pleasantly surprised to find an increased number of whales in our study area compared to previous years and were even more excited that many of them were old friends. As we started this field season, we were all curious to know if this year would be a repeat. And it’s my pleasure to report that this season was even better!

We started the season with an exciting day (6 known whales! see Lisa’s blog) and the excitement (and whales) just kept coming. This season we saw 71 individual whales across 215 sightings! Of those 71, 44 were whales we saw last year, and 10 were new to our catalog, meaning that we saw 17 whales this season that we had not seen in at least two years! There is something extra special about seeing a whale we have not seen in a while because it means that they are still alive, and the sighting gives us valuable data to continue studying health and survival. Another cool note is that 7 of our 12 new whales from last year came back this year, indicating recruitment to our study region.

Included in that group of 7 whales are the two calves from last year! Again, indicating good recruitment of new whales to our study area. We saw both Lunita and Manta (previously nick-named ‘Roly-poly’) throughout this season and we were always happy to see them back in our area and feeding on their own.

Drone image of Lunita from 2023
Drone image of Manta from 2023

We had an especially remarkable encounter with Lunita at the end of this season when we found this whale surface feeding on porcelain crab larvae (video 1)! This is a behavior that we rarely observe, and we’ve never seen a juvenile whale use this behavior before, inspiring questions around how Lunita knew how to perform this behavior.

Not only did we resight our one-year-old friends, but we found two new calves born to well-known mature females (Clouds and Spotlight). We had previously documented Clouds with a calf (Cheetah) in 2016 so it was exciting to see her with a new calf and to meet Cheetah’s sibling! Cheetah has become one of our regulars so we’re curious to see if this new calf joins the regular crew as well. We’re also hoping that Spotlight’s calf will stick around; and we’re optimistic since we observed it feeding alone later in the season.

Collage of new calves from 2023! Left: Clouds and her calf, Center: Spotlight and her calf, Right: Spotlight’s calf independently foraging

Of course, 71 whales means heaps of data! We spent 226 hours on the water, conducted 132 drone flights (a record!), and collected 61 fecal samples! Those 132 flights were over 64 individual whales, with Casper and Pacman tying for “best whale to fly over” with 10 flights each. We collected 61 fecal samples from 26 individual whales with a three-way tie for “best pooper” between Hummingbird, Scarlett, and Zorro with 6 fecal samples each. And we continued to collect valuable prey and habitat data through 80 GoPro drops and 79 zooplankton net tows.

And if you were about to ask, “but what about tagging?!”, fear not! We continued our suction cup tagging effort with a successful window in July where we were joined by collaborators John Calambokidis from Cascadia Research Collective and Dave Cade from Hopkins Marine Station and deployed four suction-cup tags.

It’s hard to believe all the work we’ve accomplished in the past five months, and I continue to be honored and proud to be on this incredible team. But as this season has come to a close, I have found myself reflecting on something else. Learning. Over the past several years we have learned so much about not only these whales in our study system but about how to conduct field work. And while learning is continuous, this season in particular has felt like an exciting time for both. In the past year our group has published work showing that we can detect pregnancy in gray whales using fecal samples and drone imagery (Fernandez Ajó et al., 2023), that PCFG gray whales are shorter and smaller than ENP whales (Bierlich et al., 2023), and that gray whales are consuming high levels of microplastics (Torres et al., 2023). We also have several manuscripts in review focused on our behavior work from drones and tags. While this information does not directly affect our field work, it does mean that while we’re observing these whales live, we better understand what we’re observing and we can come up with more specific, in-depth questions based on this foundation of knowledge that we’re building. I have enjoyed seeing our questions evolve each year based on our increasing knowledge and I know that our collaborative, inquisitive chats on the boat will only continue inspiring more exciting research.

On top of our gray whale knowledge, we have also learned so much about field work. When I think back to the early days compared to now, there is a stark difference in our knowledge and our confidence. We do a lot on our little boat! And so many steps that we once relied on written lists to remember to do are now just engrained in our minds and bodies. From loading the boat, to setting up at the dock, to the go pro drops, fecal collections, drone operations, photo taking, and photo ID, our team has become quite the well-oiled machine. We were also given the opportunity to reflect on everything we’ve learned over the past years when it was our turn to train our new team member, Nat! Nat is a new PhD student in the GEMM lab who is joining team GRANITE. Teaching her all the ins and outs of our fieldwork really emphasized how much we ourselves have learned.

On a personal note, this was my third season as a drone pilot, and honestly, I was pleasantly surprised by my experience this season. Since I started piloting, I have experienced pretty intense nerves every time I’ve flown the drone. From stress dreams, to mild nausea, and an elevated heart rate, flying the drone was something that I didn’t necessarily look forward to. Don’t get me wrong – it’s incredibly valuable data and a privilege to watch the whales from a bird’s eye view in real time. But the responsibility of collecting good data, while keeping the drone and my team members safe was something that I felt viscerally. And while I gained confidence with every flight, the nerves were still as present as ever and I was starting to accept that I would never be totally comfortable as a pilot. Until this season, when the nerves finally cleared, and piloting became as innate as all the other field work components. While there are still some stressful moments, the nerves don’t come roaring back. I have finally gone through enough stressful situations to not be fazed by new ones. And while I am fully aware that this is just how learning works, I write this reflection as a reminder to myself and anyone going through the process of learning any new skill to push through that fear. Remember there can be a disconnect between the time when you know how to do something well, or well-enough, and the time when you feel comfortable doing it. I am just as proud of myself for persevering as I am of the team for collecting so much incredible data. And as I look ahead to my next scary challenge (finishing my PhD!), this is a feeling that I am trying to hold on to. 

Stay tuned for updates from team GRANITE!

Did you enjoy this blog? Want to learn more about marine life, research, and conservation? Subscribe to our blog and get a weekly alert when we make a new post! Just add your name into the subscribe box below!

Loading

References

Bierlich, K. C., Kane, A., Hildebrand, L., Bird, C. N., Fernandez Ajo, A., Stewart, J. D., Hewitt, J., Hildebrand, I., Sumich, J., & Torres, L. G. (2023). Downsized: Gray whales using an alternative foraging ground have smaller morphology. Biology Letters19(8), 20230043. https://doi.org/10.1098/rsbl.2023.0043

Fernandez Ajó, A., Pirotta, E., Bierlich, K. C., Hildebrand, L., Bird, C. N., Hunt, K. E., Buck, C. L., New, L., Dillon, D., & Torres, L. G. (2023). Assessment of a non-invasive approach to pregnancy diagnosis in gray whales through drone-based photogrammetry and faecal hormone analysis. Royal Society Open Science10(7), 230452. https://doi.org/10.1098/rsos.230452

Torres, L. G., Brander, S. M., Parker, J. I., Bloom, E. M., Norman, R., Van Brocklin, J. E., Lasdin, K. S., & Hildebrand, L. (2023). Zoop to poop: Assessment of microparticle loads in gray whale zooplankton prey and fecal matter reveal high daily consumption rates. Frontiers in Marine Science10. https://www.frontiersin.org/articles/10.3389/fmars.2023.1201078

Title: “Blown away”: measuring the blowholes of whales from drones

By Annie Doron, Undergraduate Intern, Oregon State University, GEMM Laboratory  

Hey up! My name is Annie Doron, and I am an undergraduate Environmental Science student from the University of Sheffield (UK) on my study year abroad. One of my main motivations for undertaking this year abroad was to gain experience working in a marine megafauna lab. Whales in particular have always captivated my interest, and I have been lucky enough to observe  humpback whales in Iceland and The Azores, and even encountered one whilst diving in Australia! For the past 10 months, I have had the unique opportunity to work in the GEMM Lab analyzing Pacific Coast Feeding Group (PCFG) gray whales off the Oregon Coast (Figure 1). I must admit, it has been simply wonderful! 

Figure 1. Aerial image of a PCFG gray whale off the Oregon Coast. 

How did I end up getting involved with the GEMM Lab? I was first accepted into Scarlett Arbuckle’s research-based class in fall term 2022, which is centered around partnering with a mentor for a research project. Having explored the various fields of research at HMSC, I contacted Leigh Torres with interest in getting involved in the GEMM Lab and to establish a research project suitable for a totally inexperienced, international, undergraduate student. Thankfully, Leigh forwarded my email to KC Bierlich who offered to be my mentor for the class, and the rest is history! I first began analyzing drone imagery to measure length and body condition of  PCFG gray whales, which provided an opportunity to get involved with the lab and gain experience using the photogrammetry software MorphoMetriX (Torres & Bierlich, 2020) (see KC’s blog), which is used to make morphometric measurements of whales. Viewing drone imagery of whales sparked my interest in how they use their blowholes (otherwise called ‘nares’) to replenish their oxygen stores; this led to us establishing a research project for the class where we tested if we could use MorphoMetriX to measure blowholes from drone imagery.

Extending this project into winter and spring terms (via research credits) has enabled me to continue working with Leigh and KC, as well as to collaborate with Clara Bird and Jim Sumich. Thanks to KC, who has patiently guided me through the ins and outs of working on a research project, I now feel more confident handling and manipulating large datasets, analyzing drone footage (i.e., differentiating between behavioral states, recording breathing sequences, detecting when a whale is exhaling vs inhaling, etc.), and speaking in public (although I still get pretty bad stage fright, but I think that is a typical conundrum undergrads face). Whatsmore, applying  R – a programming language used for statistical analysis and data visualization, which I have been trying to wrap my head around for years – to my own dataset has helped me greatly enhance my skills using it. 

So, what exciting things have we been working on this year? Given that we often cannot simply study a whale from inside a laboratory – due to size-related logistical implications – we must use proxies (i.e., a variable that is representative of an immeasurable variable). Since cetaceans must return to the surface to offload carbon dioxide and replenish their oxygen stores, measuring their breath frequency and magnitude is one way to study a whale’s oxygen consumption, in turn offering insight into its energy expenditure (Williams, 1999). Blowholes are one proxy we can use to study breath magnitude. Blowholes can be utilized in this way by measuring inhalation duration (the amount of time a whale is inhaling, which is based on a calculation developed by Jim Sumich) and blowhole area (the total area of a blowhole) to gauge variations in tidal volume (the amount of air flowing in and out of the lungs).

Measuring inhalation duration and blowhole area is important because a larger blowhole area (i.e., one that is more dilated) and a longer inhalation duration is indicative of higher oxygen intake, which can infer stress. For example, in this population, higher stress levels are associated with increased vessel traffic (Lemos et al., 2022), and skinnier whales have higher stress levels compared to chubby, healthy whales (Lemos, Olsen, et al., 2022). Hence, measuring the variation around blowholes could be utilized to predict challenges whales face from climate change and anthropogenic disturbance, including fishing (Scordino et al., 2017) and whale watching industry threats (Sullivan & Torres, 2018) (see Clara’s blog), as well as to inform effective management strategies. Furthermore, measuring the variables inhalation duration and blowhole area could help to identify whether whales are taking larger breaths associated with certain ‘gross behavior states’, otherwise known as ‘primary states’, which include: travel, forage, rest, social (Torres et al., 2018). This could enable us to assess the energetic costs of different foraging tactics (i.e., head standing, side-swimming, and bubble blasting (Torres et al., 2018), as well as consequences of disturbance events, on an individual and population health perspective. 

Inhalation duration has been explored in the past by using captive animals. For example, there have been studies on heart rate and breathing of bottlenose dolphins in human care facilities (Blawas et al., 2021; Fahlman et al., 2015). Recently, Nazario et al. (2022) was able to measure inhalation duration and blowhole area using suction-cup video tags. Her study led us to consider if it was possible to measure the parameters and variation around respiration by measuring blowhole area and inhalation duration of PCFGs from drone imagery. We employed MorphoMetriX to study the length, width, and area of a blowhole (Figure 2). Preliminary analyses verified that the areas of the left and right blowholes are very similar (Figure 3); this finding saved us a lot of time because from thereon we only measured either the left or right side. Interestingly, we see some variation in blowhole area within and across individuals (Figure 4). This variation changes within individuals based on primary state. For example, the whales “Glacier”, “Nimbus”, and “Rat” show very little variation whilst traveling but a large amount whilst foraging. Comparatively, “Dice” shows little variation whilst foraging and large variation whilst traveling. Whilst considering cross-individual comparisons, we can see that “Sole”, “Rat”, “Nimbus”, “Heart”, “Glacier”, “Dice”, and “Coal” each exhibit relatively large amounts of variation, yet “Mahalo”, “Luna”, “Harry”, “Hummingbird” and “Batman” exhibit very little. One potential reason for some individuals displaying higher levels of variation than others could be higher levels of exposure to disturbance events that we were unable to measure or evaluate in this study.

Figure 2. How we measured the length, width, and area of a blowhole using MorphoMetriX.

Figure 3. Data driven evidence that the left and the right blowhole areas are very similar. 

Figure 4. Variation in blowhole area amongst individual PCFG whales. The hollow circles represent the means, and the color represents the primary state the whale is exhibiting, foraging (purple) vs. traveling (blue), which will be further explored in Clara’s PhD.

Now, we are venturing into June and are at a stage where we (KC, Clara, Jim, Leigh, and I) are preparing to publish a manuscript! What a way to finish such a fantastic year! The transition from a 3-month-long pilot study to a much larger data analysis and eventual preparation for a manuscript has been a monumental learning experience. If anybody had told me a year ago that I would be involved in publishing a body of work – especially one that is so meaningful to me – I would simply not have believed them! We hope this established methodology for measuring blowholes will help other researchers carry out blowhole measurements using drone imagery across different populations and species. Further research is required to explore the differences in inhalation duration and blowhole area between different primary states, specifically across different foraging tactics.

It has been a great privilege working with the GEMM Lab these past months, and I was grateful to be included in their monthly lab meetings, during which members gave updates and we discussed recently published papers. Seeing such an enthusiastic, kind, and empathic group of people working together taught me what working in a supportive lab could look and feel like. In spite of relocating from Corvallis to Bend after my first term, I was happy to be able to continue working remotely for the lab for the remainder of my time (even though I was ~200 miles inland). I thoroughly enjoyed living in Corvallis, highlights of which were scuba diving adventures to the Puget Sound and coastal road trips with friends. The appeal to move arose from Bend’s reputation as an adventure hub – with unlimited opportunities for backcountry ski access – as well as its selection of wildlife ecology courses (with a focus on species specific to central Oregon). I moved into ‘Bunk & Brew’ (Bend’s only hostel, which is more like a big house of friends with occasional hostel guests) on January 1st after returning from spending Christmas with friends in my old home in Banff, Canada. I have since been enjoying this wonderful multifaceted lifestyle; working remotely in the GEMM Lab, attending in-person classes, working part-time at the hostel, as well as skiing volcanoes (Mount Hood, Middle and South Sister (Figure 5) or climbing at Smith Rock during my days off. Inevitably, I do miss the beautiful Oregon coast, and I will always be grateful for this ideal opportunity and hope this year marks the start of my marine megafauna career!

Figure 5. What I get up to when I’m not studying blowholes! (This was taken at 5am on the long approach to Middle and North Sister. North Sister is the peak featured in the backdrop).

References

Blawas, A. M., Nowacek, D. P., Allen, A. S., Rocho-Levine, J., & Fahlman, A. (2021). Respiratory sinus arrhythmia and submersion bradycardia in bottlenose dolphins (Tursiops truncatus). Journal of Experimental Biology, 224(1), jeb234096. https://doi.org/10.1242/jeb.234096

Fahlman, A., Loring, S. H., Levine, G., Rocho-Levine, J., Austin, T., & Brodsky, M. (2015). Lung mechanics and pulmonary function testing in cetaceans. Journal of Experimental Biology, 218(13), 2030–2038. https://doi.org/10.1242/jeb.119149

Lemos, L. S., Haxel, J. H., Olsen, A., Burnett, J. D., Smith, A., Chandler, T. E., Nieukirk, S. L., Larson, S. E., Hunt, K. E., & Torres, L. G. (2022). Effects of vessel traffic and ocean noise on gray whale stress hormones. Scientific Reports, 12(1), 18580. https://doi.org/10.1038/s41598-022-14510-5

Lemos, L. S., Olsen, A., Smith, A., Burnett, J. D., Chandler, T. E., Larson, S., Hunt, K. E., & Torres, L. G. (2022). Stressed and slim or relaxed and chubby? A simultaneous assessment of gray whale body condition and hormone variability. Marine Mammal Science, 38(2), 801–811. https://doi.org/10.1111/mms.12877

Nazario, E. C., Cade, D. E., Bierlich, K. C., Czapanskiy, M. F., Goldbogen, J. A., Kahane-Rapport, S. R., van der Hoop, J. M., San Luis, M. T., & Friedlaender, A. S. (2022). Baleen whale inhalation variability revealed using animal-borne video tags. PeerJ, 10, e13724. https://doi.org/10.7717/peerj.13724

Scordino, J., Carretta, J., Cottrell, P., Greenman, J., Savage, K., & Scordino, J. (2017). Ship Strikes and Entanglements of Gray Whales in the North Pacific Ocean. Cambridge: International Whaling Commission, 1924–2015.

Sullivan, F. A., & Torres, L. G. (2018). Assessment of vessel disturbance to gray whales to inform sustainable ecotourism: Vessel Disturbance to Whales. The Journal of Wildlife Management, 82(5), 896–905. https://doi.org/10.1002/jwmg.21462

Sumich, J. L. (1994). Oxygen extraction in free-swimming gray whale caves. Marine Mammal Science, 10(2), 226–230. https://doi.org/10.1111/j.1748-7692.1994.tb00266.x

Torres, W., & Bierlich, K. (2020). MorphoMetriX: A photogrammetric measurement GUI for morphometric analysis of megafauna. Journal of Open Source Software, 5(45), 1825. https://doi.org/10.21105/joss.01825

Torres, L. G., Nieukirk, S. L., Lemos, L., & Chandler, T. E. (2018). Drone Up! Quantifying Whale Behavior From a New Perspective Improves Observational Capacity. Frontiers in Marine Science, 5, 319. https://doi.org/10.3389/fmars.2018.00319
Williams, T. M. (1999). The evolution of cost efficient swimming in marine mammals: Limits to energetic optimization. Philosophical Transactions of the Royal Society of London. Series B: Biological Sciences, 354(1380), 193–201. https://doi.org/10.1098/rstb.1999.0371

So big, but so small: why the smallest of the largest whales are not smaller

Dr. KC Bierlich, Postdoctoral Scholar, OSU Department of Fisheries, Wildlife, & Conservation Sciences, Geospatial Ecology of Marine Megafauna (GEMM) Lab

Baleen whales are known for their gigantism and encompass a wide range in body sizes extending from blue whales that are the largest animals to live on earth (max length ~30 m) to minke whales (max length ~10 m) that are the smallest of baleen whales (Fig. 1). While all baleen whales are filter feeders, a group called the rorquals use a feeding strategy known as lunge feeding (or intermittent engulfment filtration), which involves engulfing large volumes of prey-laden water at high speeds and then filtering the water out of their mouth using their baleen as a “sieve”. There is positive allometry associated with this feeding technique and body size, meaning that as whales are larger, this feeding strategy becomes more efficient due to increased engulfment of water volume per each lunge feeding event. In other words, a bigger body size equates to a much larger mouthful of food. For example, a minke whale (body length ~7-10 m) will engulf water volume equivalent to ~42% of its body mass, while a blue whale (~21-24 m) engulfs ~135%. Thus, filter feeding enables gigantism through efficient exploitation of large, dense patches of prey. An interesting question then arises: what is the minimum body size at which filter feeding is still efficient? Or in other words, why are the smallest of the baleen whales, minke whales, not smaller? For this blog, I will highlight a study published today in Nature Ecology and Evolution titled “Minke whale feeding rate limitations suggest constraints on the minimum body size for engulfment filtration feeding” led by friend and collaborator of the GEMM Lab Dr. Dave Cade and included myself and other collaborators as co-authors from Stanford University, UC Santa Cruz, Cascadia Research Collective, Duke University, and University of Queensland.

Figure 1. Aerial imagery collected using drones of several baleen whales of various sizes. Each species shown is considered a rorqual whale, except for gray whales. Figure from Segre et al. (2022)

The largest animals of today are marine filter feeders, such as whale sharks, manta rays, and baleen whales, which all share parallel evolutionary histories in which their large body sizes and filter-feeding morphologies are derived from smaller-bodied ancestors that targeted single prey items. Changes in ocean productivity increased the concentrations of smaller prey in the oceans around 5 million years ago, enabling filter feeding as an efficient feeding strategy through capture of abundant aggregations of prey by filtering large volumes of water. It is interesting to note, that within these filter feeding lineages of animals, there are groups of animals that are single-prey foragers with smaller body sizes. For example, the whale shark is the only filter feeder amongst the carpet sharks and the manta ray is much larger than other rays that feed on single prey items. Amongst cetaceans, the smallest single-prey foragers, dolphins (~2-3 m) and porpoises (~1.4-1.9 m), are much smaller than the smallest of the filter feeding cetaceans, minke whales (~7-10 m). These common differences in body sizes and feeding strategies within lineages suggest that there may be minimum body size requirements for this filter feeding strategy to be efficient.

To investigate the limits on minimum body size for filter feeding, our study explored the foraging behavior of Antarctic minke whales, the smallest of the rorqual baleen whales, along the Western Antarctic Peninsula. Our team tagged a total of 23 individuals using non-invasive suction cup tags, like the ones we use for our tagging component in the GEMM Lab’s GRANITE project (see this blog for more details). One of my roles on the project was to obtain aerial imagery of the minke whales using drones to obtain body length measurements (sound familiar?) (Figs. 2-4). Flying drones in Antarctica over minke whales was an amazing experience. The minke whales were often found deep within the bays amongst ice floes and brash ice where they can be very tricky to spot, as they’ll often surface and then quickly disappear, hence their nickname “sneaky minkes”. They also appear “playful” and “athletic” as they are incredibly quick and maneuverable, doing barrel rolls and quick bank turns while they swim. Check out my past blog to read more on accounts of flying over these amazing whales.

Figure 2. Drone image of our team about to place a noninvasive suction cup biologging tag on an Antarctic minke whale. Photo credit: Duke University Marine Robotics and Remote Sensing Lab.
Figure 3. A drone image of a newly tagged and curious Antarctic minke whale approaching our research team. Photo credit: Duke University Marine Robotics and Remote Sensing Lab.
Figure 4. A drone image of a group of Antarctic minke whales swimming through the icy waters along the Antarctic Peninsula. Photo credit: Duke University Marine Robotics and Remote Sensing Lab.

In total, our team collected 437 hours of tag data consisting of day- and night-time foraging behaviors. While the proportion of time spent foraging and the number of lunges per dive (~3-4) was similar between day- and night-time foraging, daytime foraging was much deeper (~72 m) compared to nighttime foraging (~28 m) due to vertical migration of Antarctic krill, their main food source. Overall, nighttime foraging was much more intense than daytime foraging, with an average of 165 lunges per hour during the night compared to 53 lunges per hour during the day. These shallower nighttime dives enabled quicker surface sequences for replenishing oxygen reserves to then return to foraging, whereas the deeper dives during the day required longer surface recovery times before beginning another foraging dive. Thus, nighttime dives are a more efficient and critical component of minke whale foraging.

When it comes to body size, there was no relationship between dive depth and dive duration with body length, except for daytime deep dives, where longer minke whales dove for longer periods than smaller whales. These longer dive times also require longer surface times to replenish oxygen reserves. Longer minke whales can gulp larger amounts of food and thus need longer filtration times to process water from each engulfment. For example, a 9 m minke whale will take 50% longer to filter water through its baleen compared to a 5 m minke whale. In turn, smaller minke whales would need to feed more frequently than larger minke whales in order to maintain efficient foraging. This decreasing efficiency with smaller body size shines light on a broader trend for filter feeders that we refer to in our study as the minimum-size constraint (MSC) hypothesis: “while the maximum size of a filter-feeding body plan will be restricted by physical properties, the minimum size is restricted by the energetic efficiency of filter feeding and the time required to extract sufficient particles from the water” (Cade et al. 2023). When we examined the scaling of maximum feeding rates of minke whales, we found evidence of a minimum size constraint on efficiency at lengths around 5 m. Interestingly, the weaning length of minke whales is reported to be 4.5 – 5.5 m. Before weaning, newborn/yearling minke whales that are smaller than 4.5 ­– 5.5 m have a different foraging strategy where they are dependent on maternal milk. Thus, it is likely that the body size at weaning is influenced by the minimum size at which this specialized foraging technique of lunge feeding becomes efficient.

This study helps inform the evolutionary pathway for filter feeding whales and suggests that efficient filter feeding and gigantism likely co-evolved within the last 5 million years when ocean conditions changed to support larger prey patches suitable for lunge feeding. It is interesting to think about the MSC hypothesis for other baleen whale species that employ alternative filter feeding techniques, such as gray whales that generally use a form of filter feeding called suction feeding. Gray whales are estimated to have a birth length of ~4.6 m (Agbayani et al., 2020), and the body length of newly weaned calves that we have observed along the Oregon Coast from drone imagery seem to be ~8 – 9 m. Perhaps this is the minimum size of when suction feeding becomes efficient for a gray whale? This is something the GEMM Lab hopes to further explore as we continue to collect foraging data from suction cup tags and behavior and body size measurements from drone imagery.

References

Agbayani, S., Fortune, S. M., & Trites, A. W. (2020). Growth and development of North Pacific gray whales (Eschrichtius robustus). Journal of Mammalogy101(3), 742-754.

Cade, D.E., Kahane-Rapport, S.R., Gough, W.T., Bierlich, K.C., Linksy, J.M.J., Johnston, D.W., Goldbogen, J.A., Friedlaender, A.S. (2023). Ultra-high feeding rates of Antarctic minke whales imply a lower limit for body size in engulfment filtration feeders. Nature Ecology and Evolution. https://www.nature.com/articles/s41559-023-01993-2  

Paolo S. Segre, William T. Gough, Edward A. Roualdes, David E. Cade, Max F. Czapanskiy, James Fahlbusch, Shirel R. Kahane-Rapport, William K. Oestreich, Lars Bejder, K. C. Bierlich, Julia A. Burrows, John Calambokidis, Ellen M. Chenoweth, Jacopo di Clemente, John W. Durban, Holly Fearnbach, Frank E. Fish, Ari S. Friedlaender, Peter Hegelund, David W. Johnston, Douglas P. Nowacek, Machiel G. Oudejans, Gwenith S. Penry, Jean Potvin, Malene Simon, Andrew Stanworth, Janice M. Straley, Andrew Szabo, Simone K. A. Videsen, Fleur Visser, Caroline R. Weir, David N. Wiley, Jeremy A. Goldbogen; Scaling of maneuvering performance in baleen whales: larger whales outperform expectations. J Exp Biol 1 March 2022; 225 (5): jeb243224. doi: https://doi.org/10.1242/jeb.243224

How do we study the impact of whale watching?

Clara Bird, PhD Candidate, OSU Department of Fisheries, Wildlife, and Conservation Sciences, Geospatial Ecology of Marine Megafauna Lab

Since its start, the GEMM Lab has been interested in the effect of vessel disturbance on whales. From former student Florence’s masters project to Leila’s PhD work, this research has shown that gray whales on their foraging grounds have a behavioral response to vessel presence (Sullivan & Torres, 2018) and a physiological response to vessel noise (Lemos et al., 2022). Presently, our GRANITE project is continuing to investigate the effect of ambient noise on gray whales, with an emphasis on understanding how these effects might scale up to impact the population as a whole (Image 1).

To date, all this work has been focused on gray whales feeding off the coast of Oregon, but I’m excited to share that this is about to change! In just a few weeks, Leigh and I will be heading south for a pilot study looking at the effects of whale watching vessels on gray whale mom/calf pairs in the nursing lagoons of Baja California, Mexico.

Image 1. Infographic for the GRANITE project. Credit: Carrie Ekeroth

We are collaborating with a Fernanda Urrutia Osorio, a PhD candidate at Scripps Institute of Oceanography, to spend a week conducting fieldwork in one of the nursing lagoons. For this project we will be collecting drone footage of mom/calf pairs in both the presence and absence of whale watching vessels. Our goal is to see if we detect any differences in behavior when there are vessels around versus when there are not. Tourism regulations only allow the whale watching vessels to be on the water during specific hours, so we are hoping to use this regulated pattern of vessel presence and absence as a sort of experiment.

Image 2. A mom and calf pair.  NOAA/NMFS permit #21678.

The lagoons are a crucial place for mom/calf pairs, this is where calves nurse and grow before migration, and nursing is energetically costly for moms. So, it is important to study disturbance responses in this habitat since any change in behavior caused by vessels could affect both the calf’s energy intake and the mom’s energy expenditure. While this hasn’t yet been investigated for gray whales in the lagoons, similar studies have been carried out on other species in their nursing grounds.

Video 1. Footage of “likely nursing” behavior. NOAA/NMFS permit #21678.

We can use these past studies as blueprints for both data collection and processing. Disturbance studies such as these look for a wide variety of behavioral responses. These include (1) changes in activity budgets, meaning a change in the proportion of time spent in a behavior state, (2) changes in respiration rate, which would reflect a change in energy expenditure, (3) changes in path, which would indicate avoidance, (4) changes in inter-individual distance, and (5) changes in vocalizations. While it’s not necessarily possible to record all of these responses, a meta-analysis of research on the impact of whale watching vessels found that the most common responses were increases in the proportion of time spent travelling (a change in activity budget) and increased deviation in path, indicating an avoidance response (Senigaglia et al., 2016).

One of the key phrases in all these possible behavioral responses is “change in ___”. Without control data collected in the absence of whale watching vessels, it impossible to detect a difference. Some studies have conducted controlled exposures, using approaches with the research vessel as proxies for the whale watchers (Arranz et al., 2021; Sprogis et al., 2020), while others use the whale watching operators’ daily schedule and plan their data collection schedule around that (Sprogis et al., 2023). Just as ours will, all these studies collected data using drones to record whale behavior and made sure to collect footage before, during, and after exposure to the vessel(s).

One study focused on humpback mom/calf pairs found a decrease in the proportion of time spent resting and an increase in both respiration rate and swim speed during the exposure (Sprogis et al., 2020). Similarly, a study focused on short-finned pilot whale mom/calf pairs found a decrease in the mom’s resting time and the calf’s nursing time (Arranz et al., 2021). And, Sprogis et al.’s  study of Southern right whales found a decrease in resting behavior after the exposure, suggesting that the vessels’ affect lasted past their departure (Sprogis et al., 2023, Image 3). It is interesting that while these studies found changes in different response metrics, a common trend is that all these changes suggest an increase in energy expenditure caused by the disturbance.

However, it is important to note that these studies focused on short term responses. Long term impacts have not been thoroughly estimated yet. These studies provide many valuable insights, not only into the response of whales to whale watching, but also a look at the various methods used. As we prepare for our fieldwork, it’s useful to learn how other researchers have approached similar projects.

Image 3. Visual ethogram from Sprogis et al. 2023. This shows all the behaviors they identified from the footage.

I want to note that I don’t write this blog intending to condemn whale watching. I fully appreciate that offering the opportunity to view and interact with these incredible creatures is valuable. After all, it is one of the best parts of my job. But hopefully these disturbance studies can inform better regulations, such as minimum approach distances or maximum engine noise levels.

As these studies have done, our first step will be to establish an ethogram of behaviors (our list of defined behaviors that we will identify in the footage) using our pilot data. We can also record respiration and track line data. An additional response that I’m excited to add is the distance between the mom and her calf. Former GEMM Lab NSF REU intern Celest will be rejoining us to process the footage using the AI method she developed last summer (Image 4). As described in her blog, this method tracks a mom and calf pair across the video frames, and allows us to extract the distance between them. We look forward to adding this metric to the list and seeing what we can glean from the results.

Image 4. Example of a labelled frame from SLEAP, highlighting labels: rostrum, blowhole, dorsal, dorsal-knuckle, and tail. This labels are drawn to train the software to recognize the whales in unlabelled frames.

While we are just getting started, I am excited to see what we can learn about these whales and how best to study them. Stay tuned for updates from Baja!

Did you enjoy this blog? Want to learn more about marine life, research, and conservation? Subscribe to our blog and get a weekly alert when we make a new post! Just add your name into the subscribe box below!

Loading

References

Arranz, P., Glarou, M., & Sprogis, K. R. (2021). Decreased resting and nursing in short-finned pilot whales when exposed to louder petrol engine noise of a hybrid whale-watch vessel. Scientific Reports, 11(1), 21195. https://doi.org/10.1038/s41598-021-00487-0

Lemos, L. S., Haxel, J. H., Olsen, A., Burnett, J. D., Smith, A., Chandler, T. E., Nieukirk, S. L., Larson, S. E., Hunt, K. E., & Torres, L. G. (2022). Effects of vessel traffic and ocean noise on gray whale stress hormones. Scientific Reports, 12(1), Article 1. https://doi.org/10.1038/s41598-022-14510-5

Senigaglia, V., Christiansen, F., Bejder, L., Gendron, D., Lundquist, D., Noren, D., Schaffar, A., Smith, J., Williams, R., Martinez, E., Stockin, K., & Lusseau, D. (2016). Meta-analyses of whale-watching impact studies: Comparisons of cetacean responses to disturbance. Marine Ecology Progress Series, 542, 251–263. https://doi.org/10.3354/meps11497

Sprogis, K. R., Holman, D., Arranz, P., & Christiansen, F. (2023). Effects of whale-watching activities on southern right whales in Encounter Bay, South Australia. Marine Policy, 150, 105525. https://doi.org/10.1016/j.marpol.2023.105525

Sprogis, K. R., Videsen, S., & Madsen, P. T. (2020). Vessel noise levels drive behavioural responses of humpback whales with implications for whale-watching. ELife, 9, e56760. https://doi.org/10.7554/eLife.56760

Sullivan, F. A., & Torres, L. G. (2018). Assessment of vessel disturbance to gray whales to inform sustainable ecotourism. Journal of Wildlife Management, 82(5), 896–905. https://doi.org/10.1002/jwmg.21462

How fat do baleen whales get? Recent publication shows how humpback whales increase their body condition over the foraging season. 

Dr. KC Bierlich, Postdoctoral Scholar, OSU Department of Fisheries, Wildlife, & Conservation Sciences, Geospatial Ecology of Marine Megafauna (GEMM) Lab

Traveling across oceans takes a lot of energy. Most baleen whales use stored energy acquired on their summer foraging grounds to support the costs of migration to and reproduction on their winter breeding grounds. Since little, if any, feeding takes place during the migration and winter season, it is essential that baleen whales obtain enough food to increase their fat reserves to support reproduction. As such, baleen whales are voracious feeders, and they typically depart the foraging grounds much fatter than when they had arrived. 

So, how fat do baleen whales typically get by the end of the foraging season, and how does this differ across reproductive classes, such as a juvenile female vs. a pregnant female? Understanding these questions is key for identifying what a typical “healthy” whale looks like, information which can then help scientists and managers monitor potential impacts from environmental and anthropogenic stressors. In this blog, I will discuss a recent publication in Frontiers in Marine Science (https://doi.org/10.3389/fmars.2022.1036860) that is from my PhD dissertation with the Duke University Marine Robotics and Remote Sensing (MaRRS) Lab, and also includes GEMM lab members Allison Dawn and Clara Bird. In this study, we analyzed how humpback whales (Megaptera novaeangliae) along the Western Antarctic Peninsula (WAP) increase their fat reserves throughout the austral summer foraging season (Bierlich et al., 2022). This work also helps provide insight to the GEMM Lab’s GRANITE project (Gray whale Response to Ambient Noise Informed by Technology and Ecology), where we are interested in how Pacific Coast Feeding Group (PCFG) gray whales increase their energy reserves in response to environmental variability and increasing human activities. 

Eastern South Pacific humpback whales, identified as Stock G by the International Whaling Commission, travel over 16,000 km between summer foraging grounds along the WAP and winter breeding grounds between Ecuador and Costa Rica (Fig. 1). Like most baleen whales, Stock G humpback whales were heavily exploited by 20th century commercial whaling. Recent evidence suggests that this population is recovering, with an estimated increase in population size of ~7,000 individuals in 2000 to ~19,107 in 2020 (Johannessen et al., 2022). 

However, there are long-term concerns for this population. The WAP is one of the fastest warming regions on the planet, and regional populations of krill, an important food source for humpback whales, have declined steeply over the past half-century. Additionally, the WAP has seen a rapid expansion of human activities, such as tourism and krill fishing. Specifically, the WAP has experienced an increase in tourism from a total of 6,700 visitors from 59 voyages in 1990 to 73,000 visitors from 408 voyages in 2020, which may be causing increased stress levels amongst Stock G (Pallin et al., 2022). Furthermore, the krill fishery has increased harvest activities in key foraging areas for humpback whales (Reisinger et al., 2022). Understanding how humpback whales increase their energy reserves over the course of the foraging season can help researchers establish a baseline to monitor future impacts from climate change and human activities. This work also provides an opportunity for comparisons to other baleen whale populations that are also exposed to multiple stressors, such as the PCFG gray whales off the Newport Coast who are constantly exposed to vessel traffic and at risk of entanglement from fishing gear. 

Figure 1. The migration route of the Stock G humpback whale population. Figure adapted from Whales of the Antarctic Peninsula Report, WWF 2018.

To understand how humpback whales increase their energy reserves throughout the foraging season, we collected drone imagery of whales along the WAP between November and June, 2017-2019 (Fig. 2). We used these images to measure the length and width of the whale to estimate body condition, which represents an animal’s relative energy reserve and can reflect foraging success (see previous blog). We collected drone imagery from a combination of research stations (Palmer Station), research vessels (Laurence M. Gould), and tour ships (One Ocean Expeditions). We used several different drones types and accounted for measurement uncertainty associated with the camera, focal length lens, altitude, and altimeter (barometer/LiDAR) from each drone (see previous blog and Bierlich et al., 2021a, 2021b). We also took biopsy samples to identify the sex of each individual and to determine if females were pregnant or not. 

Figure 2. Two humpbacks gracefully swimming in the chilly water along the Western Antarctic Peninsula. Photo taken by KC Bierlich & the Duke University Marine Robotics and Remote Sensing (MaRRS) Lab.

Our final dataset included body condition measurements for 228 total individuals. We found that body condition increased linearly between November and June for each reproductive class, which included calves, juvenile females, juvenile whales of unknown sex, lactating females, mature whales of unknown sex, and non-pregnant females (Fig. 3). This was an interesting finding because a recent publication analyzing tagged whales from the same population found that humpback whales have high foraging rates in early season that then significantly decrease by February and March (Nichols et al., 2022). So, despite these reduced foraging rates throughout the season, humpback whales continue to gain substantial mass into the late season. This continued increase in body condition implies a change in krill abundance and/or quality into the late season, which may compensate for the lower feeding rates. For example, krill density and biomass increases by over an order of magnitude across the season (Reiss et al., 2017) and their lipid content increases by ~4x (Hagen et al., 1996). Thus, humpback whales likely compensate for their lower feeding rates by feeding on denser and higher quality krill, ultimately increasing their efficiency in energy deposition. 

Figure 3. Body condition, here measured as Body Area Index (BAI), increases linearly for each reproductive class across the austral summer foraging season (Nov – June) for humpback whales along the Western Antarctic Peninsula. The shading represents the uncertainty around the estimated relationship. The colors represent the month of data collection.

We found that body condition increase varied amongst reproductive classes. For example, lactating females had the poorest measures of body condition across the season, reflecting the high energetic demands of nursing their calves (Fig. 3). Conversely, non-pregnant females had the highest body condition at the start of the season compared to all the other classes, likely reflecting the energy saved and recovered by skipping breeding that year.  Calves, juvenile whales, and mature whales all reached similar levels of body condition by the end of the season, though mature whales will likely invest most of their energy stores toward reproduction, whereas calves and juveniles likely invest toward growth. We also found a positive relationship between the total length of lactating females and their calves, suggesting that bigger moms have bigger calves (Fig. 4). A similar trend has also been observed in other baleen whale species including southern and North Atlantic right whales (Christiansen et al., 2018; Stewart et al., 2022).

Figure 4. Big mothers have big calves. Total length (TL) measurement between mother-calf pairs. The bars around each point represents the uncertainty (95% highest posterior density intervals). The colors represent the month of data collection. The blue line represents the best fit from a Deming regression, which incorporate measurement uncertainty in both the independent (mother’s TL) and dependent variable (calf’s TL).

The results from the humpback study provide insight for my current work exploring how PCFG gray whales increase their energy reserves in relation to environmental variability and increasing human activities. Over the past seven years, the GEMM Lab has been collecting drone images of PCFG gray whales off the coast of Oregon to measure their body condition (see this GRANITE Project blog). Many of the individuals we encounter are seen across years and throughout the foraging season, providing an opportunity to evaluate how an individual’s body condition is influenced by environmental variation, stress levels, maturity, and reproduction. For example, we had nine total body condition measurements of a female PCFG whale named “Sole”, who had a curvilinear increase in body condition throughout the summer foraging season – a rapid increase in early season that slowed as the season progressed (Fig. 5). This raises many questions for us: is this how most PCFG whales typically increase their body condition during the summer? Is this increase different for pregnant or lactating females? How is this increase impacted by environmental variability or anthropogenic stressors? Repeated measurements of individuals, in addition to Sole, in different reproductive classes across different years will help us determine what body condition is considered a healthy range for gray whales. This is particularly important for monitoring any potential health consequences from anthropogenic stressors, such as vessel noise and traffic (see recent blog by GEMM Lab alum Leila Lemos). We are currently analyzing body condition measurements between 2016 – 2022, so stay tuned for upcoming results!

Figure 6. Body condition, here measured as Body Area Index (BAI), increases curvilinearly for “Sole”, a mature female Pacific Coat Feeding Group gray whale, imaged nine times along the Oregon coast in 2021. The colors represent the month of data collection. 

References

Bierlich, K. C., Hewitt, J., Bird, C. N., Schick, R. S., Friedlaender, A., Torres, L. G., et al. (2021a). Comparing Uncertainty Associated With 1-, 2-, and 3D Aerial Photogrammetry-Based Body Condition Measurements of Baleen Whales. Front. Mar. Sci. 8, 1–16. doi:10.3389/fmars.2021.749943.

Bierlich, K. C., Hewitt, J., Schick, R. S., Pallin, L., Dale, J., Friedlaender, A. S., et al. (2022). Seasonal gain in body condition of foraging humpback whales along the Western Antarctic Peninsula. Front. Mar. Sci. 9, 1–16. doi:10.3389/fmars.2022.1036860.

Bierlich, K., Schick, R., Hewitt, J., Dale, J., Goldbogen, J., Friedlaender, A., et al. (2021b). Bayesian approach for predicting photogrammetric uncertainty in morphometric measurements derived from drones. Mar. Ecol. Prog. Ser. 673, 193–210. doi:10.3354/meps13814.

Christiansen, F., Vivier, F., Charlton, C., Ward, R., Amerson, A., Burnell, S., et al. (2018). Maternal body size and condition determine calf growth rates in southern right whales. Mar. Ecol. Prog. Ser. 592, 267–281.

Hagen, W., Van Vleet, E. S., and Kattner, G. (1996). Seasonal lipid storage as overwintering strategy of Antarctic krill. Mar. Ecol. Prog. Ser. 134, 85–89. doi:10.3354/meps134085.

Johannessen, J. E. D., Biuw, M., Lindstrøm, U., Ollus, V. M. S., Martín López, L. M., Gkikopoulou, K. C., et al. (2022). Intra-season variations in distribution and abundance of humpback whales in the West Antarctic Peninsula using cruise vessels as opportunistic platforms. Ecol. Evol. 12, 1–13. doi:10.1002/ece3.8571.

Nichols, R., Cade, D. E., Kahane-Rapport, S., Goldbogen, J., Simpert, A., Nowacek, D., et al. (2022). Intra-seasonal variation in feeding rates and diel foraging behavior in a seasonally fasting mammal, the humpback whale. Open Sci. 9, 211674.

Pallin, L. J., Botero-Acosta, N., Steel, D., Baker, C. S., Casey, C., Costa, D. P., et al. (2022). Variation in blubber cortisol levels in a recovering humpback whale population inhabiting a rapidly changing environment. Sci. Rep. 12, 1–13. doi:10.1038/s41598-022-24704-6.

Reisinger, R., Trathan, P. N., Johnson, C. M., Joyce, T. W., Durban, J. W., Pitman, R. L., et al. (2022). Spatiotemporal overlap of baleen whales and krill fisheries in the Antarctic Peninsula region. Front. Mar. Sci. doi:doi: 10.3389/fmars.2022.914726.

Reiss, C. S., Cossio, A., Santora, J. A., Dietrich, K. S., Murray, A., Greg Mitchell, B., et al. (2017). Overwinter habitat selection by Antarctic krill under varying sea-ice conditions: Implications for top predators and fishery management. Mar. Ecol. Prog. Ser. 568, 1–16. doi:10.3354/meps12099.

Stewart, J. D., Durban, J. W., Europe, H., Fearnbach, H., Hamilton, P. K., Knowlton, A. R., et al. (2022). Larger females have more calves : influence of maternal body length on fecundity in North Atlantic right whales. Mar. Ecol. Prog. Ser. 689, 179–189. doi:10.3354/meps14040.

Do you lose SLEAP over video analysis of gray whale behavior? Not us in the GEMM Lab! 

Celest Sorrentino, University of California, Santa Barbara, Department of Ecological, Evolution, and Marine Biology, GEMM Lab NSF REU intern

Are you thinking “Did anyone proofread this blog beforehand? Don’t they know how to spell SLEEP?”  I completely understand this concern, but not to fear: the spelling of SLEAP is intentional! We’ll address that clickbait in just a moment. 

My name is Celest Sorrentino, a first-generation Latina undergrad who leaped at the opportunity to depart from the beaches of Santa Barbara, California to misty Newport, Oregon to learn and grow as a scientist under the influential guidance of Clara Bird, Dr. Leigh Torres and the powerhouse otherwise known as the GEMM lab. As a recent NSF REU (Research Experience for Undergraduates) intern in the GEMM Lab at Oregon State University, I am thrilled to have the chance to finally let you in on the project Clara, Leigh and I have been working on all summer. Ready for this?

Our project uses a deep-learning platform called SLEAP A.I. ( https://sleap.ai/) that can predict and track multiple animals in video to track gray whale mother calf pairs in drone footage. We also took this project a step further and explored how the distance between a gray whale mother and her calf, a proxy for calf independence, varied throughout the season and by different calf characteristics. 

In this story, we’ve got a little bit for everyone: the dynamic duo of computer vision and machine learning for my data scientist friends, and ecological inquest for my cetacean researcher friends. 

About the Author

Before we begin, I’d like to share that I am not a data scientist. I’ve only ever taken one coding class. I also do not have years of gray whale expertise under my belt (not yet at least!). I’m entering my 5th year at University of California, Santa Barbara as a double major in Ecology and Evolution (BS) as well as Italian Studies (BA). I am sharing this information to convey the feasibility of learning how to use machine-learning as a solution to streamline the laborious task of video analysis, which would permit more time towards answering your own ecological question, as we did here.

Essential Background

Hundreds of Hours of Drone footage

Since 2016, the GEMM Lab has been collecting drone footage of gray whales off the Oregon Coast to observe gray whale behavior in more detail (Torres et al. 2018). Drones have been shown to increase observational time of gray whales by a three-fold (Torres et al. 2018), including the opportunity to revisit the video with fresh eyes at any time one pleases. The GEMM Lab has flow over 500 flights in the past 6 years, including limited footage of gray whale mother-calf pairs. Little is known about gray whale mother-calf dynamics and even less about factors that influence calf development. As we cannot interview hundreds of gray-whale mother-calf pairs to develop a baseline for this information, we explore potential proxies for calf development instead (similar to how developmental benchmarks are used for human growth). 

Distance and Development

During our own life journey, each of us became less and less dependent on our parents to survive on our own. Formulating our first words so that we can talk for ourselves, cracking an egg for our parents so that we can one day cook for ourselves, or even letting go of their hand when crossing the street. For humans, we spend many years with our kin preparing for these moments, but gray whale mother-calf pairs only have a few months after birth until they separate. Gray whale calves are born on their wintering grounds in Baja California, Mexico (around February), migrate north with their mothers to the foraging grounds, and are then weaned during the foraging season (we think around August). This short time with their mother means that they have to become independent pretty quickly (about 6 months!).

Distance between mother and calf can be considered a measure of independence because we would expect increased distance between the pair as calf independence increases. In a study by Nielson et al (2019), distance between Southern Right Whale mother-calf pairs was found to increase as the calf grew, indicating that it can serve as a good proxy for independence. The moment a mother-calf pair separates has not been documented, but the GEMM lab has footage of calves during the foraging season pre-weaning that can be used to investigate this process.  However, video analysis is no easy feat: video analysis can range from post-processing, diligent evaluation, and video documentation (Torres et al. 2018). Although the use of UAS has become a popular method for many researchers, the extensive time required for video analysis is a limitation. As mentioned in Clara’s blog, the choice to pursue different avenues to streamline this process, such as automation through machine learning, is highly dependent on the purpose and the kind of questions a project intends to answer.

SLEAP A.I.

 In a world where modern technology is constantly evolving to cater towards making everyday tasks easier, machine learning leads the charge with its ability for a machine to perform human tasks. Deep learning is a subset of machine learning in which the model learns and adapts the ability to perform a task given a dataset. SLEAP (Social LEAP Estimation of Animal Poses) A.I. is an open-source deep-learning framework created to be able to track multiple subjects, specifically animals, throughout a variety of environmental conditions and social dynamics. In previous cases, SLEAP has tracked animals with distinct morphologies and conditions such as mice interactions, fruit flies engaging in courtship, and bee behavior in a petri dish (Pereira 2020). While these studies show that SLEAP could help make video analysis more efficient, these experiments were all conducted on small animals and in controlled environments. However, large megafauna, such as gray whales, cannot be cultivated and observed in a controlled Petri dish. Could SLEAP learn and adapt to predict and track gray whales in an uncontrolled environment, where conditions are never the same (ocean visibility, sunlight, obstructions)? 

Methods

In order to establish a model within SLEAP, we split our mother-calf drone video dataset into training (n=9) and unseen/testing (n=3) videos. Training involves teaching the model to recognize gray whales, and necessitated me to label every four frames using the following labels (anatomical features): rostrum, blowhole, dorsal, dorsal-knuckle, and tail (Fig. 1). Once SLEAP was trained and able to successfully detect gray whales, we ran the model on unseen video. The purpose of using unseen video was to evaluate whether the model could adapt and perform on video it had never seen before, eliminating the need for a labeler to retrain it. 

We then extracted the pixel coordinates for the mom and calf, calculated the distance between their respective dorsal knuckles, and converted the distance to meters using photogrammetry (see KC’s blog  for a great explanation of these methods).  The distance between each pair was then summarized on a daily scale as the average distance and the standard deviation. Standard deviation was explored to understand how variable the distance between mother-calf pair was throughout the day. We then looked at how distance and the standard deviation of distance varied by day of year, calf Total Length (TL), and calf Body Area Index (BAI; a measure of body condition). We hypothesized that these three metrics may be drivers of calf independence (i.e., as the calf gets longer or fatter it becomes more independent from its mother).  

Fig 1. Example of a labelled frame from SLEAP, highlighting labels: rostrum, blowhole, dorsal, dorsal-knuckle, and tail. 

Results

SLEAP A.I. was able to successfully detect and track gray whale mother-calf pairs across all videos (that’s a total of 1318 frames!). When evaluating how the average distance changed across Day of Year, calf Total length, and calf BAI, the plots did not demonstrate the positive relationship we anticipated (Fig 2A). However, when evaluating the standard deviation of distance across Day of Year, calf Total Length, and calf BAI, we did notice that there does appear to be an increase in variability of distance with an increase in Day of Year and calf Total length (Fig 2B)

Fig 2A: Relationship between average distance(m) between each mother and calf (colors represent different named calves) relative to Day of Year, Total length of calf, and BAI of calf. 
Fig 2B: Relationship between standard deviation of  distance(m) between each mother and calf (colors represent different named calves) relative to Day of Year, Total length of calf, and BAI of calf.

Concluding thoughts

These results are monumental! We demonstrated the feasibility to use AI to create a model that can track gray whale pairs in drone footage, which is a fantastic tool that can be applied to updated datasets in the future. As more footage of gray whale mother-calf pairs are collected, this video can be quickly uploaded to SLEAP for model evaluation, predictions can be exported, and results subsequently included in the distance analysis to update our plots and increase our understanding. Our data currently provide a preliminary understanding of how the distance between mother-calf pairs changes with Day of Year, Total length, and BAI, but we are now able to continue updating our dataset as we collect more drone footage. 

I suppose you can say I did mislead you a bit with my title, as I have lost some SLEEP recently. But, not over video analysis per say but rather in the form of inspiration. Inspiration toward expanding my understanding of machine learning so that it can be applied toward answering pressing ecological questions. This project has only propelled me to dig my heels in and investigate further the potential of machine learning to analyze dense datasets for huge knowledge gains.

Fig 3A: Snapshot of Celest working in SLEAP GUI.

Acknowledgements

This project was made possible in partnership by the continuous support by Clara Bird, Dr. Leigh Torres, KC Bierlich, and the entire GEMM Lab!

References

Nielsen, M., Sprogis, K., Bejder, L., Madsen, P., & Christiansen, F. (2019). Behavioural development in southern right whale calves. Marine Ecology Progress Series629, 219–234. https://doi.org/10.3354/meps13125

Pereira, Talmo D., Nathaniel Tabris, Junyu Li, Shruthi Ravindranath, Eleni S. Papadoyannis, Z. Yan Wang, David M. Turner, et al. “SLEAP: Multi-Animal Pose Tracking.” Preprint. Animal Behavior and Cognition, September 2, 2020. https://doi.org/10.1101/2020.08.31.276246.

Torres, Nieukirk, S. L., Lemos, L., & Chandler, T. E. (2018). Drone Up! Quantifying Whale Behavior From a New Perspective Improves Observational Capacity. Frontiers in Marine Science, 5. https://doi.org/10.3389/fmars.2018.00319