Dolphin Diets: Common bottlenose dolphin prey preferences off California

By: Alexa Kownacki, Ph.D. Student, OSU Department of Fisheries and Wildlife, Geospatial Ecology of Marine Megafauna Lab 

Humans are fascinated by food. We want to know its source, its nutrient content, when it was harvested and by whom, and so much more. Since childhood, I was the nagging child who interrogated wait staff about the seafood menu because I cared about the sustainability aspect as well as consuming ethically-sourced seafood. Decades later I still do the same: ask a myriad of questions from restaurants and stores in order to eat as sustainably as possible. But in addition to asking these questions about my food, I also question what my study species eats and why. My study populations, common bottlenose dolphins, are described as top opportunistic predators (Norris and Prescott 1961, Shane et al. 1986, Barros and Odell 1990). In my study area off of California, this species exists in two ecotypes. The coastal ecotype off of California, USA are generalist predators, feeding on many different species of fish using different foraging techniques (Ballance 1992, Shane 1990). The offshore ecotype, on the other hand, is less well-studied, but is frequently observed in association with sperm whales, although the reason is still unknown (Díaz-Gamboa et al. 2018). Stable isotope analysis from skin samples from the two ecotypes indicates that the ecotypes exhibit different foraging strategies based on different isotopic carbon and nitrogen levels (Díaz-Gamboa et al. 2018).

Growing up, I kept the Monterey Bay Aquarium’s Seafood Watch Guide with me to choose the most sustainably-sourced seafood at restaurants. Today there is an easy-to-use application for mobile phones that replaced the paper guide. (Image Source: https://www.seafoodwatch.org/)

Preliminary and historical data on common bottlenose dolphins (Tursiops truncatus) suggest that the coastal ecotype spend more time near estuary mouths than offshore dolphins (Ballance 1992, Kownacki et al. unpublished data). Estuaries contain large concentrations of nutrients from runoff, which support zooplankton and fishes. It is for this reason that these estuaries are thought to be hotspots for bottlenose dolphin foraging. Some scientists hypothesize that these dolphins are estuarine-based prey specialists (Barros and Odell 1990), or that the dolphins simply aggregate in estuaries due to higher prey abundance (Ballance 1992).

Coastal bottlenose dolphins traveling near an estuary mouth in San Diego, CA. (Photographed under NOAA NMFS Permit # 19091).

In an effort to understand diet compositions of bottlenose dolphins, during coastal surveys seabirds were recorded in association with feeding groups of dolphins. Therefore, it is reasonable to believe that dolphins were feeding on the same fishes as Brown pelicans, blue-footed and brown boobies, double-crested cormorants, and magnificent frigatebirds, seeing as they were the most common species associated with bottlenose dolphin feeding groups (Ballance 1992). A shore-based study by Hanson and Defran (1993) found that coastal dolphins fed more often in the early morning and late afternoon, as well as during periods of high tide current. These patterns may have to do with the temporal and spatial distribution of prey fish species. From the few diet studies conducted on these bottlenose dolphins in this area, 75% of the prey were species from the families Ebiotocidae (surf perches) and Sciaendae (croakers) (Norris and Prescott 1961, Walker 1981). These studies, in addition to optimal foraging models, suggest this coastal ecotype may not be as much of a generalist as originally suggested (Defran et al. 1999).
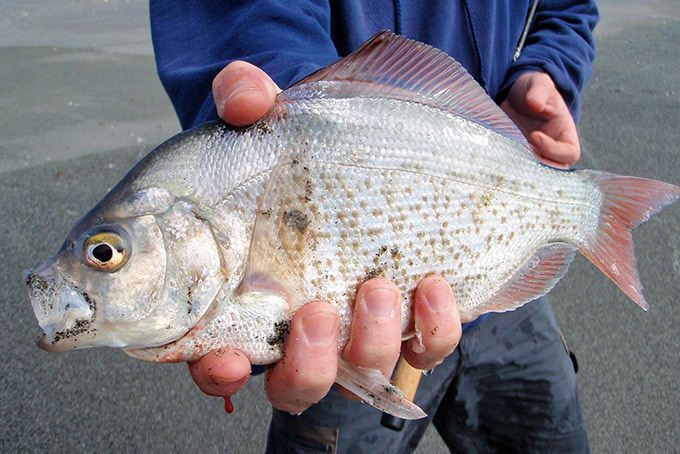
A redtail surfperch caught by a fisherman from a beach in San Diego, CA. These fish are thought to be common prey of coastal bottlenose dolphins. (Image Source: FishwithJD)

Diet studies on the offshore ecotype of bottlenose dolphins worldwide show a preference for cephalopods, similar to other toothed cetaceans who occupy similar regions, such as Risso’s dolphin, sperm whales, and pilot whales (Clarke 1986, Cockcroft and Ross 1990, Gonzalez et al. 1994, Barros et al. 2000, Walker et al. 1999). Because these animals seldom strand on accessible beaches, stomach contents analyses are limited to few studies and isotope analysis is more widely available from biopsies. We know these dolphins are sighted in deeper waters than the habitat of coastal dolphins where there are fewer nutrient plumes, so it is reasonable to hypothesize that the offshore ecotype consumes different species and may be more specialized than the coastal ecotype.
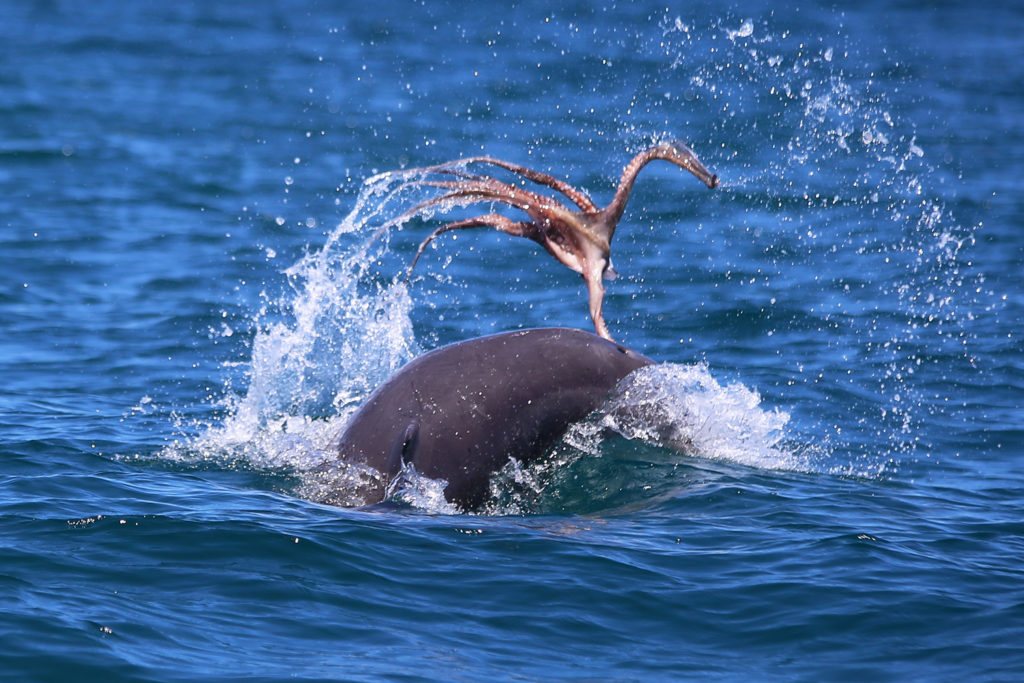
An bottlenose dolphin forages on an octopus. (Image source: Mandurah Cruises)

For a species that is so often observed from shore and boats, and is known for its charisma, it may be surprising that the diets of both the coastal and offshore bottlenose dolphins are still largely unknown. Such is the challenge of studying animals that live and feed underwater. I wish I could simply ask a dolphin, much like I would ask staff at restaurants: what is on the menu today? But, unfortunately, that is not possible. Instead, we must make educated hypotheses about the diets of both ecotypes based on necropsies and stable isotope studies, and behavioral and spatial surveys. And, I will continue to look to new technologies and creative thinking to provide the answers we are seeking.

Literature cited:

Ballance, L. T. (1992). Habitat use patterns and ranges of the bottlenose dolphin in the Gulf of California, Mexico. Marine Mammal Science8(3), 262-274.

Barros, N.B., and D. K. Odell. (1990). Food habits of bottlenose dolphins in the southeastern United States. Pages 309-328 in S. Leatherwood and R. R. Reeves, eds. The bottlenose dolphin. Academic Press, San Diego, CA.

Barros, N., E. Parsons and T. Jefferson. (2000). Prey of bottlenose dolphins from the South China Sea. Aquatic Mammals 26:2–6.

Clarke, M. 1986. Cephalopods in the diet of odontocetes. Pages 281–321 in M. Bryden and R. Harrison, eds. Research on dolphins. Clarendon Press, Oxford, NY.

Cockcroft, V., and G. Ross. (1990). Food and feeding of the Indian Ocean bottlenose dolphin off southern Natal, South Africa. Pages 295–308 in S. Leatherwood and R. R. Reeves, eds. The bottlenose dolphin. Academic Press, San Diego, CA.

Defran, R. H., Weller, D. W., Kelly, D. L., & Espinosa, M. A. (1999). Range characteristics of Pacific coast bottlenose dolphins (Tursiops truncatus) in the Southern California Bight. Marine Mammal Science15(2), 381-393.

Díaz‐Gamboa, R. E., Gendron, D., & Busquets‐Vass, G. (2018). Isotopic niche width differentiation between common bottlenose dolphin ecotypes and sperm whales in the Gulf of California. Marine Mammal Science34(2), 440-457.

Gonzalez, A., A. Lopez, A. Guerra and A. Barreiro. (1994). Diets of marine mammals stranded on the northwestern Spanish Atlantic coast with special reference to Cephalopoda. Fisheries Research 21:179–191.

Hanson, M. T., and Defran, R. H. (1993). The behavior and feeding ecology of the Pacific coast bottlenose dolphin, Tursiops truncatus. Aquatic Mammals19, 127-127.

Norris, K. S., and J. H. Prescott. (1961). Observations on Pacific cetaceans of Californian and Mexican waters. University of California Publications of Zoology 63:29, 1-402.

Shane, S. H. (1990). Comparison of bottlenose dolphin behavior in Texas and Florida, with a critique of methods for studying dolphin behavior. Pages 541-558 in S. Leatherwood and R. R. Reeves, eds. The bottlenose dolphin. Academic Press, San Diego, CA.

Shane, S., R. Wells and B. Wursig. (1986). Ecology, behavior and social organization of bottlenose dolphin: A review. Marine Mammal Science 2:34–63.

Walker, W.A. (1981). Geographical variation in morphology and biology of the bottlenose dolphins (Tursiops) in the eastern North Pacific. NMFS/SWFC Administrative Report. No, LJ-91-03C.

Walker, J., C. Potter and S. Macko. (1999). The diets of modern and historic bottlenose dolphin populations reflected through stable isotopes. Marine Mammal Science 15:335–350.

Humans Hide and Wildlife Thrive: Human-mediated ecosystem changes during a pandemic

By: Alexa Kownacki, Ph.D. Student, OSU Department of Fisheries and Wildlife, Geospatial Ecology of Marine Megafauna Lab

We live in an interesting time. Many of us academic scientists sit in the confines of our homes, reading scientific papers, analyzing years-worth of data, working through a years-worth of house projects, or simply watching Netflix. While we are confined to a much smaller area, wildlife is not.  

During this challenging situation we have unique opportunities to study what happens when people are not outside for recreation. All of us who feel trapped inside our homes are not only saving human lives, we are changing ecosystems. Humans are constantly molding our ecosystems on fine and grand scales, from xeriscaping our lawns with native, drought-resistant plants to developing large plots of land for new homes. We manipulate nature, for better or for worse.

So, what happens when we change our behavior? Rather than driving, we’re gardening, instead of playing at parks, we’re playing board games at our kitchen tables; we as a society are completely changing our habitat-use patterns. When any top predator changes its habitat-use, switches niches, or drastically changes its behaviors, there are top-down ecosystem effects. When one species changes its behavior, there are major downstream impacts on predation, foraging, diet, and habitat use. For example, when bluegill sunfish underwent large shifts in both diet and habitat, major predator-mediated habitat use changes in other species occurred (Mittelbach 1986). There are multiple studies describing the impacts of human-mediated drivers on ecosystems worldwide. In coastal environments, anthropogenic activities, specifically shipping, industry, and urban development, dramatically change both the coastal and marine ecosystems (Mead et al. 2013).

The highly developed coastline along Los Angeles, CA is a prime example of urban development. (Image source: LA Magazine.)

By far the most pronounced example of how an international halt on travel can alter ecosystems comes from the tragic terrorist attacks on September 11, 2001. Prior to this current, viral pandemic, the events following 9/11 were the first time that nearly all major transit stopped in the USA—including airplanes and major shipping traffic. This halt created a unique opportunity to study some of the secondary impacts, such as a reduction in shipping traffic noise, on cetaceans. Following 9/11, there was a six decibel decrease in underwater noise that co-occurred with a decrease in stress hormones of endangered North Atlantic right whales (Rolland et al. 2012). When I first read about this study, my first thought was “leave it to scientists to make the best out of a terrible situation.” Truly, learning from nature, even in the darkest of days, is an incredible skillset. Research like this inspires me to ask questions about what changes are happening in ecosystems now because of recent events. For example, the entire port of San Diego, its beaches and bays, are closed for all recreational activity and I wonder how this reduction in traffic is similar to the post-9/11 study but on bottlenose dolphins, gray whales, and pinnipeds that are coast-associated. Are urban and suburban neighborhoods slowly becoming more rural and making space for wildlife again?

My dad lives in a suburban neighborhood of San Diego, CA. In the past few weeks, his “Ring doorbell camera” captured a bobcat walking along the raised brick path multiple times. (Media source: Eric Kownacki)

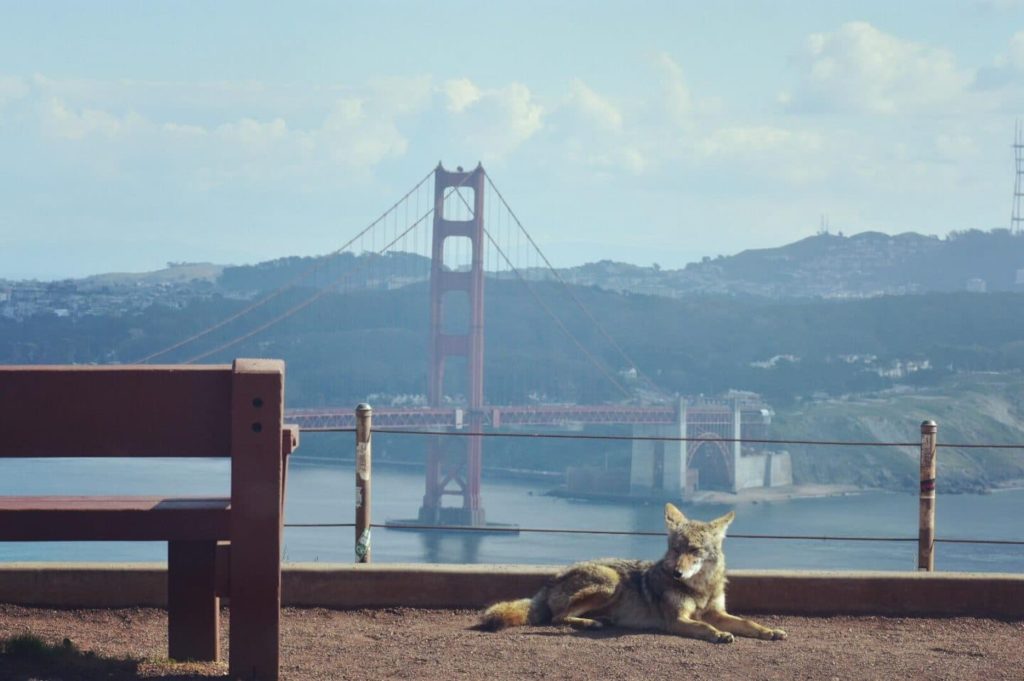
There is increasing news coverage on wild animals “taking over” cities. Dr. Leila Lemos touched on this earlier with her blog post centering on how academics are changing their means of teaching, conferencing, and learning. There are photos of wild goats running through the streets of Wales, UK, coyotes roaming the streets of San Francisco, CA, USA, monkeys swarming the streets in Thailand, pumas wandering the streets of Santiago, Chile, and Sika deer peering into empty restaurants in Nara, Japan (Colarossi 2020). In reality, this wildlife was likely part of the ecosystem prior to the formation of these cities but was forced out of the more urban centers. As we sit in our homes, rather than looking bleakly onto empty streets, we can search for wildlife, create a backyard birding competition with your friends, guess which flowers will bloom first, and ask questions of our changing ecosystems.

Coyote at a park in northern California with the San Francisco Golden Gate Bridge in the background. (Image source: u/beccatravels via Reddit)

Citations:

Colarossi, Natalie. “Photos Show Wild Animals Roaming Empty Streets as Coronavirus Lockdowns Keep Humans Inside.” Insider, Insider, 2 Apr. 2020, www.insider.com/photos-show-animals-roaming-empty-streets-during-coronavirus-lockdowns-2020-4#in-santiago-chile-a-wild-puma-was-seen-pacing-through-the-quiet-streets-according-to-the-chilean-agricultural-and-livestock-service-the-puma-came-down-from-the-mountains-after-seeing-the-streets-were-largely-empty-6.

Mead, A., Griffiths, C.L., Branch, G.M., McQuaid, C.D., Blamey, L.K., Bolton, J.J., Anderson, R.J., Dufois, F., Rouault, M., Froneman, P.W. and Whitfield, A.K., 2013. Human-mediated drivers of change—impacts on coastal ecosystems and marine biota of South Africa. African Journal of Marine Science35(3), pp.403-425.

Mittelbach, Gary. 1986. Predator-mediated habitat use: some consequences for species interactions. Environ Biol Fish 16, 159–169. https://doi.org/10.1007/BF00005168

Rolland, R.M., Parks, S.E., Hunt, K.E., Castellote, M., Corkeron, P.J., Nowacek, D.P., Wasser, S.K. and Kraus, S.D., 2012. Evidence that ship noise increases stress in right whales. Proceedings of the Royal Society B: Biological Sciences279(1737), pp.2363-2368.

Zooming in: A closer look at bottlenose dolphin distribution patterns off of San Diego, CA

By: Alexa Kownacki, Ph.D. Student, OSU Department of Fisheries and Wildlife, Geospatial Ecology of Marine Megafauna Lab

Data analysis is often about parsing down data into manageable subsets. My project, which spans 34 years and six study sites along the California coast, requires significant data wrangling before full analysis. As part of a data analysis trial, I first refined my dataset to only the San Diego survey location. I chose this dataset for its standardization and large sample size; the bulk of my sightings, over 4,000 of the 6,136, are from the San Diego survey site where the transect methods were highly standardized. In the next step, I selected explanatory variable datasets that covered the sighting data at similar spatial and temporal resolutions. This small endeavor in analyzing my data was the first big leap into understanding what questions are feasible in terms of variable selection and analysis methods. I developed four major hypotheses for this San Diego site.

The study species: common bottlenose dolphin (Tursiops truncatus) seen along the California coastline in 2015. Image source: Alexa Kownacki.

Hypotheses:

H1: I predict that bottlenose dolphin sightings along the San Diego transect throughout the years 1981-2015 exhibit clustered distribution patterns as a result of the patchy distributions of both the species’ preferred habitats, as well as the social nature of bottlenose dolphins.

H2: I predict there would be higher densities of bottlenose dolphin at higher latitudes spanning 1981-2015 due to prey distributions shifting northward and less human activities in the northerly sections of the transect.

H3: I predict that during warm (positive) El Niño Southern Oscillation (ENSO) months, the dolphin sightings in San Diego would be distributed more northerly, predominantly with prey aggregations historically shifting northward into cooler waters, due to (secondarily) increasing sea surface temperatures.

H4: I predict that along the San Diego coastline, bottlenose dolphin sightings are clustered within two kilometers of the six major lagoons, with no specific preference for any lagoon, because the murky, nutrient-rich waters in the estuarine environments are ideal for prey protection and known for their higher densities of schooling fishes.

Data Description:

The common bottlenose dolphin (Tursiops truncatus) sighting data spans 1981-2015 with a few gap years. Sightings cover all months, but not in all years sampled. The same transect in San Diego was surveyed in a small, rigid-hulled inflatable boat with approximately a two-kilometer observation area (one kilometer surveyed 90 degrees to starboard and port of the bow).

I wanted to see if there were changes in dolphin distribution by latitude and, if so, whether those changes had a relationship to ENSO cycles and/or distances to lagoons. For ENSO data, I used the NOAA database that provides positive, neutral, and negative indices (1, 0, and -1, respectively) by each month of each year. I matched these ENSO data to my month-date information of dolphin sighting data. Distance from each lagoon was calculated for each sighting.

Figure 1. Map representing the San Diego transect, represented with a light blue line inside of a one-kilometer buffered “sighting zone” in pale yellow. The dark pink shapes are dolphin sightings from 1981-2015, although some are stacked on each other and cannot be differentiated. The lagoons, ranging in size, are color-coded. The transect line runs from the breakwaters of Mission Bay, CA to Oceanside Harbor, CA.

Results: 

H1: True, dolphins are clustered and do not have a uniform distribution across this area. Spatial analysis indicated a less than a 1% likelihood that this clustered pattern could be the result of random chance (Fig. 1, z-score = -127.16, p-value < 0.0001). It is well-known that schooling fishes have a patchy distribution, which could influence the clustered distribution of their dolphin predators. In addition, bottlenose dolphins are highly social and although pods change in composition of individuals, the dolphins do usually transit, feed, and socialize in small groups.

Figure 2. Summary from the Average Nearest Neighbor calculation in ArcMap 10.6 displaying that bottlenose dolphin sightings in San Diego are highly clustered. When the z-score, which corresponds to different colors on the graphic above, is strongly negative (< -2.58), in this case dark blue, it indicates clustering. Because the p-value is very small, in this case, much less than 0.01, these results of clustering are strongly significant.

H2: False, dolphins do not occur at higher densities in the higher latitudes of the San Diego study site. The sightings are more clumped towards the lower latitudes overall (p < 2e-16), possibly due to habitat preference. The sightings are closer to beaches with higher human densities and human-related activities near Mission Bay, CA. It should be noted, that just north of the San Diego transect is the Camp Pendleton Marine Base, which conducts frequent military exercises and could deter animals.

Figure 3. Histogram comparing the latitudes with the frequency of dolphin sightings in San Diego, CA. The x-axis represents the latitudinal difference from the most northern part of the transect to each dolphin sighting. Therefore, a small difference would translate to a sighting being in the northern transect areas whereas large differences would translate to sightings being more southerly. This could be read from left to right as most northern to most southern. The y-axis represents the frequency of which those differences are seen, that is, the number of sightings with that amount of latitudinal difference, or essentially location on the transect line. Therefore, you can see there is a peak in the number of sightings towards the southern part of the transect line.

H3: False, during warm (positive) El Niño Southern Oscillation (ENSO) months, the dolphin sightings in San Diego were more southerly. In colder (negative) ENSO months, the dolphins were more northerly. The differences between sighting latitude and ENSO index was significant (p<0.005). Post-hoc analysis indicates that the north-south distribution of dolphin sightings was different during each ENSO state.

Figure 4. Boxplot visualizing distributions of dolphin sightings latitudinal differences and ENSO index, with -1,0, and 1 representing cold, neutral, and warm years, respectively.

H4: True, dolphins are clustered around particular lagoons. Figure 5 illustrates how dolphin sightings nearest to Lagoon 6 (the San Dieguito Lagoon) are always within 0.03 decimal degrees. Because of how these data are formatted, decimal degrees is the easiest way to measure change in distance (in this case, the difference in latitude). In comparison, dolphins at Lagoon 5 (Los Penasquitos Lagoon) are distributed across distances, with the most sightings further from the lagoon.

Figure 5. Bar plot displaying the different distances from dolphin sighting location to the nearest lagoon in San Diego in decimal degrees. Note: Lagoon 4 is south of the study site and therefore was never the nearest lagoon.

I found a significant difference between distance to nearest lagoon in different ENSO index categories (p < 2.55e-9): there is a significant difference in distance to nearest lagoon between neutral and negative values and positive and neutral years. Therefore, I hypothesize that in neutral ENSO months compared to positive and negative ENSO months, prey distributions are changing. This is one possible hypothesis for the significant difference in lagoon preference based on the monthly ENSO index. Using a violin plot (Fig. 6), it appears that Lagoon 5, Los Penasquitos Lagoon, has the widest variation of sighting distances in all ENSO index conditions. In neutral years, Lagoon 0, the Buena Vista Lagoon has multiple sightings, when in positive and negative years it had either no sightings or a single sighting. The Buena Vista Lagoon is the most northerly lagoon, which may indicate that in neutral ENSO months, dolphin pods are more northerly in their distribution.

Figure 6. Violin plot illustrating the distance from lagoons of dolphin sightings under different ENSO conditions. There are three major groups based on ENSO index: “-1” representing cold years, “0” representing neutral years, and “1” representing warm years. On the x-axis are lagoon IDs and on the y-axis is the distance to the nearest lagoon in decimal degrees. The wider the shapes, the more sightings, therefore Lagoon 6 has many sightings within a very small distance compared to Lagoon 5 where sightings are widely dispersed at greater distances.


Bottlenose dolphins foraging in a small group along the California coast in 2015. Image source: Alexa Kownacki.

Takeaways to science and management: 

Bottlenose dolphins have a clustered distribution which seems to be related to ENSO monthly indices, and likely, their social structures. From these data, neutral ENSO months appear to have something different happening compared to positive and negative months, that is impacting the sighting distributions of bottlenose dolphins off the San Diego coastline. More research needs to be conducted to determine what is different about neutral months and how this may impact this dolphin population. On a finer scale, the six lagoons in San Diego appear to have a spatial relationship with dolphin sightings. These lagoons may provide critical habitat for bottlenose dolphins and/or for their preferred prey either by protecting the animals or by providing nutrients. Different lagoons may have different spans of impact, that is, some lagoons may have wider outflows that create larger nutrient plumes.

Other than the Marine Mammal Protection Act and small protected zones, there are no safeguards in place for these dolphins, whose population hovers around 500 individuals. Therefore, specific coastal areas surrounding lagoons that are more vulnerable to habitat loss, habitat degradation, and/or are more frequented by dolphins, may want greater protection added at a local, state, or federal level. For example, the Batiquitos and San Dieguito Lagoons already contain some Marine Conservation Areas with No-Take Zones within their reach. The city of San Diego and the state of California need better ways to assess the coastlines in their jurisdictions and how protecting the marine, estuarine, and terrestrial environments near and encompassing the coastlines impacts the greater ecosystem.

This dive into my data was an excellent lesson in spatial scaling with regards to parsing down my data to a single study site and in matching my existing data sets to other data that could help answer my hypotheses. Originally, I underestimated the robustness of my data. At first, I hesitated when considering reducing the dolphin sighting data to only include San Diego because I was concerned that I would not be able to do the statistical analyses. However, these concerns were unfounded. My results are strongly significant and provide great insight into my questions about my data. Now, I can further apply these preliminary results and explore both finer and broader scale resolutions, such as using the more precise ENSO index values and finding ways to compare offshore bottlenose dolphin sighting distributions.