Wavelet analysis to describe biological cycles and signals of non-stationarity

By Allison Dawn, GEMM Lab Master’s student, OSU Department of Fisheries, Wildlife, and Conservation Sciences, Geospatial Ecology of Marine Megafauna Lab 

During my second term of graduate school, I have been preparing to write my research proposal. The last two months have been an inspiring process of deep literature dives and brainstorming sessions with my mentors. As I discussed in my last blog, I am interested in questions related to pattern and scale (fine vs. mesoscale) in the context of the Pacific Coast Feeding Group (PCFG) of gray whales, their zooplankton prey, and local environmental variables.

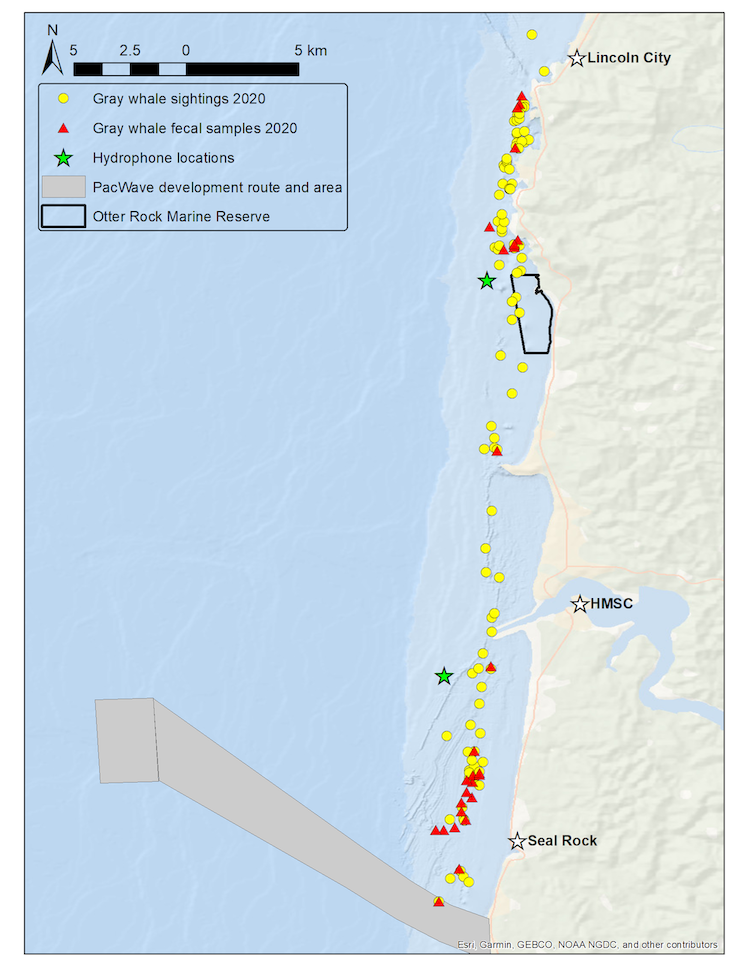
My work currently involves exploring which scales of pattern are important in these trophic relationships and whether the dominant scale of a pattern changes over time or space. I have researched which analysis tools would be most appropriate to analyze ecological time series data, like the impressive long-term dataset the GEMM lab has collected in Port Orford as part of the TOPAZ  project, where we have monitored the abundance of whales and zooplankton, as well as environmental variables since 2016. 

A useful analytical tool that I have come across in my recent coursework and literature review is called wavelet analysis. Importantly, wavelet analysis can handle non-stationarity and edge detection in time series data. Non-stationarity is when a dataset’s mean and/or variance can change over time or space, and edge detection is the identification of the change location (in time or space). For example, it is not just the cycles or “ups and downs” of zooplankton abundance I am interested in, but when in time or where in space these cycles of “ups and downs” might change in relation to what their previous values, or distances between values, were. Simply stated, non-stationarity is when what once was normal is no longer normal. Wavelet analysis has been applied across a broad range of fields, such as environmental engineering (Salas et al. 2020), climate science (Slater et al. 2021), and bio-acoustics (Buchan et al. 2021). It can be applied to any time series dataset that might violate the traditional statistical assumption of stationarity. 

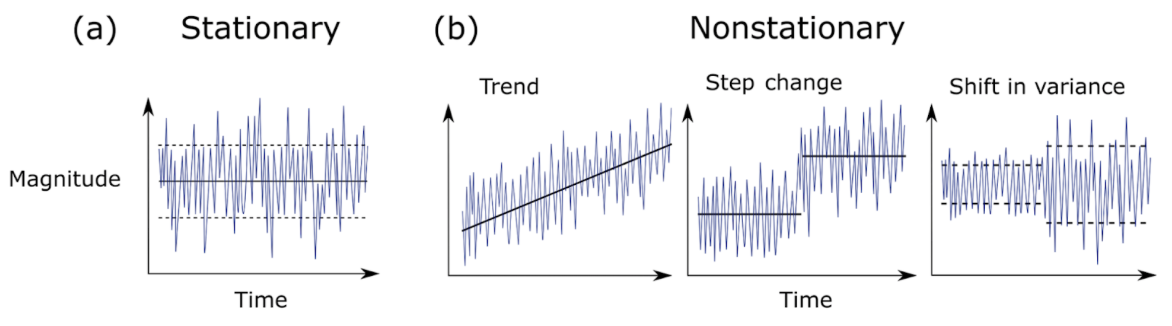
In a recent review of climate science methodology, Slater et al. (2021) outlined the possible behavior of time series data. Using theoretical plots, the authors show that data can a) have the same mean and variance over time, or b) have non-stationarity that can be broken into three major groups – trend, step change, or shifts in variance. Figure 1 further demonstrates the difference between stationary vs. non-stationary data in relation to a given variable of interest over time. 

Figure 1. Plots showing the possible magnitude of a given variable across a time series: a) Stationary behavior, b) Non-stationary trend, step-change, and a shift in variance. [Taken from Slater et. al (2021)].

Traditional correlation statistics assumes stationarity, but it has been shown that ecological time series are often non-stationary at certain scales (Cazelles & Hales, 2006). In fact, ecological data rarely meets the requirements of a controlled experiment that traditional statistics require. This non-stationarity of ecological data means that while widely-used methods like generalized linear models and analyses of variances (ANOVAs) can be helpful to assess correlation, they are not always sufficient on their own to describe the complex natural phenomena ecologists seek to explain. Non-stationarity occurs frequently in ecological time series, so it is appropriate to consider analysis tools that will allow us to detect edges to further investigate the cause.

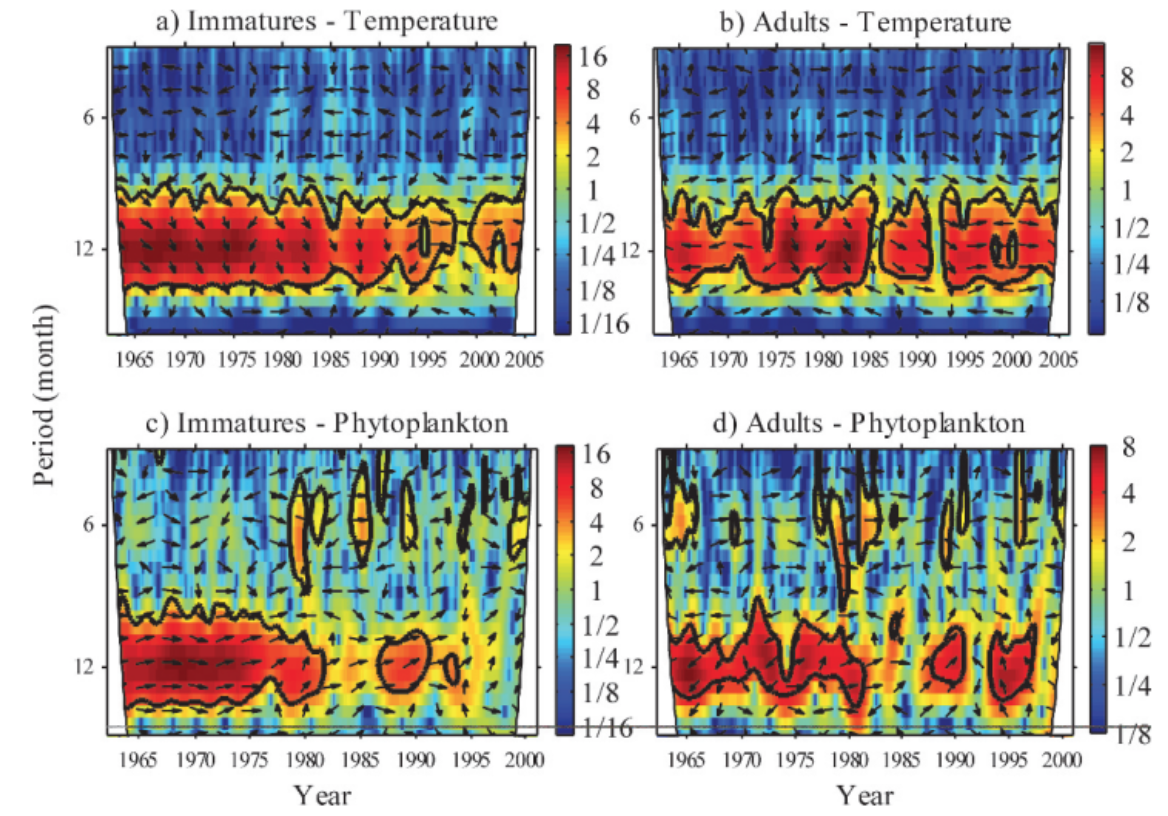
Wavelet analysis can also be conducted across a time series of multiple response variables to assess if these variables share high common power (correlation). When data is combined in this way it is called a cross-wavelet analysis. An interesting paper used cross-wavelet analysis to assess the seasonal response of zooplankton life history in relation to climate warming (Winder et. al 2009). Results from their cross-wavelet analysis showed that warming temperatures over the past two decades increased the voltinism (number of broods per year) of copepods. The authors show that where once annual recruitment followed a fairly stationary pattern, climate warming has contributed to a much more stochastic pattern of zooplankton abundance. From these results, the authors contribute to the hypothesis that climate change has had a temporal impact on zooplankton population dynamics, and recruitment has increasingly drifted out of phase from the original annual cycles. 

Figure 2. Cross-wavelet spectrum for immature and adult Leptodiaptomus ashlandi for 1965 through either 2000 or 2005. Plots show a) immatures and temperature, b) adults and temperature, c) immatures and phytoplankton, and d) adults and phytoplankton. Arrows indicate phase between combined time series. 0 degrees is in-phase and 180 degrees is anti-phase. Black contour lines show “cone of influence” or the 95% significance level, every value within the cone is considered significant. Left axis shows the temporal period, and the color legend shows wavelet frequency power, with low frequencies in blue and high frequencies in red. Plots show strong covariation of high common power at the 12-month period until the 1980s. This pattern is especially evident in plot c) and d). [Taken from (Winder et. al 2009)].

While wavelet and cross-wavelet analyses should not be the only tool used to explore data, due to its limitations with significance testing, it is still worth implementing to gain a better understanding of how time series variables relate to each other over multiple spatial and/or temporal scales. It is often helpful to combine multiple methods of analysis to get a larger sense of patterns in the data, especially in spatio-temporal research.

When conducting research within the context of climate change, where the concentration of CO2 in ppm in the atmosphere is a non-stationary time series itself (Figure 3), it is important to consider how our datasets might be impacted by climate change and wavelet analysis can help identify the scales of change. 

Figure 3. Plot showing the historic fluctuations of CO^2 and the recent deviation from normal levels. Source: https://globalclimate.ucr.edu/resources.html

When considering our ecological time series of data in Port Orford, we want to evaluate how changing ocean conditions may be related to data trends. For example, has the annual mean or variance of zooplankton abundance changed over time, and where has that change occurred in time or space? These changes might have occurred at different scales and might be invisible at other scales. I am eager to see if wavelet analysis can detect these sorts of changes in the abundance of zooplankton across our time series of data, particularly during the seasons of intense heat waves or upwelling. 

Did you enjoy this blog? Want to learn more about marine life, research and conservation? Subscribe to our blog and get a weekly email when we make a new post! Just add your name into the subscribe box on the left panel.

References

Buchan, S. J., Pérez-Santos, I., Narváez, D., Castro, L., Stafford, K. M., Baumgartner, M. F., … & Neira, S. (2021). Intraseasonal variation in southeast Pacific blue whale acoustic presence, zooplankton backscatter, and oceanographic variables on a feeding ground in Northern Chilean Patagonia. Progress in Oceanography, 199, 102709.

Cazelles, B., & Hales, S. (2006). Infectious diseases, climate influences, and nonstationarity. PLoS Medicine, 3(8), e328.

Salas, J. D., Anderson, M. L., Papalexiou, S. M., & Frances, F. (2020). PMP and climate variability and change: a review. Journal of Hydrologic Engineering, 25(12), 03120002.

Slater, L. J., Anderson, B., Buechel, M., Dadson, S., Han, S., Harrigan, S., … & Wilby, R. L. (2021). Nonstationary weather and water extremes: a review of methods for their detection, attribution, and management. Hydrology and Earth System Sciences, 25(7), 3897-3935.

Winder, M., Schindler, D. E., Essington, T. E., & Litt, A. H. (2009). Disrupted seasonal clockwork in the population dynamics of a freshwater copepod by climate warming. Limnology and Oceanography, 54(6part2), 2493-2505.

Introducing IndividuWhale!

By Lisa Hildebrand, PhD student, OSU Department of Fisheries, Wildlife, & Conservation Sciences, Geospatial Ecology of Marine Megafauna Lab

If you are an avid reader of our blog, you probably know quite a bit about gray whales, specifically the Pacific Coast Feeding Group (PCFG) of gray whales. Of the just over 50 GEMM Lab blogs written in 2021, 43% of them were about PCFG gray whales (or at least mentioned gray whales in some way). I guess this statistic is not too surprising when you consider that six of the 10 GEMM Lab members conduct gray whale-related research. You might think that we would have reached our annual limit of online gray whale content with that many blogs featuring these gentle giants, but you would in fact be wrong…

At the end of 2021, we launched a brand new website all about gray whales called IndividuWhale! It features stories of some of the Oregon coast’s most iconic gray whales, as well as information about how we study them, stressors they experience in our waters, and even a game to test your gray whale identification skills. IndividuWhale is a true labor of love that took over a year to create and that we are extremely proud to share with you today. Before I tell you more about the website, I want to take a moment to give a huge shout out to Erik Urdahl who was instrumental in getting this website off the ground and making it as interactive and beautiful as it is – hurrah Erik!

Equal‘s right side with visible boat propeller scars. Source: GEMM Lab.

Like us humans, gray whales have individual personalities and stories. They experience life-altering events, go through periods of stress, must provide for their offspring, and can behave differently to one another. Since Leigh & co. have been conducting in-depth research about PCFG gray whales in Oregon waters since 2016, we have been able to document several fascinating stories and events that these individuals have experienced. Take Equal, for example, a male whale that is at least 7 years old. The GEMM Lab observed Equal on consecutive days in June 2018, where on the first day he looked healthy and normal, but on the second day had fresh boat propeller-like scars on his back. Not only did we document these scars in photographs, but we were also able to collect a fecal sample from Equal the day we observed him with these scars. After analyzing his fecal sample for stress hormones, we discovered that Equal had very high stress levels compared to previous samples collected – unsurprising seeing as he had been hit by a boat! While this event was certainly sad for Equal (although don’t worry – we have seen him many times again in the years after this event looking healthy & normal once again), it was a very fortuitous occurrence for us since we were able to “validate” our stress hormone data relative to the value from Equal when he was clearly stressed out. Find out more about Equal as well as seven other gray whales here!

You might be wondering, how we knew that the whale with the boat propeller scar was Equal and how we recognize him again years after the incident. Gray whales have unique pigmentation patterns on their bodies and flukes that allow us to re-identify individuals between years and distinguish them from one another. Additionally, scars, such as those that Equal now carries on his back, can also be useful in telling whales apart. Therefore, we take photographs of every whale we see to match markings and identify whales. This process is called photo ID. Some individuals can have very distinctive markings, such as Roller Skate who has two big white dots on her right side, while others can look more inconspicuous, like Clouds. Therefore, conducting photo ID requires a lot of attention to detail and perseverance. To learn more about the different features we use to identify individuals, check out the “Studying Whales With Photographs” page. Do you think you have what it takes to tell individuals apart? Then try your luck at our photo ID game after!

Test your photo ID skills in our whale match game!

Unfortunately, these whales do not live in a pristine environment, as is evidenced by Equal’s story. Their main objective during the summer when in Oregon waters is to gain weight (energy stores) by consuming large amounts of prey, which is made more difficult by a number of stressors, including potential fishery entanglements, ocean noise, vessel traffic, and habitat changes. We describe these four stressors on the IndividuWhale website since we are trying to assess the impacts of them on gray whales through our research, however they are certainly not the only stressors that these whales experience. Little is known about the level at which these stressors may have a negative impact on the whales, and how whales react when they experience some of these stressors in concert. The answers to these questions are difficult to tease apart but the GRANITE project is aiming to do so through a framework called Population Consequences of Multiple Stressors (read more about it here). This approach requires a lot of data on a lot of individuals in a population and as you can see from the IndividuWhale website, we are slowly starting to get there! 2022 will certainly bring many more gray whale-themed blogs to this website, and you can share in our journey of learning about the lives of PCFG gray whales by exploring the IndividuWhale website (https://www.individuwhale.com).

How much energy does that mouthful cost?

By Lisa Hildebrand, PhD student, OSU Department of Fisheries, Wildlife, & Conservation Sciences, Geospatial Ecology of Marine Megafauna Lab

Tagging a whale is no easy feat, nor is it without some impact to the whale – no matter how minimized through the use of non-penetrating suction cup tags. Yet, in August 2021 the GEMM Lab initiated a new phase in our research on gray whales, aimed at obtaining a better understanding of the underwater lives and energetics of a gray whale (Figure 1, top image). We captured some amazing data through these specialized, non-invasive tags that provide a brief window into their world and physiology. The video recordings from the tags showed us whales digging their heads into the benthos generating billowing clouds of sediment, likely exploiting desirable prey patches (Figure 1, middle images). We also saw foraging whales undertake dizzying spins and headstands for hours, demonstrating the fascinating maneuverability and flexibility of gray whales (Figure 1, bottom image). But what is motivating us to capture this information?

The GEMM Lab has researched the ecology and physiology of Pacific Coast Feeding Group (PCFG) gray whales since 2015. Our efforts have filled crucial knowledge gaps to better understand this sub-group of the Eastern North Pacific (ENP) gray whale population. We now know that gray whale body condition increases throughout a foraging season and can fluctuate considerably between years (Soledade Lemos et al. 2020). Additionally, body condition varies significantly by reproductive state, with calves and pregnant females displaying higher body conditions (Soledade Lemos et al. 2020). We have also validated and quantified fecal steroid and thyroid hormone metabolite concentrations, providing us with thresholds to identify a stressed vs. a not stressed whale based on its hormone levels (Lemos et al. 2020). These validations have allowed us to make correlations between poor body condition and the steroid hormone cortisol which confirm that slim whales are stressed, while chubby whales are relaxed (Lemos et al. 2021). These physiological results are particularly salient in the light of our recent findings that PCFG gray whales select prey quality over prey quantity when foraging (Hildebrand et al. in review) and that the caloric content of available prey species in the PCFG range vary significantly (Hildebrand et al. 2021).

While we have addressed several fundamental questions about the PCFG in the last 7 years, answering one question has led to asking 10 more questions – a common pattern in science. Given that we know (1) PCFG whales improve their body condition over the course of the foraging season (Soledade Lemos et al. 2020), (2) PCFG females are able to successfully give birth to and wean calves (Calambokidis & Perez 2017), and (3) certain prey in the PCFG region are of higher caloric value than prey in the ENP Arctic foraging grounds (Hildebrand et al. 2021), a big question that we continue to scratch our heads about is why does the PCFG sub-group have such a small abundance (~250 individuals; Calambokidis et al. 2017) in comparison to the much larger ENP population (~21,000 individuals; Stewart & Weller 2021). Several hypotheses have been suggested including that the energetic costs of feeding may differ between ENP and PCFG whales, with the latter having to expend more energy to obtain prey due to the different foraging behaviors employed (Torres et al. 2018) to obtain diverse prey types, thus justifying the larger abundance of the ENP (Hildebrand et al. 2021). 

Quantifying the energetic cost of baleen whale behaviors is not simple. However, the development of animal-borne tags has allowed scientists to make big strides regarding behavioral cost quantification. The majority of this work has focused on rorqual whales (i.e., blue, humpback, fin whales; e.g., Goldbogen et al. 2013; Cade et al. 2016) as their characteristic lunge-feeding strategy produces a distinct signal in the accelerometer sensors integrated within the tags, making feeding events easier to identify. Gray whales, unlike rorquals, do not lunge-feed. ENP gray whales predominantly feed benthically; diving down to the benthos where they turn onto their side and suction mouthfuls of soft sediment (mud) that contains amphipods that they filter out of the mud (Nerini & Oliver 1983). PCFG whales feed benthically as well, but they also use a number of other feeding behaviors to obtain a variety of prey in a variety of benthic habitats, including headstands, bubble blasts, and sharking (Torres et al. 2018). The above-mentioned gray whale feeding behaviors involve much subtler movements than the powerful, distinctive lunges displayed by rorquals, yet they undoubtedly still incur some energetic cost to the whales. However, exactly how energetically costly the various gray whale feeding behaviors are remains unknown.

One of the three suction cup tags we deployed on gray whales. Dr. Cade printed special “kelp shields” (blue part of the tag) to prevent kelp from potentially getting caught underneath the tag since PCFG whales often forage on reefs with a lot of kelp. This tag includes a video camera (the lens can be seen in the center of the tag) to record video of the whale’s underwater behavior. Source: L. Torres.

This knowledge gap is one of the reasons why the GEMM Lab initiated a new project in close collaboration with Dr. Dave Cade from Stanford University and John Calambokidis from Cascadia Research Collective to quantify and understand the energetics and underwater behavior of gray whales using suction-cup tags. The project was kick-started with a very successful pilot effort the week of August 16th this year. Tags were placed on the backs of three different PCFG gray whales with a long carbon fiber pole and attached to the whales with four suction cups. The tags recorded video, position, accelerometry, and magnetometry data, which we will use to recreate the animal’s movements (pitch, roll), heading, trackline, and environment. Although the weather forecast did not look promising for most of the week, we lucked out with perfect conditions for one day during which we managed to deploy three tags on three different gray whales that are well-known, long-term study animals of the GEMM Lab. The tags stayed on the whales for 1-6 hours and were all recovered (including an adventurous trip up the Alsea River which involved a kayak deployment!). 

Dr. Cade spent the rest of the week teaching GEMM Lab PI Leigh Torres, University of British Columbia Master’s student Kate Colson (who is co-advised by Leigh and Dr. Andrew Trites), and myself the intricacies of data download, processing, and preliminary analysis of the tag data. For her Master’s research, Kate will develop a bioenergetics model for the PCFG sub-group that includes data on foraging energetics (estimated from the tag data) and prey availability in the PCFG foraging range. I plan on using the tag data to assess behavior patterns of PCFG whales relative to habitat as part of my PhD research. All together analysis of the data from these short-term tag deployments will help us get closer to understanding the behavioral choices, habitat needs, and energetic trade-offs of whales living in a rapidly changing ocean. With the success of this pilot effort, we plan to conduct another suction-cup tagging effort next summer to hopefully capture and explore more mysterious underwater behaviors of the PCFG.

An ecstatic team at the end of a very long yet successful day of suction cup tagging. Bottom (from left): Leigh Torres, Lisa Hildebrand, Clara Bird, Dave Cade, KC Bierlich. Top: John Calambokidis.

This project was funded by sales and renewals of the special Oregon whale license plate, which benefits MMI. We gratefully thank all the gray whale license plate holders, who made this research effort possible.

Literature cited

Cade, D. E., Friedlaender, A. S., Calambokidis, J., & Goldbogen, J. A. 2016. Kinematic diversity in rorqual whale feeding mechanisms. Current Biology 26(19):2617-2624. doi:10.1016/j.cub.2016.07.037.

Calambokidis, J., & Perez, A. 2017. Sightings and follow-up of mothers and calves in the PCFG and implications for internal recruitment. IWC Report SC/A17/GW/04 for the Workshop on the Status of North Pacific Gray Whales (La Jolla: IWC). 

Calambokidis, J., Laake, J., & Perez, A. 2017. Updated analysis of abundance and population structure of seasonal gray whales in the Pacific Northwest, 1996-2015. IWC Report SC/A17/GW/05 for the Workshop on the Status of North Pacific Gray Whales (La Jolla: IWC).

Goldbogen, J. A., Friedlaender, A. S., Calambokidis, J., McKenna, M. F., Simon, M., & Nowacek, D. P. 2013. Integrative approaches to the study of baleen whale diving behavior, feeding performance, and foraging ecology. BioScience 63(2):90-100. doi:10.1525/bio.2013.63.2.5.

Hildebrand, L., Bernard, K. S., & Torres, L. G. 2021. Do gray whales count calories? Comparing energetic values of gray whale prey across two different feeding grounds in the eastern North Pacific. Frontiers in Marine Science 1008. doi:10.3389/fmars.2021.683634.

Lemos, L. S., Olsen, A., Smith, A., Burnett, J. D., Chandler, T. E., Larson, S., Hunt, K. E., & Torres, L. G. 2021. Stressed and slim or relaxed and chubby? A simultaneous assessment of gray whale body condition and hormone variability. Marine Mammal Science. doi:10.111/mms.12877.

Lemos, L.S., Olsen, A., Smith, A., Chandler, T.E., Larson, S., Hunt, K., and L.G. Torres. 2020. Assessment of fecal steroid and thyroid hormone metabolites in eastern North Pacific gray whales. Conservation Physiology 8:coaa110.

Nerini, M. K., & Oliver, J. S. 1983. Gray whales and the structure of the Bering Sea benthos. Oecologia 59:224-225. doi:10.1007/bf00378840.

Soledade Lemos, L., Burnett, J. D., Chandler, T. E., Sumich, J. L., & Torres, L. G. 2020. Intra- and inter-annual variation in gray whale body condition on a foraging ground. Ecosphere 11(4):e03094.

Stewart, J. D., & Weller, D. W. 2021. Abundance of eastern North Pacific gray whales 2019/2020. Department of Commerce, NOAA Technical Memorandum NMFS-SWFSC-639. United States: NOAA. doi:10.25923/bmam-pe91.

Torres, L.G., Nieukirk, S.L., Lemos, L., and T.E. Chandler. 2018. Drone Up! Quantifying Whale Behavior From a New Perspective Improves Observational Capacity. Frontiers in Marine Science: https://doi.org/10.3389/fmars.2018.00319.


A little help from my friends to study gray whales in Port Orford

By Lisa Hildebrand, PhD student, OSU Department of Fisheries, Wildlife, & Conservation Sciences, Geospatial Ecology of Marine Megafauna Lab

The 2021 TOPAZ (Theodolite Overlooking Predators And Zooplankton) field season in Port Orford has come to a close. Its close also signals the end of my tenure as field project lead, after I took over from my predecessor Florence Sullivan (OSU/GEMM Lab MSc grad) in the summer of 2018. Allison Dawn, incoming GEMM Lab Master’s student, is my successor and I am excited to pass the torch to her and see what new directions she will take the project. In today’s post, I will not recap the field season as I often do at the end of August. However, I strongly encourage you to read the blog posts written by the JASPER (Journey for Aspiring Scientists Pursuing Ecological Research) interns that made up Team “Heck Yeah”, Nadia Leal, Damian Amerman-Smith, and Jasen White, as they did an excellent job summarizing what we saw and experienced over the last six weeks. Instead, I want to take this opportunity to highlight a few people in Port Orford (and their most memorable gray whale encounters) who created a home away from home for me in Port Orford and played a large part in creating rich and meaningful experiences during my time as field project lead.

Tom Calvanese. Source: WildHuman.

Up first is Tom Calvanese, the OSU Port Orford Field Station manager. The field station can be an extremely busy place, especially during the summer when ideal weather conditions allow many marine scientists to conduct their research. There can be a lot of comings and goings at the field station, with swift turnarounds between groups and individuals from different departments and projects; some staying just one night, while others (such as the TOPAZ field teams) stay for several weeks. Leigh and I like to call Tom “the man behind the machine” because he manages to keep this busy field station running smoothly. From the get go, Tom has been a solid rock for me in Port Orford and he has never hesitated to give me the time and attention I needed, be it because I was seeking him out for advice about how to handle a personnel issue, a lesson in how to tie strong knots, or just a friendly conversation at the end of a long field day. I know that I have found a life-long friend and colleague in Tom through this project and for this I am very grateful.

One of Tom’s most iconic gray whale encounters happened when he was kayak fishing with a few friends in Tichenor Cove (coincidentally one of the two TOPAZ study sites). The individual kayakers were scattered throughout the cove, all in search of a good spot to hook some rockfish or lingcod. The group had not been out on the water for very long, which likely plays a large part in the shock and surprise that comes next, when Tom suddenly heard the blow of whale. He looked up from his fishing in the direction of the blow, only to see that a gray whale was surfacing right underneath one of his kayak fishing friends. Said friend could do nothing as he sat paralyzed in his kayak which slowly slid off the back of the gray whale as it dove once again. Neither whale nor human was harmed in this encounter, as the whale went back to foraging in the area, and the human (after several minutes of incredulity) went back to fishing. Every year, Tom has warned me of this location where this interaction happened (an uncharacteristically deep spot in Tichenor Cove compared to the rest of the area), though his warning is always accompanied with a twinkle in his eye.

An image captured by 2018’s Team “Whale Storm” aboard the kayak while sampling in Tichenor Cove, Port Orford. Source: GEMM Lab.
Dave Lacey. Source: L Hildebrand.

Dave Lacey owns South Coast Tours (SCT), a tour operating business that offers boat, kayak, and snorkeling tours, as well as surf lessons. Dave has been one of the most generous individuals to the TOPAZ/JASPER projects, never hesitating to loan us wetsuits and/or kayaks and allowing us to use his office and storage areas every day. He has also delivered excellent kayak paddle & safety instruction to the field teams over the last two years. Dave has truly become a vital partner during the Port Orford field seasons. It has been such a pleasure to be able to learn from and work with him, as well as see his business grow each year. Even though I will not be leading the project in Port Orford anymore, I am excited to continue my working relationship with Dave through obtaining important photo identification and sighting data of gray whales in the area when the GEMM Lab team is not there.

Although SCT is not even 10 years old (though it will be next year in 2022!), Dave has had so many gray whale encounters that he said it was really hard for him to pick just one. However, he ultimately picked the first time that he smelled a gray whale’s breath. It happened during a kayak tour when the group rounded the corner from Tichenor to Nellie’s Cove and a whale suddenly surfaced right in front of everyone, hitting them with the misty cloud of its blow. Up until this moment, Dave had both seen and heard hundreds of whale blows, but had never smelled one. He says, “to hear and see [the blow] is pretty normal but to get the third sense [of smell] is really phenomenal.”. Upon asking what he thinks of the smell, Dave replied that he does not think it is as gross as some people may think and during tours on his boat, the Black Pearl, he now actually tries to (safely) maneuver the boat downwind of the blow so that his clients can get a whiff as well.

The misty cloud emitted by whales when they come to the surface to breathe is referred to as the “blow”. Source: GEMM Lab.
Mike Baran. Source: L Hildebrand.

Mike Baran is a co-owner of Port Orford Sustainable Seafood (POSS) and he also occasionally guides kayak and snorkel tours for SCT. POSS is a community supported fishery that delivers wild, line-caught seafood direct from Port Orford to communities throughout western Oregon. I developed a great friendship with Mike through seeing him on the water a lot as a kayak guide for SCT in my first summer leading the TOPAZ/JASPER projects (2018), as well as seeing him at the field station on most days since POSS’ office and fish-processing facility are located there as well. If you are a keen follower of the GEMM Lab blog, you will know by now that the field season in Port Orford is short, yet very intense and taxing. Therefore, uplifting and sometimes goofy interactions with someone can really turn an upsetting day (potentially due to kayak gear loss or simply exhaustion) into a better one. Mike provided me with a lot of uplifting and goofy interactions and always helped put a smile on my face. 

As a SCT kayak guide, Mike has also had many gray whale encounters, however none are as memorable as the one he had on August 2nd, 2019. Mike describes it as a typical Port Orford day: “windy with lots of whale activity all morning”, though all of the activity had been at a distance (the whale blows were far away). Yet, on the paddle back through Tichenor Cove along the backside of the port jetty, Mike and his tour glimpsed a whale that was headstanding along the jetty rocks. The paddlers slowed down and kept their distance, watching as the gray whale foraged, diving down for 3-4 minutes at a time before resurfacing in almost the same location as it had surfaced in before. Suddenly, the whale surfaced right in the middle of the kayak group, with Mike to its left, a mere meter or so away, and the rest of the group to its right. Despite the fact that the sudden appearance of the whale scared the living daylights out of Mike, he was able to take a picture of the surfacing, which features one of the tour clients in the background with her hands lifted up to her face in total shock. So, thankfully for us the moment is not just eternalized in Mike’s memory but also in photographic form.

The photo of the gray whale that surfaced right next to Mike’s kayak, which also captured the shock & surprise of one of the tour clients in the background. Source: South Coast Tours.
Tara Ramsey. Source: L Hildebrand.

Last but certainly not least is Tara Ramsey, the coordinator of the Redfish Rocks Community Team since the summer of 2020. Despite arriving to Port Orford and her job in the middle of a pandemic, Tara has developed a lot of exciting new outreach and education material for the Redfish Rocks Marine Reserve, including an excellent walking tour of Port Orford (if you are ever there, I cannot recommend it highly enough – it starts at the Visitor Center!). While I have not known Tara as long as the other individuals featured in this blog, she has become a really great friend of mine, teaching me a lot about the reserve and Port Orford in general, including the best spot on Battle Rock beach for a small nighttime bonfire. 

Tara’s most memorable encounter with a gray whale is in fact her only encounter with a gray whale to date, and it happened just a few weeks ago when she was doing an Instagram livestream of the Redfish Rocks Marine Reserve aboard SCT’s Black Pearl. The purpose of the livestream was to bring the public into the reserve without having to leave the comfort and current safety of their homes. Tara describes the conditions in the reserve as “quite eerie” that day as there was a combination of smoke, fog, and no wind in the air. These conditions resulted in some pretty poor visibility, but gave the reserve an almost mystical appearance. Tara was actually mid-sentence on the livestream, talking about how special this moment was for her because it was her first time being in the reserve, when a whale surfaced a few meters from the boat. While the encounter was brief (the whale only surfaced 3 or 4 times before disappearing into the fog), Tara says the vision will be etched in her memory forever as Redfish Rocks is “a circle of islands, kind of like an amphitheater and it was amazing to see the whale just in the middle of it all.” 

An aerial view of Redfish Rocks Marine Reserve. Source: FishTracker.

I will miss being the field project lead of the TOPAZ and JASPER projects. I will miss kayaking every other day and spying on gray whales from the cliff site. I will miss having the opportunity to work closely with and train a new crop of aspiring marine scientists. I will miss my daily interactions with Tom, Dave, Mike, Tara, and many more individuals, when I do not go to Port Orford for six weeks next summer. I will cherish all the memories I have amassed over my last four summers in Port Orford for a very long time. Most of all, I will always be grateful to the gray whales that brought me back every summer and who (in a way) made all those memories happen.

PI Leigh Torres and Lisa at the end of the 2021 TOPAZ field season in Port Orford after the annual community presentation with Battle Rock Beach, Humbug Mountain, and Redfish Rocks Marine Reserve in the background. Source: L Torres.

The Unpredictable Nature of Field Work & a Mystery Mysid

By Jasen C. White, GEMM Lab summer intern, OSU senior, Department of Fisheries, Wildlife, and Conservation Sciences

Field work is predictably unpredictable. Even with years of experience and exhaustive planning, nature always manages to throw a few curveballs, and this gray whale foraging ecology field season is no exception. We are currently in our sixth week of data collection here in Port Orford, and we have been battling the weather, our equipment, and a notable lack of whales and their zooplankton prey. Throughout all of these setbacks, Team “Heck Yeah” has lived up to its mantra as we have approached each day ready to hit the ground running. When faced with any of our myriad of problems, we have managed to work collaboratively to assess our options and develop solutions to keep the project on track. 

For those of you that are unfamiliar with Port Orford, it is windy here, and when it is not, it can be foggy. Both of these weather patterns have the potential to make unsafe paddling conditions for our kayak sampling team. This summer we have frequently delayed or altered our field work routines to accommodate these weather patterns. Occasionally, we had to call off kayaking altogether as the winds and swell precluded us from maintaining our boat “on station” at the predetermined GPS coordinates during our samples, only for the winds to die down once we had returned to shore and completed the daily gear maintenance. Despite weather challenges, we have made the most of our data collection opportunities over these past six weeks, and we have only been forced to give up four total days of data collection. Flexibility to take advantage of the good weather windows when they arrive is the key!

Equipment issues can be even more unpredictable than the weather. The first major stumbling block for our equipment was a punctured membrane in the dissolved oxygen probe that we lower into the water at each of our twelve sample locations. This puncture was likely the result of a stray urchin’s spine that was in the wrong place at the wrong time. Soon after noticing the problem, we quickly rallied to refurbish the membrane, recalibrate the sensor, and design a protective housing using some plumbing parts from the local hardware store to prevent any future damage to the membrane (Figures 1a-d). Within 6 days, we were back up and running with the dissolved oxygen sensor.

Figure 1. a) Punctured dissolved oxygen sensor membrane; b) plans for constructing a protective housing for the sensor; c) the new protective housing for the dissolved oxygen sensor (yellow) is attached to the sensor array; d) intern Jasen White measuring seawater for the dissolved oxygen sensor calibration after replacing the punctured membrane. Source: A. Dawn

The next major equipment issue involved a GoPro camera whose mounting hardware snapped while being retrieved at a sample site. This event was captured on the camera itself (see below). Fortunately, thanks to our collaborators at the Oregon Institute of Marine Biology, we were soon able to recover the lost GoPro camera, and in the meantime, we relied on our spare to continue sampling. 

Figure 2. The steel cable of the downrigger used to deploy and retrieve our sensor array had worn down until only two strands remained intact. Source: J. White.

The most recent equipment problem was a fraying cable (Figure 2) on our downrigger. We use the downrigger as a winch to lower and raise our sensor array and zooplankton nets into the water to obtain our samples. Fortunately, keen eyes on our team noticed the fray before it fully separated while the sensor array was in the water which could have resulted in losing our gear. We were quickly able to find the necessary repair part locally and get back on the water to finish out our sample regime within an hour of noticing the problem. 

Finally, as Damian mentioned in his post last week, this season seemed to start much slower than the previous field seasons. In the early weeks, many of our zooplankton sampling nets repeatedly came up almost empty. There was often nothing but murky water to see in the GoPro videos that accompany the zooplankton samples. Likely due to the lack of prey, we have only managed to spot a couple of transitory whales that rarely entered our study area. Those few whales that we did observe were difficult to track as the relatively high winds and waves quickly dissipated the tell-tale blows and camouflaged their briefly exposed backs and flukes. 

Our determination and perseverance have recently started to pay off, however, as the prey abundance in at least some of our sample sites has begun to increase. This increase in prey has also corresponded to a slight increase in whale sightings. One whale even spent nearly 30 minutes around the sampling station that consistently yields the most prey, likely indicating foraging behavior. These modest increases in zooplankton prey and whale sightings provide more evidence in support of the hypothesis Damian mentioned last week that reduced whale abundance in the area is likely the result of low prey abundance.

Figure 3. Example of a previously unidentified mysid that dominates several of our zooplankton samples. Due to the unique fat and flat telson (the “tail”) portion, we have been affectionately calling these “beavertail” mysids. Source: J. White.

As the zooplankton abundance finally started to increase, we noticed an interesting shift in the kinds of prey that we are capturing compared to previous seasons. Donovan Burns, an intern from the 2019 field season, noted in his blog post that the two most common types of zooplankton they found in their samples were the mysid species Holmesimysis sculpta and members of the genus Neomysis. While Neomysis mysid shrimp are continuing to make up a large proportion of our prey samples this year, we have noticed that many of our samples are dominated by a different type of mysid shrimp (Figure 3) which, in previous years, was a very rare capture. After searching through several mysid identification guides, this unknown mysid appears to be a member of the genus Lucifer, identified based on the presence of some distinctive characteristics that are unique to this genus (Omori 1992). 

This observation is interesting because historically, Lucifer mysid shrimp are typically found in warmer tropical and subtropical waters and were rarely reported in the eastern North Pacific Ocean before the year 1992 (Omori 1992). Additionally, a key to common coastal mysid shrimp of Oregon, Washington, and British Columbia does not include members of the Lucifer genus, nor does it include any examples of mysids that resemble these new individuals showing up in our zooplankton nets (Daly and Holmquist 1986). If our initial identification of this mysid species is correct, then the sudden rise in the abundance of a typically warm water mysid species in Port Orford may indicate some fascinating shifts in oceanographic conditions that could lend some insight into why our prey and subsequent whale observations are so different this year than in years past.

Figure 4. View from the cliff site where we track gray whales using a theodolite. Source: A. Dawn.

As the 2021 field season draws to a close in Port Orford, I cannot help but reflect on what a wonderful opportunity we have been given through this summer internship program. I have loved the short time that I have spent living in this small but lively community for these past five weeks. Most days we could either be found kayaking around the nearshore to sample for the tiny creatures that our local gray whales call dinner, or we were on a cliff, gazing at the tirelessly beautiful, rugged coastline (Figure 4), hoping to glimpse the blow of a foraging whale so that we could track its course with our theodolite. Though the work can be physically exhausting during long and windy kayaking trips, mentally taxing when processing the data for each of the new samples after a full day of fieldwork, or incredibly frustrating with equipment failures, weather delays and shy whales, it is also tremendously satisfying to know that I contributed in a small but meaningful way to the mission of the GEMM Lab. I cannot imagine a better way to obtain the experience that my fellow interns and I have gained from this work, and I know that it will serve each of us well in our future ambitions.

References

Daly, K. L., and C. Holmquist. 1986. A key to the Mysidacea of the Pacific Northwest. Canadian Journal of Zoology 64:1201–1210.

Omori, M. 1992. Occurrence of Two Species of Lucifer (Dendrobranchiata: Sergestoidea: Luciferidae) off the Pacific Coast of America. Journal of Crustacean Biology 12:104–110.

Where are all the whales: Thoughts from the first half of the Port Orford project 2021

By Damian Amerman-Smith, Pacific High School senior, GEMM Lab summer intern

Left to right: Damian, Nadia, Jasen. The group scans the ocean looking for whales, while Damian puts on sunscreen. Source: A. Dawn. 

Growing up in Port Orford, a short ten-minute walk from the Pacific Ocean, has certainly shaped my life a lot. It has given me a great regard for the ocean, the diversity of life within it, and how life seems to bypass human derived borders in order to go wherever it can. I often marvel at all the beautiful, intricate ecosystems that are able to exist inside of our planet’s vast oceanic expanses. Along with my love of the ocean has come a great regard for marine mammals and the novelties of these animals that allow them to live entirely in the ocean despite not having gills. Every new discovery of these beautiful ocean creatures brings me such simple and pure joy, such as my very recent discovery that baleen whales have two blow holes. These blow holes look so peculiar on the top of their bodies, like a short upside-down nose. 

Photo of a gray whale’s blow hole. Source: NOAA.

My interest in the ocean and its inhabitants was a large part of what made me so enthused to take a part in the gray whale foraging ecology (GWFE) project in Port Orford this summer. When Elizabeth Kelly, my friend and a previous intern for the GWFE project mentioned her experiences from the previous summer, I was very happy when she put me in contact with Lisa Hildebrand and Leigh Torres so that I could apply to be an intern. Since then, I have been very ecstatically awaiting the beginning of the project and could hardly believe it when it finally began, and I was able to meet my fellow team members: Lisa Hildebrand, the PhD student who has been leading the GWFE project for the last four years; Allison Dawn, a Master’s student who is going to take over the project in Lisa’s stead; Nadia Leal, an OSU undergrad hoping to further pursue the field of marine biology; and Jasen White, an OSU undergrad whose time in the Navy has made him a very steeling presence while out on the water. 

The three weeks that we have spent together learning the procedures that make up the project have been well spent, teaching all of us a lot of new things, such as what a theodolite is, how to operate a dissolved oxygen sensor, and (for me) how to use Excel. The first two weeks were largely spent just learning about how we collect data and improving our field skills, but as we have become more comfortable with our skills, we have also begun looking beyond the procedures, towards the data itself and what it can mean. Primarily, we started to notice the distinct lack of gray whales and almost complete lack of zooplankton prey for any gray whales in the area to eat. 

A calm & beautiful, yet whale-less, view from the cliff site. Source: L. Hildebrand.

As we pass the halfway point in the project, we have only witnessed two whales inside our study area. While in the beginning it was not surprising that there were no whales, it has started to become concerning to me. We have a strong working hypothesis about why there have not been many whale sightings in our monitored sites of Mill Rocks and Tichenor’s Cove: there is not nearly enough zooplankton prey to attract them. Monday, August 9th is a good example to support this hypothesis. On that day, when we pulled up our sample net at Tichenor Cove station #1, we collected fifty-three individual Neomysis mysid shrimp, which are a tasty treat for gray whales. However, all the other prey samples from the remaining eleven kayak sampling stations had perhaps a maximum of five assorted zooplankton each, which is certainly not enough to attract the attention of such a large predator as Eschrichtius robustus (a gray whale). Unfortunately, we have yet to see much change in zooplankton prey availability in our sampling nets over the season so far, but we are hopeful that swarms of zooplankton in the area will resurge and the gray whales will begin using the area around the port as their August feeding grounds.

Our hopes aside, it is intriguing to think about why there has been so few zooplankton at our sampling sites. A main factor is likely the decrease of Port Orford’s kelp forests over the past few years. Kelp is very important to zooplankton, particularly mysids, as it allows them to seek shelter from predators. Declines in kelp forests have been documented all along the southern Oregon coast, and are believed to be fueled by many factors (ORKA, 2021). A combination of warming waters with decreasing amount of nutrients available to the kelp (Richardson 2008), and the increasing abundances of purple sea urchins that eat the kelp has vastly impacted the amount of kelp in the area. The decline in local kelp forests may be the reason that we are seeing fewer mysid swarms than in previous years. This reduced kelp and mysid availability could, in turn, be making Port Orford waters an unappetizing area for hungry whales to visit this year. While this trophic cascade is still just an educated hypothesis, it is important for us and others to keep watch on the situation, and to see how it changes. There are organizations such as the Oregon Kelp Alliance (ORKA) that are working hard to study why the kelp populations are hurting and how we can help. We will power through the season with the hopes that the gray whales will come. It is still very possible that the zooplankton will resurge and the whales will return with plenty to feed on.

References

Richardson, Anthony J. 2008. In hot water: zooplankton and climate change, ICES Journal of Marine Science, Volume 65, Issue 3, Pages 279–295, https://doi.org/10.1093/icesjms/fsn028

ORKA, 2021. “Kelp.” Oregon Kelp Alliancewww.oregonkelp.com/.

Food for thought: conscious reasoning among foraging gray whales

By Nadia Leal, GEMM Lab summer intern, OSU senior, Department of Fisheries, Wildlife, and Conservation Sciences

The OSU GEMM Lab gray whale foraging ecology project in Port Orford is in its seventh year of research. I have the honor to serve as a field assistant for the project as part of Team “Heck Yeah” for the summer 2021 field season. In doing so, I have been presented with the opportunity to take part in its enduring legacy. It is a legacy characterized by novel discovery, distinguished leadership, and endless adventure. These particular aspects motivated me to pursue this internship. Further, the desire to seek out gray whales (Eschrichtius robustus) — a species epitomizing the ability to exhibit resilience in the face of adversity after having experienced two unusual mortality events (UME) in the past two decades and having recovered from historically low population abundances due to whaling — sparked immeasurable excitement.

Figure 1. Nadia operating the theodolite to calculate the location of a gray whale. Source: A. Dawn.

The skills we are acquiring during this field season are essential to master so that I can pursue my aspirations of becoming a marine conservation biologist. For example, we have learned how to operate a theodolite, which is a surveying tool used regularly in marine mammal research to accurately calculate the location of cetaceans and track their movements (Figure 1). We are also learning how to operate a number of other research equipment, to navigate a tandem kayak using a GPS, to process various forms of data, and to identify gray whales! I have especially enjoyed collecting prey samples and navigating our tandem kayak, as kayaking is a summer tradition for my family and the opportunity to kayak in this context is certainly the high point of this internship. The kayak is named “Robustus” after the scientific name of the gray whale: Eschrichtius robustus! (Figure 2). 

Figure 2. Nadia navigating Robustus, the research kayak.

The Port Orford project aims to determine how gray whale foraging is affected by prey quantity and quality. In fact, gray whales exhibit specificity in their selection of prey on the basis of caloric content (Hildebrand 2020). I am particularly interested in the underlying implications these findings imply: the notion of conscious reasoning and decision-making by individual whales as they seek the most suitable prey for its dietary needs among other options to maximize its survivability. Are gray whales in possession of an awareness that allows them to exhibit intentional preference? Can the behavior be attributed to instinct and/or learned behavior, or to cognition comparable to human preference? These and similar questions are my motivation for studying the realm of marine mammal biology. These questions concern intelligence and evolution, which can be effectively investigated through an analysis of cetacean brain structure, as it likely has compelling relationships to their extensive behavioral abilities (Hof and Van Der Gucht 2007). 

For instance, the brain of the gray whale has expanded and developed extensively over evolutionary time in response to distinct selection pressures. Evidence affirms that the behavioral challenges associated with foraging exert strong selection pressures on the evolution of their brain size and structure (Muller and Montgomery 2019)! Selection pressures associated with social cognition are also believed to have contributed to such growth (Connor et al. 1998; Marino 2002; Shultz and Dunbar 2010 ). Further, their neural organization has increased in complexity, leading to greater function and usage of the cortical portion of the brain, which is the portion responsible for higher level activity (Oelschläger and Oelschläger 2002). 

Figure 3. Structure of humpback whale brain representative of baleen species used to infer about gray whales (Hof and Van Der Gucht 2007). 

Though research about baleen whale brain morphology is not as pervasive as that of toothed whales (due to increased susceptibility of toothed whales to captivity given the feasibility of their capture and subsequent analysis in lab/controlled setting), studies have indicated that the brain of baleen whales share similarities to those of humans (Wade et. al 2012). In particular, similarities exist in the frontal lobe of the brain, which is responsible for the complex activities of self-awareness, reasoning, and behavior, as well as for problem-solving and motivation (Hof and Van Der Gucht 2007) (Figure 3). These findings indicate that baleen whales, including the gray whale, have the capability to exhibit intentional preference and take part in conscious decision-making in the recognition of different prey species. The mechanisms responsible for how gray whales may discern prey likely involve a number of the sensory systems, differing in respect to spatial scale (Torres 2017). Thus, gray whales likely rely on various sensory methods, such as vision, sound perception/reception, chemoreception, or an oceanographic stimulus, at differing scales to locate and discern prey. The sensory method employed is dependent on their distance from prey. 

Though we cannot yet confirm whether and/or how gray whales are capable of distinguishing between prey species, what is certain, is that the gray whale is intelligent and quite similar to us. Moreover, they are representative of strength and endurance, providing lessons we can learn from and qualities we can embody. Despite the threats to the species from fishing gear entanglement, ship collisions, climate change, oil industry developments, and being historically hunted, they have remarkably persisted. Thus, we must ensure the existence of the gray whale so they too may thrive for the rest of time, with healthy lives and habitat that is rightfully theirs.

P.S. I would like to thank the GEMM Lab, Oregon State University, Shalynn Pack, Port Orford Sustainable Seafood, Port Orford Co-op, South Coast Tours, Nicki’s Knick Knacks, Leigh Torres, Lisa Hildebrand, Allison Dawn, Clara Bird, Tom Calvanese, Maddie English, Jasen White, and Damian Amerman-Smith for making the internship as special and memorable as it is/was. 

References

Connor, R. C., Mann, J., Tyack, P. L., and Whitehead, H. (1998). Social evolution in toothed whales. Trends in Ecology and Evolution, 13(6): 228– 232. doi: https://doi.org/10.1016/S0169‐5347(98)01326‐3 

Hildebrand, L. (2020). Tonight’s specials include mysids, amphipods, and more: an examination of the zooplankton prey of Oregon gray whales and its impact on foraging choices and prey selection. Master’s thesis, Oregon State University. 

Hof, P.R., and Van Der Gucht, E. (2007). Structure of the cerebral cortex of the humpback whale, Megaptera novaengliae(Cetacea, Mysticeti, Balaenopteridae). The Anatomical Record 290:1-31 doi: 10.1002/ar.a.20407

Marino, L. (2002). Convergence of complex cognitive abilities in cetaceans and primates. Brain, Behavior, and Evolution59: 21–32. doi:  https://doi. org/10.1159/000063731 

Oelschläger, H.A., and Oelschläger, J.S. (2002). Brains. In: Perrin WF, Wu¨ rsig B, Thewissen JGM, editors. Encyclopedia of marine mammals. San Diego, CA: Academic Press. p 133–158.            

Shultz, S., & Dunbar, R. (2010). Encephalization is not a universal macroevolutionary phenomenon in mammals but is associated with sociality. Proceedings of the National Academy of Sciences of the United States of America 107(50): 21582–21586. doi: https://doi.org/10.1073/ pnas.1005246107 

Torres, L.G. (2017). A sense of scale: foraging cetaceans’ use of scale-dependent multimodal sensory systems. Marine Mammal Science 33: 1170-1193. doi:  10.1111/mms.12426 

Wade, P.R., Reeves, R.R., and Mesnick, S.L. (2012). Social and behavioral factors in cetacean responses to overexploitation: are odontocetes less “resilient” than mysticetes?. The Journal of Marine Biology 2012: 1-15. doi:10.1155/2012/567276

Do gray whales count calories? New GEMM Lab publication compares energetic values of prey available to gray whales on two feeding grounds in the eastern North Pacific

By Lisa Hildebrand, PhD student, OSU Department of Fisheries, Wildlife, & Conservation Sciences, Geospatial Ecology of Marine Megafauna Lab

Predators have high energetic requirements that must be met to ensure reproductive success and population viability. For baleen whales, this task is particularly challenging since their foraging seasons are typically limited to short temporal windows during summer months when they migrate to productive high latitude environments. Foraging success is a balancing act whereby baleen whales must maximize the amount of energy they intake, while minimizing the amount of energy they expend to obtain food. Maximization of energy intake can be achieved by targeting the most beneficial prey. How beneficial a particular prey type (or prey patch) is can depend on a number of factors such as abundance, density, quality, size, and availability. Determining why baleen whales target particular prey types or patches is an important factor to enhance our understanding of their ecology and can ultimately aid in informing their management and conservation.

The GEMM Lab has several research projects in Newport and Port Orford, Oregon, on the Pacific Coast Feeding Group (PCFG), which is a sub-group of gray whales from the Eastern North Pacific (ENP) population. While ENP gray whales feed in the Bering, Chukchi, and Beaufort Seas (Arctic) in the summer months, the PCFG utilizes the range from northern California, USA to northern British Columbia, Canada. Our work to date has revealed a number of new findings about the PCFG including that they successfully gain weight during the summer on Oregon foraging grounds (Soledade Lemos et al. 2020). Furthermore, females that consistently use the PCFG range as their foraging grounds have successfully reproduced and given birth to calves (Calambokidis & Perez 2017). Yet, the abundance of the PCFG (~250 individuals; Calambokidis et al. 2017) is two orders of magnitude smaller than the ENP population (~20,000; Stewart & Weller 2021). So, why do more gray whales not use the PCFG range as their foraging grounds when it provides a shorter migration while also allowing whales to meet their high energetic requirements and ensure reproductive success? There are several hypotheses regarding this ecological mystery including that prey abundance, density, quality, and/or availability are higher in the Arctic than in the PCFG range, thus justifying the much larger number of gray whales that migrate further north for the summer feeding season. 

Figure 1. Locations of prey samples collected with a light trap (open circles) or opportunistic collections of surface swarms of crab larvae (black triangles) in Newport, along the Oregon coast in the Pacific Northwest coast of the United States.

Our recent paper in Frontiers in Marine Science addressed the hypothesis that prey quality in the Arctic is higher than that of PCFG prey. To test this hypothesis, we first determined the quality (energetic value) of nearshore Oregon zooplankton species that PCFG gray whales are assumed to feed on (based on observations of fine-scale spatial and temporal overlap of foraging gray whales and sampled zooplankton). We obtained prey samples from nearshore reefs along the Oregon coast (Figure 1) as part of the GRANITE project using a light trap, which is a modified water jug with a weight and two floats attached to it, allowing the trap to sit approximately 1 meter above the seafloor. The trap contained a light which attracted zooplankton and effectively captured epibenthic prey of gray whales. Traps were left to soak overnight in locations where gray whales had been observed feeding extensively and collected the following morning. After identifying each specimen to species level and sorting them into reproductive stages, we used a bomb calorimeter to determine the caloric content of each species by month, year, and reproductive stage. We then compared these values to the literature-derived caloric value of the predominant benthic amphipod species that  ENP gray whales feed on in the Arctic. These comparisons allowed us to extrapolate the caloric values gained from each prey type to estimated energetic requirements of pregnant and lactating female gray whales (Villegas-Amtmann et al. 2017). 

Figure 2. Median caloric content and interquartile ranges by (A) species, (B) reproductive stage, and (C) month. Sizes of the zooplankton images are scaled at actual ratios relative to one another.

So, what did we find? Our sampling along the Oregon coast revealed six predominant zooplankton species: two mysid shrimp (Neomysis rayiiHolmesimysis sculpta), two amphipods (Atylus tridensPolycheria osborni), and two types of crab larvae (Dungeness crab megalopae, porcelain crab larvae). These six Oregon prey species showed significant differences in their caloric values, with N. rayii and Dungeness crab megalopae having significantly higher calories per gram than the other prey species (Figure 2), though Dungeness crab megalopae stood out as the caloric gold mines for feeding gray whales in the PCFG range. Furthermore, month and reproductive stage also influenced  the caloric content of some prey species, with gravid (aka pregnant) female mysid shrimp significantly increasing in calories throughout the summer (Figure 3).

Figure 3. Caloric content of different reproductive stages as a function of day of year (DOY; ranging from June to October) for the mysids Holmesimysis sculpta and Neomysis rayii, and the amphipod Atylus tridens. A. tridens is only represented on one panel due to small sample size of this species for the empty brood pouch and gravid reproductive stages. Asterisks indicate significant regressions (p<0.05).

The comparison of our Oregon prey caloric values to the predominant Arctic amphipod (Ampelisca macrocephala) proved our hypothesis wrong:  Arctic amphipods do not have higher caloric value than Oregon prey, which would have help to explain why many more gray whales feed in the Arctic. We found that two Oregon prey species (N. rayii and Dungeness crab megalopae) have higher caloric values than A. macrocephala. If we translate the caloric contents of these prey to gray whale energetic needs, these differences mean that lactating and pregnant gray whales feeding in the PCFG area would need between 0.7-1.03 and 0.22-0.33 metric tons of prey less per day if they fed on Dungeness crab megalopae or N. rayii, respectively, than a whale feeding on Arctic A. macrocephala (Figure 4). 

Figure 4. Daily prey requirements (A: metric tons; B: number of individuals) needed by pregnant and lactating female gray whales to meet their energetic requirements on the foraging ground. Energetic requirement estimates obtained from Villegas-Amtmann et al. (2017). Note the logarithmic scale of y-axis in panel (B).

If quality were the only prey metric that gray whales used to evaluate which food to eat, then it would make very little sense for so many gray whales to migrate to the Arctic when there are prey types of equal and greater quality available to them in the PCFG range. However, quality is not the only metric that influences gray whale foraging decisions. We therefore posit that the abundance, density, and availability of benthic amphipods in the Arctic are higher than the prey species found in the PCFG range. In fact, knowledge of the pulsed reproductive cycle of Dungeness and porcelain crabs allows us to conclude that the larvae of these two species are only available for a few weeks in the late spring and early summer on the Oregon coast. While mysid shrimp, such as N. rayii, are continuously available in the PCFG range throughout the summer, they may occur in less dense and more patchy aggregations than Arctic benthic amphipods. However, current estimates of prey density and abundance for either region are not available, and we do not have data on the energetic costs of the different foraging strategies. While there are still several unknowns, we have documented that higher prey quality in the Arctic is not the reason for the difference in gray whale foraging ground use in the eastern North Pacific.

References

Calambokidis, J., & Perez, A. 2017. Sightings and follow-up of mothers and calves in the PCFG and implications for internal recruitment. IWC Report SC/A17/GW/04 for the Workshop on the Status of North Pacific Gray Whales (La Jolla: IWC).

Calambokidis, J., Laake, J., & Perez, A. 2017. Updated analysis of abundance and population structure of seasonal gray whales in the Pacific Northwest, 1996-2015. IWC Report SC/A17/GW/05 for the Workshop on the Status of North Pacific Gray Whales (La Jolla: IWC).

Soledade Lemos, L., Burnett, J. D., Chandler, T. E., Sumich, J. L., & Torres, L. G. 2020. Intra- and inter-annual variation in gray whale body condition on a foraging ground. Ecosphere 11(4):e03094.

Stewart, J. D., & Weller, D. W. 2021. Abundance of eastern North Pacific gray whales 2019/2020. Department of Commerce, NOAA Technical Memorandum NMFS-SWFSC-639. United States: NOAA. doi:10.25923/bmam-pe91.

Villegas-Amtmann, S., Schwarz, L. K., Gailey, G., Sychenko, O., & Costa, D. P. 2017. East or west: the energetic cost of being a gray whale and the consequence of losing energy to disturbance. Endangered Species Research 34:167-183.

Rock-solid GRANITE: Scaling the disturbance response of individual whales up to population level impacts

By Lisa Hildebrand, PhD student, OSU Department of Fisheries & Wildlife, Geospatial Ecology of Marine Megafauna Lab

Since early May, much of the GEMM Lab has been consumed by the GRANITE project, which stands for Gray whale Response to Ambient Noise Informed by Technology and Ecology. Two weeks ago, PhD student Clara Bird discussed our field work preparations, and since May 20th we have conducted five successful days of field work (and one unsuccessful day due to fog). If you are now expecting a blog about the data we have collected so far and whales we encountered, I am sorry to disappoint you. Rather, I want to take a big step back and provide the context of the GRANITE project as a whole, explain why this project and data collection is so important, and discuss what it is that we hope to achieve with our ever-growing, multidisciplinary dataset and team.

We use the Pacific Coast Feeding Group (PCFG) of gray whales that forage off the Oregon coast as our study system to better understand the ecological and physiological response of baleen whales to multiple stressors. Our field methodology includes replicate physiological and ecological sampling of this accessible baleen whale population with synoptic measurement of multiple types of stressors. We collect fecal samples for hormone analysis, conduct drone overflights of whales to collect body condition and behavioral data, record the ambient soundscape through deployment of two hydrophones, and conduct whale photo-identification to link all data streams to each individual whale of known sex, estimated age, and reproductive status. We resample these data from multiple individuals within and between summer foraging seasons, while exposed to different potential stressors occurring at different intensities and temporal periods and durations. The hydrophones are strategically placed with one in a heavily boat-trafficked (and therefore noisy) area close to the Port of Newport, while the second is located in a relatively calm (and therefore quieter) spot near the Otter Rock Marine Reserve (Fig. 1). These hydrophones provide us with information about both natural (e.g. killer whales, wind, waves) and anthropogenic (e.g. boat traffic, seismic survey, marine construction associated with PacWave wave energy facility development) noise that may affect gray whales. During sightings with whales, we also drop GoPro cameras and sample for prey to better understand the habitats where whales forage and what they might be consuming.

Figure 1. Map of GRANITE study area from Seal Rock to Lincoln City with gray whale sightings (yellow circles) and and fecal samples collected (red triangles) from the 2020 field season. Green stars represent the two hydrophone locations. Source: L. Torres.

GEMM Lab PI Dr. Leigh Torres initiated this research project in 2015 and established partnerships with acoustician Dr. Joe Haxel and (then) PhD student Dr. Leila Lemos. Since then, the team working on this project has grown considerably to provide expertise in the various disciplines that the project integrates. Leigh is currently joined at the GRANITE helm by 4 co-PIs: Dr. Haxel, endocrinologist Dr. Kathleen Hunt, biological statistician Dr. Leslie New, and physiologist Dr. Loren Buck. Drs. Alejandro Fernandez Ajo, KC Bierlich and Enrico Pirotta are postdoctoral scholars who are working on the endocrinology, photogrammetry, and biostatistical modelling components, respectively. Finally, Clara and myself are partially funded through this project for our PhD research, with Clara focusing on the links between behavior, body condition, individualization, and habitat, while I am tackling questions about the recruitment and site fidelity of the PCFG (more about these topics below). 

Faculty Research Assistant Todd Chandler supervises PhD student Clara Bird during her maiden drone flight over a whale. Source: L. Torres.

The ultimate goal of this project is to use the PCFG as a case study to quantify baleen whale physiological response to different stressors and model the subsequent impacts on the population by implementing our long-term, replicate dataset into a framework called Population consequences of disturbance (PCoD; Fig. 2). PCoD is built upon the underlying concept that changes in behavior and/or physiology caused by disturbance (i.e. noise) affect the fitness of individuals by impacting their health and vital rates, such as survival, reproductive success, and growth rate (Pirotta et al. 2018). These impacts at the individual level may (or may not) affect the population as a whole, depending on what proportion of individuals in the population are affected by the disturbance and the intensity of the disturbance effect on each individual. The PCoD framework requires quantification of four stages: a) the physiological and/or behavioral changes that occur as a result of exposure to a stressor (i.e. noise), b) the acute effects of these physiological and/or behavioral responses on individual vital rates, and their chronic effects via individual health, c) the way in which changes in health may affect the vital rates of individuals, and d) how changes in individual vital rates may affect population dynamics (Fig. 2; Pirotta et al. 2018). While four stages may not sound like a lot, the amount and longevity of data needed to quantify each stage is immense. 

Figure 2. Conceptual framework of the population consequences of disturbance (PCoD). Letters (A-D) represent the four stages that require quantification in order for PCoD to be implemented. Each colored box represents external (ecological drivers, stressors) and internal (physiology, health, vital rates, behavior) factors that can change over time that are measured for each individual whale (dashed grey boundary line). The effects are then integrated across all individuals in the population to project their effects on the population’s dynamics. Figure and caption adapted from Pirotta et al. 2018.

The ability to detect a change in behavior or physiology often requires an understanding of what is “normal” for an individual, which we commonly refer to as a baseline. The best way to establish a baseline is to collect comprehensive data over a long time period. With our data collection efforts since 2015 of fecal samples, drone flights and photo identification, we have established useful baselines of behavioral and physiological data for PCFG gray whales. These baselines are particularly impressive since it is typically difficult to collect repeated measurements of hormones and body condition from the same individual baleen whale across multiple years. These repeated measurements are important because, like all mammals, hormones and body condition vary across life history phases (i.e., with pregnancy, injury, or age class) and across time (i.e., good or bad foraging conditions). To achieve these repeated measurements, GRANITE exploits the high degree of intra- and inter-annual site fidelity of the PCFG, their accessibility for study due to their affinity for nearshore habitat use, and the long-term sighting history of many whales that provides sex and approximate age information. Our work to-date has already established a few important baselines. We now know that the body condition of PCFG gray whales increases throughout a foraging season and can fluctuate considerably between years (Soledade Lemos et al. 2020). Furthermore, there are significant differences in body condition by reproductive state, with calves and pregnant females displaying higher body conditions (Soledade Lemos et al. 2020). Our dataset has also allowed us to validate and quantify fecal steroid and thyroid hormone metabolite concentrations, providing us with putative thresholds to identify a stressed vs. not stressed whale based on its hormone levels (Lemos et al. 2020).

PhD student Lisa Hildebrand and GRANITE co-PI Dr. Kathleen Hunt collecting a fecal sample. Source: L. Torres.

We continue to collect data to improve our understanding of baseline PCFG physiology and behavior, and to detect changes in their behavior and physiology due to disturbance events. All these data will be incorporated into a PCoD framework to scale from individual to population level understanding of impacts. However, more data is not the only thing we need to quantify each of the PCoD stages. The implementation of the PCoD framework also depends on understanding several aspects of the PCFG’s population dynamics. Specifically, we need to know whether recruitment to the PCFG population occurs internally (calves born from “PCFG mothers” return to the PCFG) or externally (immigrants from the larger Eastern North Pacific gray whale population joining the PCFG as adults). The degree of internal or external recruitment to the PCFG population should be included in the PCoD model as a parameter, as it will influence how much individual level disturbance effects impact the overall health and viability of the population. Furthermore, knowing residency times and home ranges of whales within the PCFG is essential to understand exposure durations to disturbance events. 

To assess both recruitment and residency patterns of the PCFG, I am undertaking a large photo-identification effort, which includes compiling sightings and photo data across many years, regions, and collaborators. Through this effort we aim to identify calves and their return rate to the population, the rate of new adult recruits to the population, and the spatial residency of individuals in our study system. Although photo-id is a basic, commonplace method in marine mammal science, its role is critical to tracking individuals over time to understand population dynamics (in a non-invasive manner, no less). A large portion of my PhD research will focus on the tedious yet rewarding task of photo-id data management and matching in order to address these pressing knowledge gaps on PCFG population dynamics needed to implement the PCoD model that is an ultimate goal of GRANITE. I am just beginning this journey and have already pinpointed many analytical and logistical hurdles that I need to overcome. I do not anticipate an easy path to addressing these questions, but I am extremely eager to dig into the data, reveal the patterns, and integrate the findings into our rock-solid GRANITE project.  

Funding for the GRANITE project comes from the Office of Naval Research, the Department of Energy, Oregon Sea Grant, the NOAA/NMFS Ocean Acoustics Program, and the OSU Marine Mammal Institute.

References

Lemos, L.S., Olsen, A., Smith, A., Chandler, T.E., Larson, S., Hunt, K., and L.G. Torres. 2020. Assessment of fecal steroid and thyroid hormone metabolites in eastern North Pacific gray whales. Conservation Physiology 8:coaa110.

Pirotta, E., Booth, C.G., Costa, D.P., Fleishman, E., Kraus, S.D., Lusseau, D., Moretti, D., New, L.F., Schick, R.S., Schwarz, L.K., Simmons, S.E., Thomas, L., Tyack, P.L., Weise, M.J., Wells, R.S., and J. Harwood. 2018. Understanding the population consequences of disturbance. Ecology and Evolution 8(19):9934-9946.

Soledade Lemos, L., Burnett, J.D., Chandler, T.E., Sumich, J.L., and L.G. Torres. 2020. Intra- and inter-annual variation in gray whale body condition on a foraging ground. Ecosphere 11(4):e03094.

The Road to Oregon

By Imogen Lucciano, incoming graduate student, OSU Department of Fisheries, Wildlife and Conservation Sciences, Geospatial Ecology of Marine Megafauna Lab

There are moments in our individual lifetimes that we can define as noteworthy and right now, as I prepare to start my graduate career within the Marine Mammal Institute (MMI) at OSU, I would say this is it for me. As I sit down to write this blog and document how surreal my future adventure is, I simultaneously feel this path is felicitous. After a year of being cooped up due to COVID, time presently seems to be going by at rocket speed. I am moving constantly in through my day to continue running my current life, while simultaneously arranging all that will encompass my new life. And while I answer questions to my 10-year-old daughter who is doing geometry homework in the living room, while hollering “That is not yours!” to the kitchen where the recently adopted feral dog is sticking his entire head under the trash can lid, while arranging our books in a cardboard box at the packing station I set up on the dining room table, I cannot deny a sense of serenity. This moment in my life, becoming a part of the GEMM Lab and MMI, and relocating to Corvallis is great.

This moment’s noteworthiness is emphasized by embarking on probably the most variable-heavy road trip I have planned to date. Since the age of 19, when I left my small mountain town on the Appalachian trail in Pennsylvania, I have transferred locations ~20 times. Due to extensive travel while serving in the Army (various Army trainings and overseas mission deployments), I have bounced around the US and to other countries often. Over time, one becomes acclimated to the hectic nature of this sort of lifestyle, and yet this new adventure holds significance. 

So here are the details of the adventure trip that lies ahead: I will drive my 2002 Jeep Grand Cherokee across the country; from Charlottesville, Virginia to Corvallis, Oregon. My projected route will extend 2,822 miles and take ~43 driving hours total. The route will fall within the boundaries of 11 states (see Figure 1.)

 Figure 1. Blue Line indicates route from Charlottesville to Corvallis (Google Maps)

Attached to the hitch of the Jeep will be a 6×12 rented cargo trailer containing our treasured books, furniture and things. Inside the Jeep will be three living variables: Mia (the 10-year-old), Angus (hyperactive border collie/ pit bull mix) and Mr. Gibbs (feral pirate dog); all three will need to be closely monitored for potential hiccups in the plan.

If we are going to make it to our destination hotel/Airbnb each night of the trip, I must be organized and calculate road time each day while factoring in breaks to the loo and fueling up. These calculations need to be precise, with little margin for error. I cannot play it too safely either, or it will take us too long to get across the country (I must start my graduate work after all). On the other hand, I cannot realistically expect too many road hours in a day. I think at this point I have got it worked out (Table 1.)

Table 1. Driving Hours and Miles Per Day

When I look back on my career, I had no idea that my not-so-smooth road would lead me to my dream goal of studying marine mammals. I took the Army placement tests at the age of 19, which led me to the field of “information operations” where I earned a great knowledge base in data analysis and encountered fantastic leaders whom I might not have known otherwise. I learned immensely on this path and it set me up very well for moving forward into research and collaboration in the sciences. I am so grateful that my life took this journey because working in the military provided me with the utmost respect for my opportunities and greater empathy for others. This route had many extreme obstacles and was intensely intimidating at times, but I am all the better for it. And I was never able to shake the dream of where I wanted to be (see Figures 2 & 3.) Timing is everything.

Figure 2 & 3. Two of the images of the Pacific coast I have hung up in my house. Keeping my eye on the prize, so to speak. 

It will feel great to cross over the Oregon state line. I cannot wait to meet GEMM Lab in-person and all the other wonderful researchers and staff at MMI and Hatfield Marine Science Center. I am eager to step onto the RV Pacific Storm and begin my thesis research on the magnificent cetaceans off the Oregon coast, and hopefully do some good in the end. As I evaluate the logistics of my trip from Charlottesville to Corvallis, I feel relieved rather than overwhelmed. We could attribute this relief to my not-so-smooth road to get to where I am. Looking ahead, of course, I see a road that will require focus, attention, passion, care, and lots of fuel. Even if this road is not completely smooth, I will have my hands on 10 and 2, and feel so grateful and ready to be on it.