Feasts of junk food or morsels of fine dining: is prey quality or quantity more important to marine predators?

By Lisa Hildebrand, MSc student, OSU Department of Fisheries & Wildlife, Marine Mammal Institute, Geospatial Ecology of Marine Megafauna Lab

Knowing what and how much prey a predator feeds on are key components to better understanding and conserving that predator. Prey abundance and availability are frequently predictors for marine predator reproductive success and population dynamics. It is the reason why the GEMM Lab makes a concerted effort to not only track our main taxa of interest (marine mammals) but to simultaneously measure their prey. However, over the last decade or two, there has been increased recognition that prey quality is also highly important in understanding a predator’s ecology (Spitz et al. 2012). Optimal foraging theory is a widely accepted framework that posits that predators should attempt to maximize energy gained and minimize energy spent during a foraging event (Charnov 1976, Krebs 1978, Pyke 1984). Thus, knowledge of how valuable a prey item is in terms of its energetic content is an important part of the equation when applying optimal foraging theory to a predator of interest.

Ideally, the prey species with the highest energetic value would also be the easiest, most ubiquitous and least energetically expensive prey item to capture and consume, such that a predator truly could expend very little energy to get very high energetic rewards. However, it rarely is this straightforward. The caloric content of several marine prey species has been shown to increase with increasing size (e.g. Benoit-Bird 2004; Fig. 1), both length and weight. Yet, increasing size often also means increased mobility and, as a result, ability to evade and escape predation. Furthermore, increasing size also inherently means decreasing abundances – there will always be billions more krill in the ocean than whales based solely on cost of reproduction. Therefore, just based on sheer numbers, there are fewer big prey items, which increases the time between, and decreases the likelihood of, a predator encountering big prey items. So, there are clear trade-offs here. It may take longer to locate and capture a high value prey item, which costs more energy to capture, but the payout could potentially be much bigger. However, if a predator gambles too much, then their net energy expenditure to obtain high value prey may be higher than the net energy gained. Instead, it may be worth pursuing smaller prey items with lower energetic values, where discovery and capture success are higher and more frequent. However, in this case, many, many more pursuits are likely needed, thus costing more energy to meet daily energetic demands. 

Figure 1. Increasing caloric content with increasing length (a) and wet weight (b). Figures and caption reproduced from Benoit-Bird 2004.

Is your head spinning as much as mine? Let me try and simplify this complex web of interactions with a tangible example. Bowen et al. (2002) investigated foraging of harbor seals in Nova Scotia to assess prey profitability of different species. By attaching camera systems to the backs of 39 adult male harbor seals, the authors identified sand lance and flounder to be the most targeted prey species. However, there were significant differences in pursuit/handling cost per prey type (kJ/min) with sand lance only requiring 14.8 ± 2.7, whereas flounder required significantly more at 30.3 ± 7.9. Therefore, based solely on energy required to capture prey, the sand lance would seem to be the better option. In fact, to a certain degree, this hypothesis is actually true when we compare the energetic content of the two prey types. Sand lance have a higher energetic value at lengths of 10 and 15 cm (53.6 and 95.8 kJ, respectively) compared to flounder (22.6 and 88.6 kJ, respectively). So, the net gain of a harbor seal foraging on a 15 cm sand lance (assuming that it only takes 1 minute to catch the fish – this is more for explanatory purposes as it likely takes much longer for a harbor seal to capture a fish) would be 81 kJ. This gain is larger than that of a 15 cm flounder (58.3 kJ). However, once we compare these fish at 20 and 25 cm lengths, the flounder actually becomes the more beneficial prey item at 232.6 and 492.3 kJ, respectively, over the sand lance (158.1 and 233.8 kJ). Now, assuming once again that it only takes 1 minute to catch the fish, the harbor seal enjoys a net energetic gain of a whopping 462 kJ when capturing a 25 cm flounder compared to 219 kJ for a sand lance of the same size – that makes the flounder more than twice as profitable!

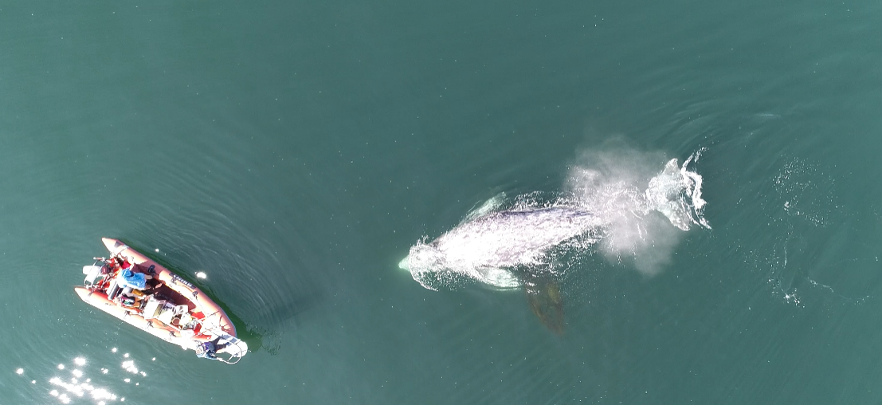
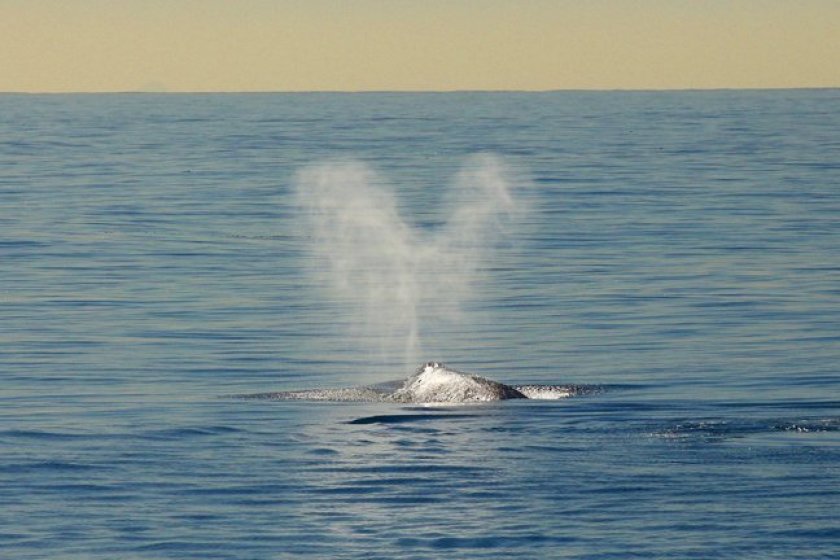
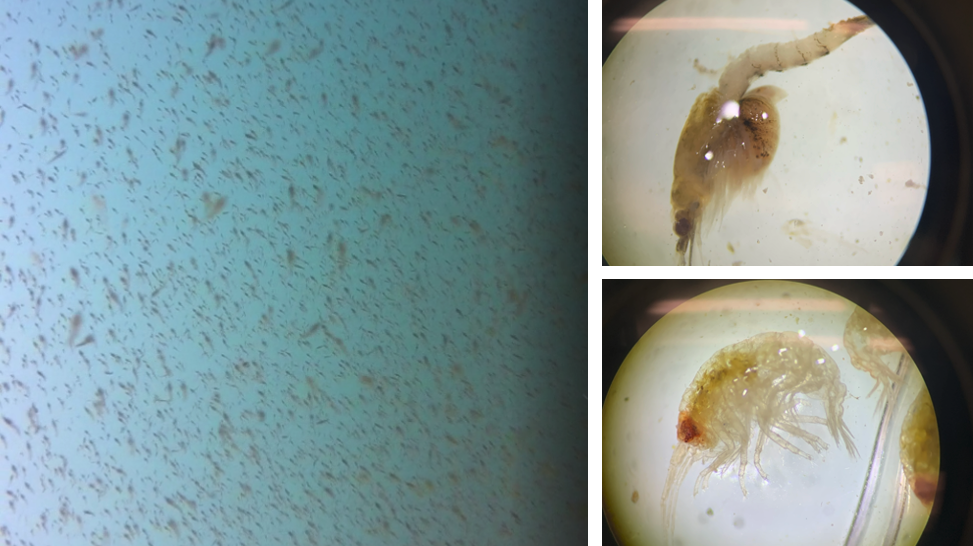
The Bowen et al. study is an excellent demonstration of the importance of considering the quality of prey items when studying the ecology of marine predators. However, the authors did not assess the relative availability of sand lance and flounder. Ideally, foraging ecology studies aimed at understanding prey choice would try to address both important prey metrics – quality and quantity. This goal is the exact aim of my second Master’s thesis chapter where I am investigating whether prey quality (determined through community composition and caloric content) or prey quantity (measured as relative density) is more important in driving fine-scale gray whale foraging behavior in Port Orford, Oregon (Fig. 2). This question can be simplified by asking does it matter more what prey is in an area, or how much prey there is in an area? Or we can relate it back to the title of this post by asking whether individual gray whales would rather attend a cheap all-you-can-eat buffet or an expensive fine-dining restaurant. I am unfortunately not quite done with my analyses yet (but I’m getting closer!) and therefore am not ready to answer these questions. However, I have done extensive research on this topic and therefore am in a position to briefly mention a few other studies that have investigated these questions for other marine predators. 

Figure 2. A question of what or how much. Left image: example of the screenshots we take to estimate relative prey density in Port Orford. Right images: two examples of the main prey species we find (top: mysid shrimp Neomysis rayii with a full brood pouch; bottom: amphipod Polycheria osborni).

Ludynia et al. (2010) explored reasons why African penguin (Spehniscus demersus) numbers have declined in Namibia. They found that after the collapse of pelagic fish stocks in the 1970s (including the principal penguin prey item, sardine), African penguins switched to feeding on bearded goby, which are considered a low-energy prey species. Bearded goby are relatively abundant along Namibia’s southern coast and as such, limited prey availability is not the reason for declining African penguin numbers. Therefore, the authors concluded that the low quality of bearded goby (compared to sardine) appears to be the reason for declining population trends  of the penguins. This study demonstrates that African penguins do better when eating at a fine-dining restaurant, rather than loading up a whole plate of junk food. 

Grémillet et al. (2004) studied the foraging effort and number of successful prey captures per foraging trip (yield) of great cormorants (Phalacrocorax carbo) in Greenland in relation to prey abundance and quality within their foraging areas. The authors radio-tracked 11 great cormorants during a total of 163 foraging trips to estimate foraging effort and yield. The study found that contrary to the authors’ hypothesis, great cormorants foraged in areas of low prey abundance where the average caloric value was also relatively low. Therefore, in this example, it would seem that the predator of interest prioritizes neither high quality nor quantity when foraging.

Haug et al. (2002) investigated the variations in minke whale (Balaenoptera acutorostrata) diet and body condition in response to ecosystem changes in the Barents Sea. The main prey item of minke whales in the Barents Sea is immature herring. However, when recruitment failure and subsequent weak cohorts leads to reduced availability of immature herring, minke whales switched their diet to other prey items such as krill, capelin, and sometimes other gadoid fish species. The authors found a correlation between body condition of minke whales and immature herring abundances, such that minke whales displayed a poor body condition during low immature herring abundances. However, in the years of low immature herring abundance, abundances of krill and capelin were not low. Therefore, similar to the Ludynia et al. (2010) study, it seems that minke whales in the Barents Sea also do better in years when the prey type of highest caloric value is the most abundant. However, decreases in high quality prey has not led to population declines in minke whales in the Barents Sea, indicating that they likely take advantage of high quantities of low quality prey, unlike the African penguins.

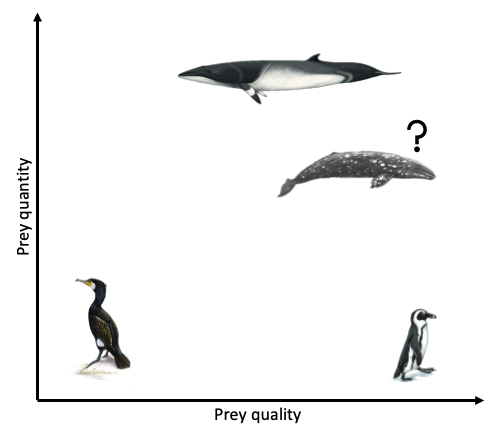
Clearly, the answer as to whether marine predators prefer quality over quantity is not simple and constant. Rather, prey preference varies based on predator needs and ecology, falling anywhere on a broad spectrum from low to high prey quality and low to high prey quantity (Fig. 3). To a certain extent, it probably also is not solely predator choice that determines what they eat but many other factors, such as climate, disturbance, and health. As a result, these preferences and choices will likely be fluid, rather than fixed. While I anticipate that individual gray whales will be flexible foragers, I do hypothesize that when there is a prey patch of a higher energetic value in the area, whales will preferentially consume these patches over areas where there is less energetically rich prey, even if it is more abundant. 

Figure 3. A spectrum of prey quantity and quality. Giant cormorants forage on low prey quality & quantity (Grémillet et al. 2004). African penguin populations are declining despite high abundances of low quality prey, suggesting that high prey quality is important for their survival (Ludynia et al. 2010). Body condition of Barents Sea minke whales decreases when high quality prey is less abundant, however their populations have not declined, suggesting they instead exploit high abundances of low quality prey (Haug et al. 2002). What will the gray whales do?

Literature cited

Benoit-Bird, K. J. 2004. Prey caloric value and predator energy needs: foraging predictions for wild spinner dolphins. Marine Biology 145:435-444.

Bowen, W. D., D. Tuley, D. J. Boness, B. M. Bulheier, and G. J. Marshall. 2002. Prey-dependent foraging tactics and prey profitability in a marine mammal. Marine Ecology Progress Series 244:235-245.

Charnov, E. L. 1976. Optimal foraging, the marginal value theorem. Theoretical Population Biology 9(2):129-136.

Grémillet D., G. Kuntz, F. Delbart, M. Mellet, A. Kato, J-P. Robin, P-E. Chaillon, J-P. Gendner, S-H. Lorentsen, and Y. Le Maho. 2004. Linking the foraging performance of a marine predator to local prey abundance. Functional Ecology 18(6):793-801.

Haug, T., U. Lindstrøm, and K. T. Nilssen. 2002. Variations in minke whale (Balaenoptera acutorostrata) diet and body condition in response to ecosystem changes in the Barents Sea. Sarsia 87(6):409-422. 

Krebs, J. R. 1978. Optimal foraging: decision rules for predators. Behvaioral Ecology: An Evolutionary Approach, eds. Krebs, J. R., and N. B. Davies. Oxford: Blackwell. 

Ludynia, J., J-P. Roux, R. Jones, J. Kemper, and L. G. Underhill. 2010. Surviving off junk: low-energy prey dominates  the diet of African penguins Spheniscus demersus at Mercury Island, Namibia, between 1996 and 2009. African Journal of Marine Science 32(3):563-572.

Pyke, G. H. 1984. Optimal foraging theory: a critical review. Annual Reviews of Ecology and Systematics 15:523-575.

Spitz, J., A. W. Trites, V. Becquet, A. Brind’Amour, Y. Cherel, R. Galois, and V. Ridoux. 2012. Cost of living dictates what whales, dolphins and porpoises eat: the importance of prey quality on predator foraging strategies. PLoS ONE 7(11):e50096.

Young, J. K., B. A. Black, J. T. Clarke, S. V. Schonberg, and K. H. Dunton. 2017. Abundance, biomass and caloric content of Chukchi Sea bivalves and association with Pacific walrus (Odobenus rosmarus divergens) relative density and distribution in the northeastern Chukchi Sea. Deep-Sea Research Part II 144:125-141.

What we know now about New Zealand blue whales

By Dawn Barlow, PhD student, OSU Department of Fisheries and Wildlife, Geospatial Ecology of Marine Megafauna Lab

For my PhD, I am using a variety of data sources and analytical tools to study the ecology and distribution of blue whales in New Zealand. I live on the Oregon Coast, across the world and in another season from the whales I study. I love where I live and I am passionate about my work, but I do sometimes feel removed from the whales and the ecosystem that are the focus of my research.

A pair of blue whales surface in the South Taranaki Bight region of New Zealand. Drone piloted by Todd Chandler during the 2017 field season.

Recently, I have turned my attention to processing acoustic data recorded in our study region in New Zealand between 2016 and 2018. In the fall, I developed detector algorithms to identify possible blue whale vocalizations in the recording period, and now I am going through each of the detections to validate whether it is indeed a blue whale call or not. Looking closely at spectrograms for hours and hours is a change of pace from the analysis and writing I have been doing recently. Namely, I am looking at biological signals – not lines of code and numbers on a screen, but depictions of sounds that blue whales produced. I have to say, it is the “closest” I have felt to these whales in a long time. Scrolling through thousands of spectrograms of blue whale calls leaves room for my mind to wander, and I recently had the realization that those whales have absolutely no idea that on the other side of the Pacific Ocean, there are a few scientists dedicating years of their lives to understand and protect them. Which led me to another realization: we know so much more about blue whales in New Zealand now than we did 10 years ago. In fact, we know so much more than we did even a year ago.

Screenshot of the process of reviewing blue whale D call detections in the acoustic analysis program Raven.

Nine years ago, Dr. Leigh Torres had a cup of coffee with a colleague who recounted observer reports of several blue whales during a seismic survey of the South Taranaki Bight region (STB) of New Zealand. This conversation sparked her curiosity, and led to the formulation of a hypothesis that the STB was in fact an unrecognized feeding ground for blue whales in the southern hemisphere (Torres 2013).

A blue whale surfaces in front of an oil rig in the South Taranaki Bight. Compiling opportunistic sightings like this one was an important step in realizing the importance of the region for blue whales. Photo by Deanna Elvines.

After three field seasons and several years of dedicated work, the hypothesis that the STB region is important for blue whales was validated. By drawing together multiple data streams and lines of evidence, we now know that New Zealand is home to a unique population of blue whales, which are genetically distinct from all other documented populations in the Southern Hemisphere. Furthermore, they use the STB for multiple critical life history functions such as feeding, nursing and calf raising, and they are present there year-round (Barlow et al. 2018).

Once we documented the New Zealand population, we were left with perhaps even more questions than we started with. Where do they feed, and why? Are they feeding and breeding there? Does their distribution change seasonally? What is the health of the population? Are they being impacted by industrial activity and human impacts such as noise in the region? We certainly do not have all the answers, but we have been piecing together an increasingly comprehensive story about these whales and their ecology.

For example, we now know that blue whales in New Zealand average around 19 meters in length, which we calculated by measuring images taken via drones and using an analysis program developed in the GEMM Lab (Burnett et al. 2018). The use of drones has opened up a whole new world for studying health and behavior in whales, and we recently used video footage to better understand the movement and kinematics of how blue whales engulf their krill prey. Furthermore, we know that blue whales may preferentially feed on dense krill aggregations at the surface, and that this surface feeding strategy may be an energetically favorable strategy in this part of the world (Torres et al. 2020).

We have also assessed one aspect of the health of blue whales by describing their skin condition. By analyzing thousands of photographs, we now know that nearly all blue whales in New Zealand bear the scars of cookie cutter shark bites, which they seem more likely to acquire at more northerly latitudes, and that 80% are affected by blister lesions (Barlow et al. 2019). Next, we are beginning to draw together multiple data streams such as body condition and hormone analysis, paired with skin condition, to form a detailed understanding about the health of this population.

Most recently we have produced a study describing how oceanography, prey and blue whales are connected within this region of New Zealand. The STB region is home to a wind-driven upwelling system that drives productivity and leads to aggregations of krill, which in turn provide sustenance for blue whales to feed on. By compiling data on oceanography and water column structure, krill availability, and blue whale distribution, we now have a solid understanding of this trophic pathway: how oceanography structures prey, and how blue whales respond to both prey and oceanography (Barlow et al. 2020). Furthermore, we are beginning to understand how those relationships may look under changing ocean conditions, with global sea temperatures rising and the increasing frequency and intensity of marine heatwaves.

The knowledge we have accumulated better enables managers to make informed decisions for the conservation of these blue whales and the ecosystem they inhabit. To me, there are several take-away messages from the story that continues to unfold about these blue whales. One is the importance of following a hunch, and then gathering the necessary tools and team to explore and tackle challenging questions. An idea that started over a cup of coffee and many years of hard work and dedication have led to a whole new body of knowledge. Another message is that the more questions you ask and the more questions you try to answer, the more questions you are often left with. That is a beautiful truth about scientific inquiry – the questions we ask drive the knowledge we uncover, but that process is never complete because new questions continue to emerge. Finally, it is easy to get swept up in details, outputs, timelines, and minutia, and every now and then it is important to take a step back. I have appreciated taking a step back and musing on the state of our knowledge about these whales, about how much we have learned in less than 10 years, and mostly about how many answers and new questions are still waiting to be uncovered.

A victorious field team celebrates a successful end to the 2017 field season with an at-sea sunset dance party. A good reminder of sunny, salty days on the water and where the data come from!

References

Barlow DR, Bernard KS, Escobar-Flores P, Palacios DM, Torres LG (2020) Links in the trophic chain: Modeling functional relationships between in situ oceanography, krill, and blue whale distribution under different oceanographic regimes. Mar Ecol Prog Ser.

Barlow DR, Pepper AL, Torres LG (2019) Skin Deep: An Assessment of New Zealand Blue Whale Skin Condition. Front Mar Sci.

Barlow DR, Torres LG, Hodge KB, Steel D, Baker CS, Chandler TE, Bott N, Constantine R, Double MC, Gill P, Glasgow D, Hamner RM, Lilley C, Ogle M, Olson PA, Peters C, Stockin KA, Tessaglia-hymes CT, Klinck H (2018) Documentation of a New Zealand blue whale population based on multiple lines of evidence. Endanger Species Res 36:27–40.

Burnett JD, Lemos L, Barlow DR, Wing MG, Chandler TE, Torres LG (2018) Estimating morphometric attributes on baleen whales using small UAS photogrammetry: A case study with blue and gray whales. Mar Mammal Sci.

Torres LG (2013) Evidence for an unrecognised blue whale foraging ground in New Zealand. New Zeal J Mar Freshw Res 47:235–248.

Torres LG, Barlow DR, Chandler TE, Burnett JD (2020) Insight into the kinematics of blue whale surface foraging through drone observations and prey data. PeerJ.

How we plan to follow whales

Clara Bird, Masters Student, OSU Department of Fisheries and Wildlife, Geospatial Ecology of Marine Megafauna Lab

The GEMM Lab gray whale team is in the midst of preparing for our fifth field season studying the Pacific Coast Foraging Group (PCFG): whales that forage off the coast of Newport, OR, USA each summer. On any given good weather day from June to October, our team is out on the water in a small zodiac looking for gray whales (Figure 1). When we find a gray whale, we try to collect photo ID data, fecal samples, drone data, and behavioral data. We use the drone data to study both the whale’s body condition and their behavior. In a previous blog, I described ethograms and how I would like to use the behavior data from drone videos to classify behaviors, with the ultimate goal of understanding how gray whale behavior varies across space, time, and by individual. However, this explanation of studying whale behavior is actually a bit incomplete. Before we start fieldwork, we first need to decide how to collect that data.

Figure 1. Image of GEMM lab team collecting gray whale UAS data. Image taken under NOAA/NMFS permit #16111

As observers, we are far from omnipresent and there is no way to know what the animals are doing all of the time. In any environment, scientists have to decide when and where to observe their animals and what behaviors they are interested in recording. In many studies, behavior is recorded live by an observer. In those studies, other limitations need to be taken into account, such as human error and observer fatigue. Collecting behavioral data is particularly challenging in the marine environment. Cetaceans spend most of their lives out of sight from humans, their time at the surface is brief, and when they appear together in large groups it can be very difficult to keep track of who is doing what when. Imagine being in a boat trying to keep track of what three different whales are doing without a pre-determined method – the task could quickly become overwhelming and biased. This is why we need a methodology for collecting and classifying behavior. We cannot study behavior without acknowledging these limitations and the potential biases that come with the methods we choose. Different data collection methods are better suited to address different questions.

The use of drones gives us the ability to record cetacean behavior non-invasively, from a perspective that allows greater observation (Figure 2, Torres et al. 2018), and for later review, which is a significant improvement. However, as we prepare to collect more behavior data, we need to study the methods and understand the benefits and disadvantages of each approach so that we capture the information we need without bias. Altmann (1974) provides a thorough overview of behavioral sampling methods.

Figure 2. Diagram illustrating “whale surface time” relative to “whale visible time” data as collected from an unmanned aerial systems (UAS) aircraft flying over a gray whale as it moves sequentially (from right to left) from “headstand” foraging to surfacing. Figure from Torres et al. (2018).

Ad libitum behavioral sampling has no structure and occurs when we find a group of whales and just write down everything they are doing. This method is a good first step, however it comes with bias.  Without structure, we cannot be sure that there was an equal probability of detecting each kind of behavior; this problem is called detectability bias. This type of bias is an issue if we are trying to answer questions about how often a behavior occurs, or what percent of time is spent in each behavior state. This is a bias to be especially concerned about when it comes to cetaceans because there are many examples of behaviors with different levels of detectability. An extreme example would be the detectability of breaching versus a behavior that takes place under the surface. A breaching whale is easier to spot and more exciting, which could lead to results suggesting that whales breach more often than they do relative to underwater behaviors. While it’s impossible to eliminate detectability bias, other sampling methods employ decision rules to try and reduce its effect. Many decision rules revolve around time, such as setting a minimum or maximum observation time interval. Other time rules involve recording the behavior state at set intervals of time (e.g., every 5 minutes). Setting observation boundaries helps standardize the methods and the data being collected.

In a structured sampling plan, the first big decision that needs to be addressed is the need to know the duration of behaviors. Point events do not include duration data but can be used to study the frequencies of behaviors. For example, if my research question was “Do whales perform “headstands” in a specific habitat type?”, then I would need point events of headstanding behavior. But, if I wanted to ask, “Do whales spend more time spent headstanding in a specific habitat type than in other habitat types?”, I would need headstanding to be a state event. State events are events with associated duration information and can be used for activity budgets. Activity budgets show how much time an animal spends in each behavior state. Some sampling methods focus on collecting only point events. However, to get the most complete understanding of behavior I think it’s important to collect both. Focal animal follows are another method of collecting more detailed data and is commonly used in cetacean studies.

The explanation of a focal follow method is in the name.  We focus on one individual, follow it, and record all of its behaviors. When employing this method, decisions are made about how an individual is chosen and how long it is followed. In some cases, the behavior of this animal is used as a proxy for the behavior of an entire group. I essentially use the focal follow method in my research. While I review drone footage to record behavioral data instead of recording behaviors live in the field, I focus on one individual a time as I go through the videos. To do this I use a software called BORIS (Friard and Gamba 2016) to mark the time of each behavior per individual (Figure 3). If there are three individuals in a video, I’ll review the footage three times to record behaviors once per individual, focusing on each in turn.

Figure 3. Screenshot of BORIS layout.

While the drone footage brings the advantages of time to review and a better view of the whale, we are constrained by the duration of a flight. Focal follows would ideally last longer than the ~15 minutes of battery life per drone flight. Our previously collected footage gives us snapshots of behavior, and this makes it challenging to compare and analyze durations of behaviors. Therefore, I am excited that we are going to try conducting drone focal follows this summer by swapping out drones when power runs low to achieve longer periods of video coverage of whale behavior. I’ll be able to use these data to move from snapshots to analyzing longer clips and better understanding the behavioral ecology of gray whales. As exciting as this opportunity is, it also presents the challenge of method development. So, I now need to develop decision rules and data collection methods to answer the questions that I have been eagerly asking.

References

Altmann, Jeanne. 1974. “Observational Study of Behavior: Sampling Methods.” Behaviour 49 (3–4): 227–66. https://doi.org/10.1163/156853974X00534.

Friard, Olivier, and Marco Gamba. 2016. “BORIS: A Free, Versatile Open-Source Event-Logging Software for Video/Audio Coding and Live Observations.” Methods in Ecology and Evolution 7 (11): 1325–30. https://doi.org/10.1111/2041-210X.12584.

Torres, Leigh G., Sharon L. Nieukirk, Leila Lemos, and Todd E. Chandler. 2018. “Drone up! Quantifying Whale Behavior from a New Perspective Improves Observational Capacity.” Frontiers in Marine Science 5 (SEP). https://doi.org/10.3389/fmars.2018.00319.

“Do Dolphins Get Hives?”: The Skinny on Allergies in Cetaceans

By: Alexa Kownacki, Ph.D. Student, OSU Department of Fisheries and Wildlife, Geospatial Ecology of Marine Megafauna Lab 

While sitting on my porch and watching the bees pollinate the blooming spring flowers, I intermittently pause to scratch the hives along my shoulders and chest. In the middle of my many Zoom calls, I mute myself and stop my video because a wave of pollen hits my face and I immediately have to sneeze. With this, I’m reminded: Welcome to prime allergy season in the Northern Hemisphere. As I was scratching my chronic idiopathic urticaria (hives caused by an overactive immune system), I asked myself “Do dolphins get hives?” I had no idea. I know most terrestrial mammals can and do—just yesterday, one of the horses in the nearby pasture was suffering from a flare of hives. But, what about aquatic and marine mammals? 

Springtime flowers blooming on the Central California Coast 2017. (Image Source: A. Kownacki)

As with most research on marine mammal health, knowledge is scare and is frequently limited to studies conducted on captive and stranded animals. Additionally, most of the current theories on allergic reactions in marine mammals are based on studies from terrestrial wildlife and humans. Because nearly all research on histamine pathways centers on terrestrial animals, I wanted to see what information exists the presence of skin allergies in marine mammals.  

Allergic reactions trigger a cascade within the body, beginning with the introduction of a foreign body, which for many people is pollen. The allergen binds to antibodies that are produced to fight potentially harmful substances. Once this allergen binds to different types of cells, including mast cells, chemicals like histamines are released. Histamines cause the production of mucus and constriction of blood vessels, and thus are the reason your eyes water, your nose runs, or you start coughing. 

Basic cartoon of an allergic reaction from exposure to the allergen to the reaction from the animal. (Image Source: Scientific Malaysian)

As you probably can tell just by looking at a marine mammal, they have thicker skin and fewer mucus membranes that humans, due to the fact that they live in the water. However, mast cells or mast cell-like cells have been described in most vertebrate lineages including mammals, birds, reptiles, amphibians, and bony fishes (Hellman et al. 2017, Reite and Evenson 2006). Mast cell-like cells have also been described in an early ancestor of the vertebrates, the tunicate, or sea squirt (Wong et al. 2014). Therefore, allergic-reaction cascades that may present as hives, red and itchy eyes or nose in humans, also exist in marine mammals, but perhaps cause different or less visible symptoms.  

Skin conditions in cetaceans are gathering interest within the marine mammal health community. Even our very own Dawn BarlowDr. Leigh Torres, and Acacia Pepper assessed the skin conditions in New Zealand blue whales in their recent publication. Most visible skin lesions or markings on cetaceans are caused by parasites, shark bits, fungal infections, and fishery or boat interactions (Leone et al. 2019, Sweeney and Ridgway 1985). However, there is very little scientific literature about allergic reactions in marine mammals, let alone cetaceans. That being said, I managed to find a few critical pieces of information supporting the theory that marine mammals do in fact have allergies that can produce dermal reactions similar to hives in humans.  

In one study, three captive bottlenose dolphins developed reddened skin, sloughing, macules, and wheals on their ventral surfaces (Monreal-Pawlowsky et al. 2017). The medical staff first noticed this atopic dermatitis in 2005 and observed the process escalate over the next decade. Small biopsy samples from the affected areas on the three dolphins coincided with the appearance of four pollens in the air within the geographic region: Betula, Pistacia, Celtis, and Fagus (Monreal-Pawlowsky et al. 2017). Topical prednisone treatments were applied to the affected areas at various dosages that slowly resolved the skin irritations. Researchers manufactured an allergy vaccine using a combination of the four pollens in hopes that it would prevent further seasonal outbreaks, but it was unsuccessful. In the coming years, the facility intends to adjust the dosages to create a successful vaccine.  

In the three top images, visible skin irritation including redness, macules, wheals, and sloughing are present. In the image below, the above animal was treated with methylprednisolone and the skin irritation subsides. (Monreal-Pawlowsky et al. 2017)

In addition to the above study, there is an unpublished case of suspected allergic reaction to another pollen that produces a pruritic reaction on the ventral areas of dolphins on a seasonal basis (Vicente Arribes, personal communication). Although there are only a few documented cases of environmentally-triggered allergic reactions that are visible on the dermal layer of cetaceans, I believe this evidence makes the case that some cetaceans suffer from allergies much like us. So, next time you’re enjoying the beautiful blooms and annoyingly scratch your eyes, know that you are not alone. 

Image Source: FurEver Family

Citations: 

Barlow DR, Pepper AL and Torres LG (2019) Skin Deep: An Assessment of New Zealand Blue Whale Skin Condition. Front. Mar. Sci. 6:757.doi: 10.3389/fmars.2019.00757 

Hellman LT, Akula S, Thorpe M and Fu Z (2017) Tracing the Origins of IgE, Mast Cells, and Allergies by Studies of Wild Animals. Front. Immunol. 8:1749. doi: 10.3389/fimmu.2017.01749 

Leone AB, Bonanno Ferraro G, Boitani L, Blasi MF. Skin marks in bottlenose dolphins (Tursiops truncatus) interacting with artisanal fishery in the central Mediterranean Sea. PLoS One. 2019;14(2):e0211767. Published 2019 Feb 5. doi:10.1371/journal.pone.0211767 

Monreal-Pawlowsky T, Fernández-Bellon H, Puigdemont A (2017) Suspected Allergic Reaction in Bottlenose Dolphins (Tursiops truncatus). J Vet Sci Ani Husb 5(1): 108. doi: 10.15744/2348-9790.5.108 

Reite OB, Evensen O. Inflammatory cells of teleostean fish: a review focusing on mast cells/eosinophilic granule cells and rodlet cells. Fish Shellfish Immunol (2006) 20:192–208. doi:10.1016/j.fsi.2005.01.012 

Sweeney, J. C., & Ridgway, S. H. (1975). Common diseases of small cetaceans. J. Am. Vet. Med. Assoc167(7), 533-540. 

Wong GW, Zhuo L, Kimata K, Lam BK, Satoh N, Stevens RL. Ancient originof mast cells. Biochem Biophys Res Commun (2014) 451:314–8. doi:10.1016/j.bbrc.2014.07.124 

You can’t build a pyramid without the base: diving into the foundations of behavioral ecology to understand cetacean foraging

By Lisa Hildebrand, MSc student, OSU Department of Fisheries & Wildlife, Marine Mammal Institute, Geospatial Ecology of Marine Megafauna Lab

The last two months have been challenging for everyone across the world. While I have also experienced lows and disappointments during this time, I always try to see the positives and to appreciate the good things every day, even if they are small. One thing that I have been extremely grateful and excited about every week is when the clock strikes 9:58 am every Thursday. At that time, I click a Zoom link and after a few seconds of waiting, I am greeted by the smiling faces of the GEMM Lab. This spring term, our Principal Investigator Dr. Leigh Torres is teaching a reading and conference class entitled ‘Cetacean Behavioral Ecology’. Every week there are 2-3 readings (a mix of book chapters and scientific papers) focused on a particular aspect of behavioral ecology in cetaceans. During the first week we took a deep dive into the foundations of behavioral ecology (much of which is terrestrial-based) and we have now transitioned into applying the theories to more cetacean-centric literature, with a different branch of behavior and ecology addressed each week.

Leigh dedicated four weeks of the class to discussing foraging behavior, which is particularly relevant (and exciting) to me since my Master’s thesis focuses on the fine-scale foraging ecology of gray whales. Trying to understand the foraging behavior of cetaceans is not an easy feat since there are so many variables that influence the decisions made by an individual on where and when to forage, and what to forage on. While we can attempt to measure these variables (e.g., prey, environment, disturbance, competition, an individual’s health), it is almost impossible to quantify all of them at the same time while also tracking the behavior of the individual of interest. Time, money, and unworkable weather conditions are the typical culprits of making such work difficult. However, on top of these barriers is the added complication of scale. We still know so little about the scales at which cetaceans operate on, or, more importantly, the scales at which the aforementioned variables have an effect on and drive the behavior of cetaceans. For instance, does it matter if a predator is 10 km away, or just when it is 1 km away? Is a whale able to sense a patch of prey 100 m away, or just 10 m away? The same questions can be asked in terms of temporal scale too.

What is that gray whale doing in the kelp? Source: F. Sullivan.

As such, cetacean field work will always involve some compromise in data collection between these factors. A project might address cetacean movements across large swaths of the ocean (e.g., the entire U.S. west coast) to locate foraging hotspots, but it would be logistically complicated to simultaneously collect data on prey distribution and abundance, disturbance and competitors across this same scale at the same time. Alternatively, a project could focus on a small, fixed area, making simultaneous measurements of multiple variables more feasible, but this means that only individuals using the study area are studied. My field work in Port Orford falls into the latter category. The project is unique in that we have high-resolution data on prey (zooplankton) and predators (gray whales), and that these datasets have high spatial and temporal overlap (collected at nearly the same time and place). However, once a whale leaves the study area, I do not know where it goes and what it does once it leaves. As I said, it is a game of compromises and trade-offs.

Ironically, the species and systems that we study also live a life of compromises and trade-offs. In one of this week’s readings, Mridula Srinivasan very eloquently starts her chapter entitled ‘Predator/Prey Decisions and the Ecology of Fear’ in Bernd Würsig’s ‘Ethology and Behavioral Ecology of Odontocetes’ with the following two sentences: “Animal behaviors are governed by the intrinsic need to survive and reproduce. Even when sophisticated predators and prey are involved, these tenets of behavioral ecology hold.”. Every day, animals must walk the tightrope of finding and consuming enough food to survive and ensure a level of fitness required to reproduce, while concurrently making sure that they do not fall prey to a predator themselves. Krebs & Davies (2012) very ingeniously use the idea of economic analysis of costs and benefits to understand foraging behavior (but also behavior in general). While foraging, individuals not only have to assess potential risk (Fig. 1) but also decide whether a certain prey patch or item is profitable enough to invest energy into obtaining it (Fig. 2).

Leigh’s class has been great, not only to learn about foundational theories but to then also apply them to each of our study species and systems. It has been exciting to construct hypotheses based on the readings and then dissect them as a group. As an example, Sih’s 1984 paper on the behavioral response race of predators and prey prompted a discussion on responses of predators and prey to one another and how this affects their spatial distributions. Sih posits that since predators target areas with high prey densities, and prey will therefore avoid areas that predators frequent, their responses are in conflict with one another. Resultantly, there will be different outcomes depending on whichever response dominates. If the predator’s response dominates (i.e. predators are able to seek out areas of high prey density before prey can respond), then predators and prey will have positively correlated spatial distributions. However, if the prey responses dominate, then the spatial distributions of the two should be negatively correlated, as predators will essentially always be ‘one step behind’ the prey. Movement is most often the determinant factor to describe the strength of these relationships.

Video 1. Zooplankton closest to the camera will jump or dart away from it. Source: GEMM Lab.

So, let us think about this for gray whales and their zooplankton prey. The latter are relatively immobile. Even though they dart around in the water column (I have seen them ‘jump’ away from the GoPro when we lower it from the kayak on several occasions; Video 1), they do not have the ability to maneuver away fast or far enough to evade a gray whale predator moving much faster. As such, the predator response will most likely always be the strongest since gray whales operate at a scale that is several orders of magnitude greater than the zooplankton. However, the zooplankton may not be as helpless as I have made them seem. Based on our field observations, it seems that zooplankton often aggregate beneath or around kelp. This behavior could potentially be an attempt to evade predators as the kelp and reef crevices may serve as a refuge. So, in areas with a lot of refuges, the prey response may in fact dominate the relationship between gray whales and zooplankton. This example demonstrates the importance of habitat in shaping predator-prey interactions and behavior. However, we have often observed gray whales perform “bubble blasts” in or near kelp (Video 2). We hypothesize that this behavior could be a foraging tactic to tip the see-saw of predator-prey response strength back into their favor. If this is the case, then I would imagine that gray whales must decide whether the energetic benefit of eating zooplankton hidden in kelp refuges outweighs the energy required to pursue them (Fig. 2). On top of all these choices, are the potential risks and threats of boat traffic, fishing gear, noise, and potential killer whale predation (Fig. 1). Bringing us back to the analogy of economic analysis of costs and benefits to predator-prey relationships. I never realized it so clearly before, but gray whales sure do have a lot of decisions to make in a day!

Video 2. Drone footage of a gray whale foraging in kelp and performing a “bubble blast” at 00:40. Footage captured under NMFS permit #21678. Source: GEMM Lab.

Trying to tease apart these nuanced dynamics is not easy when I am unable to simply ask my study subjects (gray whales) why they decided to abandon a patch of zooplankton (Were the zooplankton too hard to obtain because they sought refuge in kelp, or was the patch unprofitable because there were too few or the wrong kind of zooplankton?). Or, why do gray whales in Oregon risk foraging in such nearshore coastal reefs where there is high boat traffic (Does their need for food near the reefs outweigh this risk, or do they not perceive the boats as a risk?). So, instead, we must set up specific hypotheses and use these to construct a thought-out and informed study design to best answer our questions (Mann 2000). For the past few weeks, I have spent a lot of time familiarizing myself with spatial packages and functions in R to start investigating the relationships between zooplankton and kelp hidden in the data we have collected over 4 years, to ultimately relate these patterns to gray whale foraging. I still have a long and steep journey before I reach the peak but once I do, I hope to have answers to some of the questions that the Cetacean Behavioral Ecology class has inspired.

Literature cited

Krebs, J. R., and N. B. Davies. 2012. Economic decisions and the individual in Davies, N. B. et al., eds. An introduction to behavioral ecology. John Wiley & Sons, Oxford.

Mann, J. 2000. Unraveling the dynamics of social life: long-term studies and observational methods in Mann, J., ed. Cetacean societies: field studies of dolphins and whales. University of Chicago Press, Chicago.

Sih, A. 1984. The behavioral response race between predator and prey. The American Naturalist 123:143-150.

Srinivasan, M. 2019. Predator/prey decisions and the ecology of fear in Würsig, B., ed. Ethology and ecology of odontocetes. Springer Nature, Switzerland. 

Murre versus Penguin: Happy World Penguin Day!

Rachael Orben PhD, PI Seabird Oceanography Lab

Happy World Penguin Day (officially April 25th)!  I have been contemplating what to write for my tern at the GEMM lab blog. Most of my ideas were a little bit dark, but happily when I loaded my Twitter feed Saturday morning I was greeted with many beautiful photos of penguins and the hashtag #WorldPenguinDay so that inspired something more light hearted.

To be fair, it really should be Alcidae vs. Spheniscidae (scientific family names for auks and penguins). However, I have spent many months in the field studying murres (an alcid), and I find them fascinating. Soon it will be time for them to lay their eggs at colonies along the Oregon coast, including Yaquina Head. Murres have some amazing life history characteristics.

Some of the flamboyant alcid species found in the North Pacific. These species are all crevice or burrow nesters like some penguins including Magellanic, African, and little blue penguins.  

So how do murres stack up against penguins?

At first glance, murres and penguins are fairly similar. They are deep diving seabirds that forage on crustaceans and forage fish. Like murres, penguins have countershading, with black feathers on their backs and white feathers on their front. This coloring is thought to help provide camouflage when they are foraging (Cairns 1986).

There are two species of murres: common murres and thick-billed murres. Both species have a circumpolar distribution in the northern hemisphere with thick-billed murres nesting a colonies in the Arctic and common murres nesting in more temperate latitudes as far south as the central California coast. Their distributions overlap in the subarctic where they often share colonies (Irons et al. 2008).  

Movement

I am under the impression that one of the reasons people love penguins so much is because they waddle. Murres aren’t so graceful either, but they spend much less of their time walking around since they commute between the sea and their colonies by flying. However, murres have to work harder to fly than they do to dive (Elliott et al. 2013). This is because they have high wing-loading. Essentially, they have big bodies and relatively small wings that they use for flying through air and water. Bigger wings would be better for air, but smaller wings are better for moving through water.

Thick-billed murres flying home with fish, St. Paul Island, AK. Photo R. Orben

It really gets interesting when we start comparing the diving ability of alcids and penguins. Murres are the largest alcid species, and as dive depth scales with body size, they can dive the deepest. If we control for body size, alcids dive deeper then penguins (Burger 1991)! For instance, the deepest depth recorded from a thick-billed murres is 210 meters and the deepest dive of the smallest penguin (just a few hundred grams larger then the typical murre at ~1.5 kg), the little blue penguin, is a mere 69 meters (Penguiness.net).

Colonies & Nests

Murres typically nest in colonies on cliffs, off-shore sea stacks, and occasionally low lying predator free islands. Common murres use wider ledges and nest in very close proximity to each other while thick-billed murres prefer narrow ledges. Murres don’t build nests and simply lay their eggs on the rock ledge.

Common murres on Main Colony Rock at Yaquina Head, Newport Oregon. Photo R. Orben

Penguin nesting colonies can take a variety of forms. Colonies of the “brush-tailed” penguins (chinstrap, Adélie and gentoo penguins) are found in places that are snow free for most of the summer. These colonies tend to form as a meandering collection of sub-colonies.  These species build nests out of small rocks that they diligently collect. The rocks help keep their eggs out of snow meltwater. Emperor and king penguins stand together in a group. Burrow nesting penguins like Magellanic penguins can spread their colonies out across large areas where there is suitable habitat for burrowing.

A small portion of the Adélie penguin colony at Cape Crozier, Antarctica. Photo R. Orben

Eggs

Murres lay one large pyriform (pear-shaped) speckled egg that ranges in color from pale cream to brilliant turquoise. This variation allows them to recognize their own eggs (Gaston et al 1993)! The purpose of the shape of murre eggs is something that has been continually puzzled over, but the shape appears to help the blunt end stay cleaner, is stronger, and is more stable on sloping surfaces (Birkhead et al. 2017, 2018).

Predated thick-billed murre eggs collected at the top of the cliffs on St. George Island, AK. Photo R. Orben

In comparison, penguin eggs don’t look that remarkable. Many penguin species lay two eggs (e.g. Adélie, chinstrap, rockhopper, gentoo), but king penguins and emperor penguins will just lay one, incubating it on top of their feet. The first egg that macaroni penguins lay is 55-75% smaller than their second egg, potentially due to constraints imposed by migration (Crossin et al. 2010).

Song

Seabirds are not generally known for their melodious songs, but they are still an important part of their social lives. For this comparison I recommend an exploration of the Cornell Lab of Ornithology’s Macaulay Library. Start with the murres and then explore some penguin species. Recently it was discovered that penguins make short noises underwater (Thiebault 2019). Perhaps murres do as well.

If you are interesting a hearing a seabird that can sing, search for Light Mantled Sooty Albatross.

Parent-Offspring Relationship

Murres bring whole fish back to the colony to feed their chick. One fish for each trip. Murre chicks fledge before their flight feathers are fully grown. They jump from the cliffs and glide down to the ocean (hopefully) where they are joined by their male parent. Then the pair paddle out to find good foraging grounds. The male parent needs to feed the growing chick frequently and by bringing the chick to the food is able to meet these demands.

The male parent greets its newly fledged chick. Late evening on St. Paul Island, Alaska. Photo R. Orben

In contrast, penguins regurgitate their stomach contents to feed their offspring. They are able to carry large amounts of food this way. For instance a chinstrap penguin might bring back ~610 grams of food, almost 15% of its body weight (Miller et al. 2010). Adult penguins still have to balance their needs and the demands of their growing chicks. So the adults will leave their chicks alone once they are large enough. The chicks stand in groups known as créches to help protect them against predators like skuas.

Molt

Feather molt is an important part of all birds’ life histories. Feathers don’t last forever and need to be replaced. Both murres and penguins have unique strategies for replacing their feathers. For any flighted bird, replacing primary feathers is especially important. Murres become flightless during molt, which happens in the fall (Birkhead & Taylor 1977). This is actually thought to help their diving as with smaller wings they should be able to fly underwater more easily (Thompson et al. 1998). They replace their body feathers gradually to maintain waterproofing and warmth.

Penguins have solved this problem in another way. Instead of gradually replacing their feathers they undergo a “catastrophic molt” and replace all their feathers at once. Penguins need to be out of the water during this time and will fast, so it is advantageous to quickly grow a new coat of feathers. They too molt after their chicks are fledged.

I will let you decide which seabirds you find most fascinating, because really I find them all amazing and in need of our continued protection.  Thanks for reading!

References

Birkhead TR, Taylor AM (1977) Moult of the Guillemot Uria aalge. Ibis 119:80–85

Birkhead TR, Thompson JE, Jackson D, Biggins JD (2017) The point of a Guillemot’s egg. Ibis 159:255–265

Burger, A. E. (1991). Maximum diving depths and underwater foraging in alcids and penguins. In Studies of High-Latitude Seabirds. 1. Behavioural, Energetic and Oceanographic Aspects of Seabird Feeding Ecology (ed. W. A. Montevecchi and A. J. Gaston), pp. 9-15. Canada: Canadian Wildlife Service Occasional Paper.

Crossin GT, Trathan PN, Phillips RA, Dawson A, Le Bouard F, Williams TD (2010) A Carryover Effect of Migration Underlies Individual Variation in Reproductive Readiness and Extreme Egg Size Dimorphism in Macaroni Penguins. Am Nat 176:357–366

Elliott KH, Ricklefs RE, Gaston AJ, Hatch SA, John R Speakmane F, Davoren GK (2013) High flight costs, but low dive costs, in auks support the biomechanical hypothesis for flightlessness in penguins. PNAS:9380–9384

Irons DB, Anker-Nilssen T, Gaston AJ, Byrd GV, Falk K, Gilchrist G, Hario M, Hjernquist M, Krasnov YV, Mosbech A, Olsen B, Petersen A, Reid JB, Robertson GJ, Strøm H, Wohl KD (2008) Fluctuations in circumpolar seabird populations linked to climate oscillations. Global Change Biology 14:1455–1463

Miller AK, Kappes MA, Trivelpiece SG, Trivelpiece WZ (2010) Foraging-Niche Separation of Breeding Gentoo and Chinstrap Penguins, South Shetland Islands, Antarctica. The Condor 112:683–695

Thiebault A (2019) First evidence of underwater vocalizations in hunting penguins. PeerJ:1–16

Thompson CW, Wilson ML, Melvin EF, Pierce DJ (1998) An unusual sequence of flight-feather molt in Common Murres and its evolutionary implications. The Auk 115:653–669

Snacks at the surface: New GEMM Lab publication reveals insights into blue whale surface foraging through drone observations and prey data

By Dawn Barlow, PhD student, OSU Department of Fisheries and Wildlife, Geospatial Ecology of Marine Megafauna Lab

As the largest animals on the planet, blue whales have massive prey requirements to meet energy demands. Despite their enormity, blue whales feed on a tiny but energy-rich prey source: krill. Furthermore, they are air-breathing mammals searching for aggregations of prey in the expansive and deep ocean, and must therefore budget breath-holding and oxygen consumption, the travel time it takes to reach prey patches at depth, the physiological constraints of diving, and the necessary recuperation time at the surface. Additionally, blue whales employ an energetically demanding foraging strategy known as lunge feeding, which is only efficient if they can locate and target dense prey aggregations that compensate for the energetic costs of diving and lunging. In our recent paper, published today in PeerJ, we examine how blue whales in New Zealand optimize their energy use through preferentially feeding on dense krill aggregations near the water’s surface.

Figure 1. A blue whale lunges on a dense aggregation of krill at the surface. Note the krill jumping away from the mouth of the onrushing whale. UAS piloted by Todd Chandler.
Figure 2. Survey tracklines in 2017 in the South Taranaki Bight (STB) with locations of blue whale sightings, and where surface lunge feeding was observed, denoted. Inset map shows location of the STB within New Zealand. Figure reprinted from Torres et al. 2020.

To understand how predators such as blue whales optimize foraging strategies, knowledge of predator behavior and prey distribution is needed. In 2017, we surveyed for blue whales in New Zealand’s South Taranaki Bight region (STB, Fig. 2) while simultaneously collecting prey distribution data using an echosounder, which allowed us to identify the location, depth, and density of krill aggregations throughout the region. When blue whales were located, we observed their behavior from the research vessel, recorded their dive times, and used an unmanned aerial system (UAS; “drone”) to assess their body condition and behavior.

Much of what is known about blue whale foraging behavior and energetics comes from extensive studies off the coast of California, USA using accelerometer tags to track fine-scale kinematics (i.e., body movements) of the whales. In the California Current, the krill species targeted by blue whales are denser at depth, and therefore blue whales regularly dive to depths of 300 meters to lunge on the most energy-rich prey aggregations. However, given the reduced energetic costs of feeding closer to the surface, optimal foraging theory predicts that blue whales should only forage at depth when the energetic gain outweighs the cost. In New Zealand, we found that blue whales foraged where krill aggregations were relatively shallow and dense compared to the availability of krill across the whole study area (Fig. 3). Their dive times were quite short (~2.5 minutes, compared to ~10 minutes in California), and became even shorter in locations where foraging behavior and surface lunge feeding were observed.

Figure 3. Density contours comparing the depth and density (Sv) of krill aggregations at blue whale foraging sightings (red shading) and in absence of blue whales (gray shading). Density contours: 25% = darkest shade, 755 = medium shade, 95% = light shade. Blue circles indicate krill aggregations detected within 2 km of the sighting of the UAS filmed surface foraging whale analyzed in this study. Figure reprinted from Torres et al. 2020.
Figure 4. Kinematics of a blue whale foraging dive derived from a suction cup tag. Upper panel shows the dive profile (yellow line), with lunges highlighted (green circles), superimposed on a prey field map showing qualitative changes in krill density (white, low; blue, medium; red, high). The lower panels show the detailed kinematics during lunges at depth. Here, the dive profile is shown by a black line. The orange line shows fluking strokes derived from the accelerometer data, the green line represents speed estimated from flow noise, and the grey circles indicate the speed calculated from the vertical velocity of the body divided by the sine of the body pitch angle, which is shown by the red line. Figure and caption reprinted from Goldbogen et al. 2011.

Describing whale foraging behavior and prey in the surface waters has been difficult due to logistical limitations of conventional data collection methods, such as challenges inferring surface behavior from tag data and quantifying echosounder backscatter data in surface waters. To compliment these existing methods and fill the knowledge gap surrounding surface behavior, we highlight the utility of a different technological tool: UAS. By analyzing video footage of a surface lunge feeding sequence, we obtained estimates of the whale’s speed, acceleration, roll angle, and head inclination, producing a figure comparable to what is typically obtained from accelerometer tag data (Fig. 4, Fig. 5). Furthermore, the aerial perspective provided by the UAS provides an unprecedented look at predator-prey interactions between blue whales and krill. As the whale approaches the krill patch, she first observes the patch with her right eye, then turns and lines up her attack angle to engulf almost the entire prey patch through her lunge. Furthermore, we can pinpoint the moment when the krill recognize the impending danger of the oncoming predator—at a distance of 2 meters, and 0.8 seconds before the whale strikes the patch, the krill show a flee response where they leap away from the whale’s mouth (see video, below).

Figure 5. Body kinematics during blue whale surface lunge feeding event derived from Unmanned Aerial Systems (UAS) image analysis. (A) Mean head inclination and roll (with CV in shaded areas), (B) relative speed and acceleration, and (C) distance from the tip of the whale’s rostrum to the nearest edge of krill patch. Blue line on plots indicate when krill first respond to the predation event, and the purple dashed lines indicate strike at time = 0. The orange lines indicate the time at which the whale’s gape is widest, head inclination is maximum, and deceleration is greatest. Figure reprinted from Torres et al. 2020

In this study, we demonstrate that surface waters provide important foraging opportunities and play a key role in the ecology of New Zealand blue whales. The use of UAS technology could be a valuable and complimentary tool to other technological approaches, such as tagging, to gain a comprehensive understanding of foraging behavior in whales.

To see the spectacle of a blue whale surface lunge feeding, we invite you to take a look at the video footage, below:

The publication is led by GEMM Lab Principal Investigator Dr. Leigh Torres. I led the prey data analysis portion of the study, and co-authors include our drone pilot extraordinaire Todd Chandler and UAS analysis guru Dr. Jonathan Burnett. We are grateful to all who assisted with fieldwork and data collection, including Kristin Hodge, Callum Lilley, Mike Ogle, and the crew of the R/V Star Keys (Western Workboats, Ltd.). Funding for this research was provided by The Aotearoa Foundation, The New Zealand Department of Conservation, The Marine Mammal Institute at Oregon State University, Greenpeace New Zealand, OceanCare, Kiwis Against Seabed Mining, The International Fund for Animal Welfare, and The Thorpe Foundation.

Read Oregon State University’s press release about the publication here.

Whale blow: good for more than spotting whales

Clara Bird, Masters Student, OSU Department of Fisheries and Wildlife, Geospatial Ecology of Marine Megafauna Lab

Whale blow, the puff of air mixed with moisture that a whale releases when it comes to the surface, is a famously thrilling indicator of the presence of a whale. From shore, spotting whale blow brings the excitement of knowing that there are whales nearby. During boat-based field work, seeing or hearing blow brings the rush of adrenaline meaning that it’s game time. Whale blow can also be used to identify different species of whales, for example gray whale blow is heart shaped (Figure 1). However, whale blow can be used for more than just spotting and identifying whales. We can use the time between blows to study energetics.

Figure 1. Gray whale blow is often heart shaped (when there is very little wind). Source: https://www.lajollalight.com/sdljl-natural-la-jolla-winter-wildlife-2015jan08-story.html

A blow interval is the time between consecutive blows when a whale is at the surface (Stelle, Megill, and Kinzel 2008). These are also known as short breath holds, whereas long breath holds are times between surfacings (Sumich 1983).  Sumich (1983) hypothesized that short breath holds lead to efficient rates of oxygen use. The body uses oxygen to create energy, so “efficient rate of oxygen use” means that longer breath holds do not use much more oxygen and subsequently do not produce more energy.  Surfacings, during which short blow intervals occur, are often thought of as recovery periods for whales. Think of it this way, when you sprint, immediately afterwards you typically need to take a break to just breathe and recover.

We hypothesize that we can use blow intervals as a measure of how strenuous an activity is; shorter blow intervals may indicate that an activity is more energetically demanding (Wursig, Wells, and Croll 1986). Let’s go back to the sprinting analogy and compare the energetic demands of walking and running. Imagine I asked you to walk for five minutes, stop and measure the time between each breath, and then run for five minutes and do the same; after running, you would likely breathe more heavily and take more breaths with less time between them. This result indicates that running is more demanding, which we already know because we can do other experiments with humans to study metabolic rate and related metrics. In the case of gray whales, we cannot do experiments in the same way, but we can use the same analogy. Several studies have examined how blow intervals differ between travelling and foraging.

Wursig, Wells, and Croll (1986) measured blow interval, surfacing time, and estimated dive depth and duration of gray whales in Alaska from a boat during the foraging season. They found that blow intervals were shorter during feeding. They also found that the number of blows per surfacing increased with increasing depth. Overall these findings suggest that during the foraging season, feeding is more strenuous than other behaviors and that deeper dives may be more physiologically stressful.

Stelle, Megill, and Kinzel (2008) studied gray whales foraging off of British Columbia, Canada. They found shorter blow intervals during foraging, intermediate blow intervals during searching, and longer blow intervals during travelling. Interestingly, within feeding behaviors, they found a difference between whales feeding on mysids (krill-like animals that swim in the water column) and whales feeding benthically on amphipods. They found that whales feeding on mysids made more frequent but shorter dives with short blow intervals at surface, while whales feeding benthically had longer dives with longer blow intervals. They hypothesized that this difference in surfacing pattern is because mysids might scatter when disturbed, so gray whales surface more often to allow the mysids swarm to reform. These studies inspired me to start investigating these same questions with my drone video data.

As I review the drone footage and code the behaviors I also mark the time of each blow. I’ve done some initial video coding and using this data I have started to look into differences in blow intervals. As it turns out, we see a similar difference in blow interval relative to behavior state in our data: whales that are foraging have shorter blow intervals than when traveling (Figure 2). It is encouraging to see that our data shows similar patterns.

Figure 2. Boxplot of mean blow interval per sighting of foraging whales and travelling whales.

Next, I would like to examine how blow intervals differ between foraging tactics. A significant part of my thesis is dedicated to studying specific foraging tactics. The perspective from the drone allows us to identify behaviors in greater detail than studies from shore or boat (Torres et al. 2018), allowing us to dig into the differences between the different foraging behaviors. The purpose of foraging is to gain energy. However, this gain is a net gain. To understand the different energetic “values” of each tactic we need to understand the cost of each behavior, i.e. how much energy is required to perform the behavior. Given previous studies, maybe blow intervals could help us measure this cost or at least compare the energetic demands of the behaviors relative to each other. Furthermore, because different behaviors are likely associated with different prey types (Dunham and Duffus 2001), we also need to understand the different energetic gains of each prey type (this is something that Lisa is studying right now, check out the COZI project to learn more). By understanding both of these components – the gains and costs – we can understand the energetic tradeoffs of the different foraging tactics.

Another interesting component to this energetic balance is a whale’s health and body condition. If a whale is in poor health, can it afford the energetic costs of certain behaviors? If whales in poor body condition engage in different behavior patterns than whales in good body condition, are these patterns explained by the energetic costs of the different foraging behaviors? All together this line of investigation is leading to an understanding of why a whale may choose to use different foraging behaviors in different situations. We may never get the full picture; however, I find it really exciting that something as simple and non-invasive as measuring the time between breaths can contribute such a valuable data stream to this project.

References

Dunham, Jason S., and David A. Duffus. 2001. “Foraging Patterns of Gray Whales in Central Clayoquot Sound, British Columbia, Canada.” Marine Ecology Progress Series 223 (November): 299–310. https://doi.org/10.3354/meps223299.

Stelle, Lei Lani, William M. Megill, and Michelle R. Kinzel. 2008. “Activity Budget and Diving Behavior of Gray Whales (Eschrichtius Robustus) in Feeding Grounds off Coastal British Columbia.” Marine Mammal Science 24 (3): 462–78. https://doi.org/10.1111/j.1748-7692.2008.00205.x.

Sumich, James L. 1983. “Swimming Velocities, Breathing Patterns, and Estimated Costs of Locomotion in Migrating Gray Whales, Eschrichtius Robustus.” Canadian Journal of Zoology 61 (3): 647–52. https://doi.org/10.1139/z83-086.

Torres, Leigh G., Sharon L. Nieukirk, Leila Lemos, and Todd E. Chandler. 2018. “Drone up! Quantifying Whale Behavior from a New Perspective Improves Observational Capacity.” Frontiers in Marine Science 5 (SEP). https://doi.org/10.3389/fmars.2018.00319.

Wursig, B., R. S. Wells, and D. A. Croll. 1986. “Behavior of Gray Whales Summering near St. Lawrence Island, Bering Sea.” Canadian Journal of Zoology 64 (3): 611–21. https://doi.org/10.1139/z86-091.

Humans Hide and Wildlife Thrive: Human-mediated ecosystem changes during a pandemic

By: Alexa Kownacki, Ph.D. Student, OSU Department of Fisheries and Wildlife, Geospatial Ecology of Marine Megafauna Lab

We live in an interesting time. Many of us academic scientists sit in the confines of our homes, reading scientific papers, analyzing years-worth of data, working through a years-worth of house projects, or simply watching Netflix. While we are confined to a much smaller area, wildlife is not.  

During this challenging situation we have unique opportunities to study what happens when people are not outside for recreation. All of us who feel trapped inside our homes are not only saving human lives, we are changing ecosystems. Humans are constantly molding our ecosystems on fine and grand scales, from xeriscaping our lawns with native, drought-resistant plants to developing large plots of land for new homes. We manipulate nature, for better or for worse.

So, what happens when we change our behavior? Rather than driving, we’re gardening, instead of playing at parks, we’re playing board games at our kitchen tables; we as a society are completely changing our habitat-use patterns. When any top predator changes its habitat-use, switches niches, or drastically changes its behaviors, there are top-down ecosystem effects. When one species changes its behavior, there are major downstream impacts on predation, foraging, diet, and habitat use. For example, when bluegill sunfish underwent large shifts in both diet and habitat, major predator-mediated habitat use changes in other species occurred (Mittelbach 1986). There are multiple studies describing the impacts of human-mediated drivers on ecosystems worldwide. In coastal environments, anthropogenic activities, specifically shipping, industry, and urban development, dramatically change both the coastal and marine ecosystems (Mead et al. 2013).

The highly developed coastline along Los Angeles, CA is a prime example of urban development. (Image source: LA Magazine.)

By far the most pronounced example of how an international halt on travel can alter ecosystems comes from the tragic terrorist attacks on September 11, 2001. Prior to this current, viral pandemic, the events following 9/11 were the first time that nearly all major transit stopped in the USA—including airplanes and major shipping traffic. This halt created a unique opportunity to study some of the secondary impacts, such as a reduction in shipping traffic noise, on cetaceans. Following 9/11, there was a six decibel decrease in underwater noise that co-occurred with a decrease in stress hormones of endangered North Atlantic right whales (Rolland et al. 2012). When I first read about this study, my first thought was “leave it to scientists to make the best out of a terrible situation.” Truly, learning from nature, even in the darkest of days, is an incredible skillset. Research like this inspires me to ask questions about what changes are happening in ecosystems now because of recent events. For example, the entire port of San Diego, its beaches and bays, are closed for all recreational activity and I wonder how this reduction in traffic is similar to the post-9/11 study but on bottlenose dolphins, gray whales, and pinnipeds that are coast-associated. Are urban and suburban neighborhoods slowly becoming more rural and making space for wildlife again?

My dad lives in a suburban neighborhood of San Diego, CA. In the past few weeks, his “Ring doorbell camera” captured a bobcat walking along the raised brick path multiple times. (Media source: Eric Kownacki)

There is increasing news coverage on wild animals “taking over” cities. Dr. Leila Lemos touched on this earlier with her blog post centering on how academics are changing their means of teaching, conferencing, and learning. There are photos of wild goats running through the streets of Wales, UK, coyotes roaming the streets of San Francisco, CA, USA, monkeys swarming the streets in Thailand, pumas wandering the streets of Santiago, Chile, and Sika deer peering into empty restaurants in Nara, Japan (Colarossi 2020). In reality, this wildlife was likely part of the ecosystem prior to the formation of these cities but was forced out of the more urban centers. As we sit in our homes, rather than looking bleakly onto empty streets, we can search for wildlife, create a backyard birding competition with your friends, guess which flowers will bloom first, and ask questions of our changing ecosystems.

Coyote at a park in northern California with the San Francisco Golden Gate Bridge in the background. (Image source: u/beccatravels via Reddit)

Citations:

Colarossi, Natalie. “Photos Show Wild Animals Roaming Empty Streets as Coronavirus Lockdowns Keep Humans Inside.” Insider, Insider, 2 Apr. 2020, www.insider.com/photos-show-animals-roaming-empty-streets-during-coronavirus-lockdowns-2020-4#in-santiago-chile-a-wild-puma-was-seen-pacing-through-the-quiet-streets-according-to-the-chilean-agricultural-and-livestock-service-the-puma-came-down-from-the-mountains-after-seeing-the-streets-were-largely-empty-6.

Mead, A., Griffiths, C.L., Branch, G.M., McQuaid, C.D., Blamey, L.K., Bolton, J.J., Anderson, R.J., Dufois, F., Rouault, M., Froneman, P.W. and Whitfield, A.K., 2013. Human-mediated drivers of change—impacts on coastal ecosystems and marine biota of South Africa. African Journal of Marine Science35(3), pp.403-425.

Mittelbach, Gary. 1986. Predator-mediated habitat use: some consequences for species interactions. Environ Biol Fish 16, 159–169. https://doi.org/10.1007/BF00005168

Rolland, R.M., Parks, S.E., Hunt, K.E., Castellote, M., Corkeron, P.J., Nowacek, D.P., Wasser, S.K. and Kraus, S.D., 2012. Evidence that ship noise increases stress in right whales. Proceedings of the Royal Society B: Biological Sciences279(1737), pp.2363-2368.

Can marine mammals get coronavirus?

By Lisa Hildebrand, MSc student, OSU Department of Fisheries & Wildlife, Marine Mammal Institute, Geospatial Ecology of Marine Megafauna Lab

I want to start my post this week with a disclaimer – I am not a virologist or an epidemiologist. My knowledge and understanding on what a virus is, how it changes and spreads, and predicting its trajectory, is very limited (though it has definitely improved in recent weeks). Nevertheless, I did not want that to stop me from shifting my focus and time currently spent reading about a certain virus in humans, to thinking about viruses in marine mammals. So, after several hours of reading papers and reports, I believe I have a good enough grasp on viruses in marine mammals to write a blog post on this topic.

To answer the question in my title – yes, marine mammals can get coronavirus! Coronaviruses have been detected in several marine mammals – mostly in captive ones (harbor seal, beluga whale, Indo-Pacific bottlenose dolphin), but it was also detected in a wild harbor seal1. It is at this point where I am going to step back from marine mammals for a moment and give a very short ‘lesson’ on viruses.

Viruses are microscopic infectious agents that replicate inside living cells of organisms. They have the ability to infect all forms of life – anything from bacteria to plants to animals to humans. Nothing is excluded. Viruses are classified similarly to how living organisms are classified. Try to think back to middle school science when your teacher used mnemonic devices like, “Kids prefer candy over fancy green salad” or “Kings play chess on fine glass surfaces”, to get you to remember the Kingdom-Phylum-Class-Order-Family-Genus-Species classification. Well, viruses have almost the same classification tree. The only difference is that instead of Kingdom at the top, viruses have a Realm. As of 2019, the International Committee on Taxonomy of Viruses (ICTV) has defined 5,560 species of viruses in over 1,000 genera and 150 families. Different species of virus are classified based on their genomic material and key elements of structure and replication. That is as far as I am going to go with virus background – back to marine mammals!

Grey seal hauled out along the west coast of the U.K. Source: L. Hildebrand.

So, yes, coronaviruses have been detected in marine mammals before. But, no, they were not the same species of coronavirus that is currently spreading across the globe in humans. Coronavirus, or Coronaviridae, is a family of viruses that contains around 40 species. However, coronavirus is not the family that has plagued marine mammals the most since research on marine mammal diseases began. The infectious disease that I have found to be the most common and recurring in marine mammals is morbillivirus and I will therefore focus on that virus for the rest of this post.

Morbillivirus is a genus of viruses in the family Paramyxoviridae and hosts of this genus include humans, dogs, cats, cattle, seals, and cetaceans. There are seven described species of morbillivirus, three of which have been detected in marine mammals, namely canine distemper virus (CDV), cetacean morbillivirus (CeMV), and phocine distemper virus (PDV). The earliest, traceable case of morbillivirus in a marine mammal occurred in 1982 in bottlenose dolphins in the Indian and Banana Rivers in Florida2. This case was followed by hundreds of others in subsequent years all along the Atlantic U.S. coast and resulted in the first Unusual Mortality Event (UME; 1987-1988) that was concluded to have been caused by morbillivirus (Table 1).

Table 1. Unusual Mortality Events (UMEs) of marine mammals in the U.S. where the cause was determined to be or is suspected to be morbillivirus. Data obtained from NOAA Fisheries.

Interestingly, at the same time as this 1980s morbillivirus in the US, the first documented marine mammal morbillivirus epidemic occurred in Europe in the North Sea. This outbreak led to the death of more than 23,000 harbor seals, which accounted for roughly 60% of all North Sea harbor seals at the time3. The virus that was isolated from the stranded seals in the North Sea was similar to CDV but not exactly the same. Resultantly, it was described as a new species of morbillivirus and it was therefore the first outbreak of PDV. Another interesting thing about this case in Europe is that while the infection originated at the Danish island of Anholt, new centers of infection appeared quite far from this first epicenter within a relatively short amount of time (~3-4 weeks) from the initial outbreak, some as far as the Irish Sea (~2,000 km away; Figure 1). Harbor seals typically have a limited home range and do not travel such distances, leading scientists to speculate that grey seals may have been a carrier of the virus and transported it from Anholt to haul-out sites in the Irish Sea. Mixed species haul-out sites of harbor and grey seals are very common across the North Sea and is the most logical explanation for the rapid spread of the virus across such distances.

Figure 1. Map of the North Sea showing Anholt island (red marker) and the Irish Sea (white circle).

Harbor seals seem to be the most susceptible to PDV based on all documented cases of PDV outbreaks, however the reason for this pattern remains unknown1. While CDV has only been detected in Baikal and Caspian seals, CeMV has occurred in a larger number of cetaceans including harbor porpoises, striped, bottlenose, Guiana and Fraser’s dolphins, pilot whales, and a minke whale. This list is not extensive as morbillivirus has been found in 23 of the 90 cetacean species. In fact, it has been suggested that CeMV should be divided into more than one species as the morbilliviruses detected in the Northern Hemisphere show significant divergence from those found in the Southern Hemisphere.

Transmission is believed to mostly occur horizontally, meaning that the morbillivirus is passed from one individual to another. This transfer happens when one individual inhales the aerosolized virus breathed out by an infected individual. This is likely the reason why odontocete and pinniped groups are most affected due to their social group behavior and/or high density of individuals within groups4. However, vertical transmission has also been suggested as a possible transmission route as morbillivirus antigens have been detected in the mammary glands of bottlenose dolphins along the U.S. Atlantic Coast5 and striped dolphins in the Mediterranean Sea affected by CeMV6. Thus, it has been postulated that CeMV infected females could transmit the infection to their fetuses and neonates in utero, as well as to their calves during lactation.

Bottlenose dolphins populations have been involved in several UME events related to morbillivirus along the U.S. coasts (Table 1). Source: L. Hildebrand. Image captured under NMFS permit #19116.

Morbilliviruses mostly affect the respiratory and neurologic systems in marine mammals, wherein affected individuals may display ocular and naval discharge, erratic swimming, respiratory distress, raised body temperature, and/or cachexia (weakness and wasting away of the body due to severe illness). However, most diagnoses occur post-mortem. Some individuals may survive the initial acute infection of morbillivirus, yet the general weakening of the immune system will make individuals more susceptible to other infections, diseases, and disturbance events7.

It is impossible to know whether marine mammals take precautions when a virus has taken grip of a group or population, or if marine mammals even have an awareness of such things occurring. There obviously is no such thing as an emergency room or a doctor in the lives of marine mammals, but do individuals perhaps demonstrate social distancing by increasing the space between each other when traveling in groups? Do groups decrease their traveling distances or foraging ranges to isolate themselves in a smaller area? Are sick individuals ‘quarantined’ by being forced out of a group? These are just some of the questions I have been asking myself while working from home (day 16 for me now). I hope you are all staying safe and healthy and have enjoyed distracting yourselves from thinking about one virus to learn about another in a different kind of mammal.

Literature cited

1 Bossart, G. D., and P. J. Duignan. 2018. Emerging viruses in marine mammals. CAB Reviews 13(52): doi:10.1079/PAVSNNR201913052.

2 Duignan, P. J., C. House, D. K. Odell, R. S. Wells, L. J. Hansen, M. T. Walsh, D. J. St. Aubin, B. K. Rima, and J. R. Geraci. 1996. Morbillivirus infection in bottlenose dolphins: evidence for recurrent epizootics in the western Atlantic and Gulf of Mexico. Marine Mammal Science 12(4):499-515.

3 Härkönen, T., R. Dietz, P. Reijnders, J. Teilmann, K. Harding, A. Hall, S. Brasseur, U. Siebert, S. J. Goodman, P. D. Jepson, T. D. Rasmussen, and P. Thompson. 2006. A review of the 1988 and 2002 phocine distemper virus epidemics in European harbor seals. Diseases of Aquatic Organisms 68:115-130.

4 Van Bressem, M-F., P. J. Duignan, A. Banyard, M. Barbieri, K. M. Colegrove, S. De Guise, G. Di Guardo, A. Dobson, M. Domingo, D. Fauquier, A. Fernandez, T. Goldstein, B. Grenfell, K. R. Groch, F. Gulland, B. A. Jensen, P. D. Jepson, A. Hall, T. Kuiken, S. Mazzariol, S. E. Morris, O. Nielsen, J. A. Raga, T. K. Rowles, J. Saliki, E. Sierra, N. Stephens, B. Stone, I. Tomo, J. Wang, T. Waltzek, and J. F. X. Wellehan. 2014. Cetacean morbillivirus: current knowledge and future directions. Viruses 6(12):5145-5181.

5 Schulman, F. Y., T. P. Lipscomb, D. Moffett, A. E. Krafft, J. H. Lichy, M. M. Tsai, J. K. Taubenberger, and S. Kennedy. 1997. Histologic, immunohistochemical, and polymerase chain reaction studies of bottlenose dolphins from the 1987-1988 United States Atlantic coast epizootic. Veterinary Pathology 34(4):288-295.

6 Domingo, M., J. Visa, M. Pumarola, A. J. Marco, L. Ferrer, R. Rabanal, and S. Kennedy. 1992. Pathologic and immunocytochemical studies of morbillivirus infection in striped dolphins (Stenella coeruleoalba). Veterinary Pathology 29(1):1-10.

7 Wellehan, J., and G. Cortes-Hinojosa. 2019. Marine Mammal Viruses. Fowler’s Zoo and Wild Animal Medicine Current Therapy 9:597-602.