The whales keep coming and we keep learning: a wrap up of the eighth GRANITE field season.

Clara Bird, PhD Candidate, OSU Department of Fisheries, Wildlife, and Conservation Sciences, Geospatial Ecology of Marine Megafauna Lab

As you may remember, last year’s field season was a remarkable summer for our team. We were pleasantly surprised to find an increased number of whales in our study area compared to previous years and were even more excited that many of them were old friends. As we started this field season, we were all curious to know if this year would be a repeat. And it’s my pleasure to report that this season was even better!

We started the season with an exciting day (6 known whales! see Lisa’s blog) and the excitement (and whales) just kept coming. This season we saw 71 individual whales across 215 sightings! Of those 71, 44 were whales we saw last year, and 10 were new to our catalog, meaning that we saw 17 whales this season that we had not seen in at least two years! There is something extra special about seeing a whale we have not seen in a while because it means that they are still alive, and the sighting gives us valuable data to continue studying health and survival. Another cool note is that 7 of our 12 new whales from last year came back this year, indicating recruitment to our study region.

Included in that group of 7 whales are the two calves from last year! Again, indicating good recruitment of new whales to our study area. We saw both Lunita and Manta (previously nick-named ‘Roly-poly’) throughout this season and we were always happy to see them back in our area and feeding on their own.

Drone image of Lunita from 2023
Drone image of Manta from 2023

We had an especially remarkable encounter with Lunita at the end of this season when we found this whale surface feeding on porcelain crab larvae (video 1)! This is a behavior that we rarely observe, and we’ve never seen a juvenile whale use this behavior before, inspiring questions around how Lunita knew how to perform this behavior.

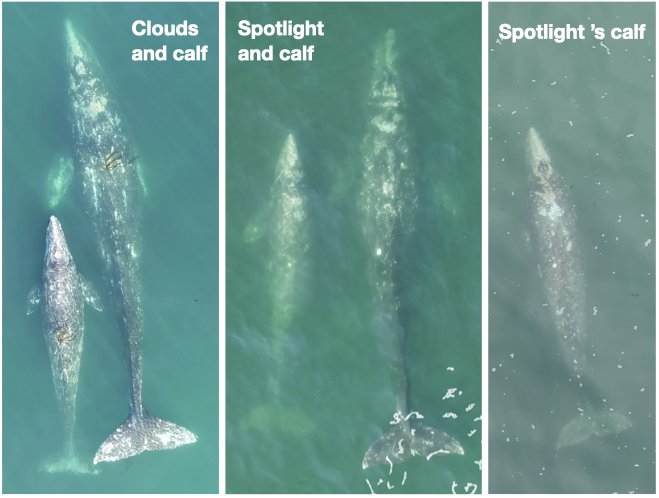
Not only did we resight our one-year-old friends, but we found two new calves born to well-known mature females (Clouds and Spotlight). We had previously documented Clouds with a calf (Cheetah) in 2016 so it was exciting to see her with a new calf and to meet Cheetah’s sibling! Cheetah has become one of our regulars so we’re curious to see if this new calf joins the regular crew as well. We’re also hoping that Spotlight’s calf will stick around; and we’re optimistic since we observed it feeding alone later in the season.

Collage of new calves from 2023! Left: Clouds and her calf, Center: Spotlight and her calf, Right: Spotlight’s calf independently foraging

Of course, 71 whales means heaps of data! We spent 226 hours on the water, conducted 132 drone flights (a record!), and collected 61 fecal samples! Those 132 flights were over 64 individual whales, with Casper and Pacman tying for “best whale to fly over” with 10 flights each. We collected 61 fecal samples from 26 individual whales with a three-way tie for “best pooper” between Hummingbird, Scarlett, and Zorro with 6 fecal samples each. And we continued to collect valuable prey and habitat data through 80 GoPro drops and 79 zooplankton net tows.

And if you were about to ask, “but what about tagging?!”, fear not! We continued our suction cup tagging effort with a successful window in July where we were joined by collaborators John Calambokidis from Cascadia Research Collective and Dave Cade from Hopkins Marine Station and deployed four suction-cup tags.

It’s hard to believe all the work we’ve accomplished in the past five months, and I continue to be honored and proud to be on this incredible team. But as this season has come to a close, I have found myself reflecting on something else. Learning. Over the past several years we have learned so much about not only these whales in our study system but about how to conduct field work. And while learning is continuous, this season in particular has felt like an exciting time for both. In the past year our group has published work showing that we can detect pregnancy in gray whales using fecal samples and drone imagery (Fernandez Ajó et al., 2023), that PCFG gray whales are shorter and smaller than ENP whales (Bierlich et al., 2023), and that gray whales are consuming high levels of microplastics (Torres et al., 2023). We also have several manuscripts in review focused on our behavior work from drones and tags. While this information does not directly affect our field work, it does mean that while we’re observing these whales live, we better understand what we’re observing and we can come up with more specific, in-depth questions based on this foundation of knowledge that we’re building. I have enjoyed seeing our questions evolve each year based on our increasing knowledge and I know that our collaborative, inquisitive chats on the boat will only continue inspiring more exciting research.

On top of our gray whale knowledge, we have also learned so much about field work. When I think back to the early days compared to now, there is a stark difference in our knowledge and our confidence. We do a lot on our little boat! And so many steps that we once relied on written lists to remember to do are now just engrained in our minds and bodies. From loading the boat, to setting up at the dock, to the go pro drops, fecal collections, drone operations, photo taking, and photo ID, our team has become quite the well-oiled machine. We were also given the opportunity to reflect on everything we’ve learned over the past years when it was our turn to train our new team member, Nat! Nat is a new PhD student in the GEMM lab who is joining team GRANITE. Teaching her all the ins and outs of our fieldwork really emphasized how much we ourselves have learned.

On a personal note, this was my third season as a drone pilot, and honestly, I was pleasantly surprised by my experience this season. Since I started piloting, I have experienced pretty intense nerves every time I’ve flown the drone. From stress dreams, to mild nausea, and an elevated heart rate, flying the drone was something that I didn’t necessarily look forward to. Don’t get me wrong – it’s incredibly valuable data and a privilege to watch the whales from a bird’s eye view in real time. But the responsibility of collecting good data, while keeping the drone and my team members safe was something that I felt viscerally. And while I gained confidence with every flight, the nerves were still as present as ever and I was starting to accept that I would never be totally comfortable as a pilot. Until this season, when the nerves finally cleared, and piloting became as innate as all the other field work components. While there are still some stressful moments, the nerves don’t come roaring back. I have finally gone through enough stressful situations to not be fazed by new ones. And while I am fully aware that this is just how learning works, I write this reflection as a reminder to myself and anyone going through the process of learning any new skill to push through that fear. Remember there can be a disconnect between the time when you know how to do something well, or well-enough, and the time when you feel comfortable doing it. I am just as proud of myself for persevering as I am of the team for collecting so much incredible data. And as I look ahead to my next scary challenge (finishing my PhD!), this is a feeling that I am trying to hold on to. 

Stay tuned for updates from team GRANITE!

Did you enjoy this blog? Want to learn more about marine life, research, and conservation? Subscribe to our blog and get a weekly alert when we make a new post! Just add your name into the subscribe box below!

Loading

References

Bierlich, K. C., Kane, A., Hildebrand, L., Bird, C. N., Fernandez Ajo, A., Stewart, J. D., Hewitt, J., Hildebrand, I., Sumich, J., & Torres, L. G. (2023). Downsized: Gray whales using an alternative foraging ground have smaller morphology. Biology Letters19(8), 20230043. https://doi.org/10.1098/rsbl.2023.0043

Fernandez Ajó, A., Pirotta, E., Bierlich, K. C., Hildebrand, L., Bird, C. N., Hunt, K. E., Buck, C. L., New, L., Dillon, D., & Torres, L. G. (2023). Assessment of a non-invasive approach to pregnancy diagnosis in gray whales through drone-based photogrammetry and faecal hormone analysis. Royal Society Open Science10(7), 230452. https://doi.org/10.1098/rsos.230452

Torres, L. G., Brander, S. M., Parker, J. I., Bloom, E. M., Norman, R., Van Brocklin, J. E., Lasdin, K. S., & Hildebrand, L. (2023). Zoop to poop: Assessment of microparticle loads in gray whale zooplankton prey and fecal matter reveal high daily consumption rates. Frontiers in Marine Science10. https://www.frontiersin.org/articles/10.3389/fmars.2023.1201078

Fantastic beasts and how to measure  them! 

Sagar Karki, Master’s student in the Computer Science Department at Oregon State University 

What beasts? Good question! We are talking about gray whales in this article but honestly we can tweak the system discussed in this blog a little and make it usable for other marine animals too.  

Understanding the morphology, such as body area and length, of wild animals and populations can provide important information on animal  behavior and health (check out postdoc Dr. KC Bierlich’s post on this topic). Since 2015, the GEMM Lab has been flying drones over whales to collect aerial imagery to allow for photogrammetric measurements to gain this important morphological data. This photogrammetry data has shed light on multiple important aspects of gray whale morphology, including the facts that the whales feeding off Oregon are skinnier [1] and shorter [2] than the gray whales that feed in the Arctic region.  But, these surprising conclusions overshadow the immense, time-consuming labor that takes place behind the scenes to move from aerial images to accurate measurements.  

To give you a sense of this laborious process, here is a quick run through of the methods: First the 10 to 15 minute videos must be carefully watched to select the perfect frames of a whale (flat and straight at the surface) for measurement. The selected frames from the drone imagery are then imported into MorphoMetriX, which is a custom software developed for photogrammetry measurement [1]. MorphoMetriX is an interactive application that allows an analyst to manually measure the length by clicking points along the centerline of the whale’s body. Based on this line, the whale is divided into a set of sections perpendicular to the centerline, these are used to then measure widths along the body. The analyst then clicks border points at the edge of the whale’s body to delineate the widths following the whale’s body curve. MorphoMetriX then generates a file containing the lengths and widths of the whale in pixels for each measured image. The length and widths of whales are converted from pixels to metric units using a software called CollatriX [4] and this software also calculates metrics of body condition from the length and width measurements. 

While MorphoMetriX [3] and CollatriX [4] are both excellent platforms to facilitate these photogrammetry measurements, each measurement takes time, a keen eye, and attention to detail. Plus, if you mess up one step, such as an incorrect length or width measurement, you have to start from the first step. This process is a bottleneck in the process of obtaining important morphology data on animals. Can we speed this process up and still obtain reliable data? 

What if we can apply automation using computer vision to extract the frames we need and automatically obtain measurements that are as accurate as humans can obtain? Sounds pretty nice, huh? This is where I come into the picture. I am a Master’s student in the Computer Science Department at OSU, so I lack a solid background in marine science, but bring to the table my skills as a computer programmer. For my master’s project, I have been working in the GEMM Lab for the past year to develop automated methods to obtain accurate photogrammetry measurements of whales.  

We are not the first group to attempt to use computers and AI to speed up and improve the identification and detection of whales and dolphins in imagery. Researchers have used deep learning networks to speed up the time-intensive and precise process of photo-identification of  individual whales and dolphins [5], allowing us to more quickly determine animal location, movements and abundance. Millions of satellite images of the earth’s surface are collected daily and scientists are attempting to utilize these images to  benefit marine life by studying patterns of species occurrence, including detection of gray whales in satellite images using deep learning [6]. There has also been success using computer vision to identify whale species and segment out the body area of the whales  from drone imagery [7]. This process involves extracting segmentation masks of the whale’s body followed by length extraction from the mask. All this previous research shows promise for the application of computer vision and AI to assist with animal research and conservation. As discussed earlier, the automation of image extraction and photogrammetric measurement  from drone videos will help researchers collect vital data more quickly so that decisions that impact  the health of whales can be more responsive and effective.For instance,  photogrammetry data extracted from drone images can diagnose pregnancy of the whales [8], thus automation of this information could speed up our ability to understand population trends. 

Computer vision and natural language processing fields are growing exponentially. There are new foundation models like ChatGPT that can do most of the natural language understanding and processing tasks. Foundational models are also emerging for computer vision tasks, such as “the segment anything model” from Meta. Using these foundation models along with other existing research work in computer vision, we have developed and deployed a system that automates the manual and computational tasks of MorphoMetriX and CollatriX systems.  

This system is currently in its testing and monitoring phase, but we are rapidly moving toward a publication to disseminate all the tools developed, so stay tuned for the research paper that will explain in detail the methodologies followed on data processing, model training and test results. The following images give a sneak peak of results. Each image  illustrates a frame from a drone video that was  identified and extracted through automation, followed by another automation process that identified important points along the whale’s body and curvature.  The user interface of the system aims to make the user experience intuitive and easy to follow. The deployment is carefully designed to run on different hardwares, with easy monitoring and update options using the latest open source frameworks. The user has to do just two things. First, select the videos for analysis. The system then generates potential frames for photogrammetric analysis (you don’t need to watch 15 mins of drone footage!). Second, the user selects the frame of choice for photogrammetric analysis and waits for the system to give you measurements. Simple! Our goal is for these softwares to be a massive time-saver while  still providing vital, accurate body measurements  to the researchers in record time. Furthermore, an advantage of this approach is that researchers can follow the methods in our to-be-soon-published research paper to make  a few adjustments enabling the software to measure other marine species, thus expanding the impact of this work to many other life forms.  

Did you enjoy this blog? Want to learn more about marine life, research, and conservation? Subscribe to our blog and get a weekly message when we post a new blog. Just add your name and email into the subscribe box below.

Loading

References 

  1. Torres LG, Bird CN, Rodríguez-González F, Christiansen F, Bejder L, Lemos L, Urban R J, Swartz S, Willoughby A, Hewitt J, Bierlich K (2022) Range-Wide Comparison of Gray Whale Body Condition Reveals Contrasting Sub-Population Health Characteristics and Vulnerability to Environmental Change. Front Mar Sci 910.3389/fmars.2022.867258 
  1. Bierlich KC, Kane A, Hildebrand L, Bird CN, Fernandez Ajo A, Stewart JD, Hewitt J, Hildebrand I, Sumich J, Torres LG (2023) Downsized: gray whales using an alternative foraging ground have smaller morphology. Biol Letters 19:20230043 doi:10.1098/rsbl.2023.0043 
  1. Torres et al., (2020). MorphoMetriX: a photogrammetric measurement GUI for morphometric analysis of megafauna. Journal of Open Source Software, 5(45), 1825, https://doi.org/10.21105/joss.01825 
  1. Bird et al., (2020). CollatriX: A GUI to collate MorphoMetriX outputs. Journal of Open Source Software, 5(51), 2328, https://doi.org/10.21105/joss.02328 
  1. Patton, P. T., Cheeseman, T., Abe, K., Yamaguchi, T., Reade, W., Southerland, K., Howard, A., Oleson, E. M., Allen, J. B., Ashe, E., Athayde, A., Baird, R. W., Basran, C., Cabrera, E., Calambokidis, J., Cardoso, J., Carroll, E. L., Cesario, A., Cheney, B. J. … Bejder, L. (2023). A deep learning approach to photo–identification demonstrates high performance on two dozen cetacean species. Methods in Ecology and Evolution, 00, 1–15. https://doi.org/10.1111/2041-210X.14167 
  1. Green, K.M., Virdee, M.K., Cubaynes, H.C., Aviles-Rivero, A.I., Fretwell, P.T., Gray, P.C., Johnston, D.W., Schönlieb, C.-B., Torres, L.G. and Jackson, J.A. (2023), Gray whale detection in satellite imagery using deep learning. Remote Sens Ecol Conserv. https://doi.org/10.1002/rse2.352 
  1. Gray, PC, Bierlich, KC, Mantell, SA, Friedlaender, AS, Goldbogen, JA, Johnston, DW. Drones and convolutional neural networks facilitate automated and accurate cetacean species identification and photogrammetry. Methods Ecol Evol. 2019; 10: 1490–1500. https://doi.org/10.1111/2041-210X.13246 
  1. Fernandez Ajó A, Pirotta E, Bierlich KC, Hildebrand L, Bird CN, Hunt KE, Buck CL, New L, Dillon D, Torres LG (2023) Assessment of a non-invasive approach to pregnancy diagnosis in gray whales through drone-based photogrammetry and faecal hormone analysis. Royal Society Open Science 10:230452 

A Journey From Microbiology to Macrobiology

Mariam Alsaid, University of California Berkeley, GEMM Lab REU Intern

My name is Mariam Alsaid and I am currently a 5th year undergraduate transfer student at the University of California, Berkeley. Growing up on the small island of Bahrain, I was always minutes away from the water and was enraptured by the creatures that lie beneath the surface. Despite my long-standing interest in marine science, I never had the opportunity to explore it until just a few months ago. My professional background up until this point was predominantly in soil microbiology through my work with Lawrence Berkeley National Laboratory, and I was anxious about how I would switch directions and finally be able to pursue my main passion. For this reason, I was thrilled by my acceptance into the OSU Hatfield Marine Science Center’s REU program this year, which led to my exciting collaboration with the GEMM Lab. It was kind of a silly transition to go from studying bacteria, one of the smallest organisms on earth, to whales, who are the largest.

My project this summer focused on sei whale acoustic occurrence off the coast of Oregon. “What’s a sei whale?” is a question I heard a lot throughout the summer and is one that I had to Google myself several times before starting my internship. Believe it or not, sei whales are the third largest rorqual in the world but don’t get much publicity because of their small population sizes and secretive behavior. The commercial whaling industry of the 19th and 20th centuries did a number on sei whale populations globally, rendering them endangered. In consequence, little research has been conducted on their global range, habitat use, and behavior since the ban of commercial whaling in 1986 (Nieukirk et al. 2020). Additionally, sei whales are relatively challenging to study because of their physical similarities to the fin whale, and acoustic similarities to other rorqual vocalizations, most notably blue whale D-calls and fin whale 40 Hz calls. As of today, published literature indicates that sei whale acoustic presence in the Pacific Ocean is restricted to Antarctica, Chile, Hawaii, and possibly British Columbia, Canada (Mcdonald et al. 2005; Espanol-Jiminez et al. 2019; Rankin and Barlow, 2012; Burnham et al. 2019). The idea behind this research project was sparked by sparse visual sightings of sei whales by research cruises conducted by the Marine Mammal Institute (MMI) in recent years (Figure 1). This raised questions about if sei whales are really present in Oregon waters (and not just misidentified fin whales) and if so, how often?

Figure 1. Map of sei whale visual sightings off the coast of Oregon, colored by MMI Lab research cruise, and the location of the hydrophone at NH45 (white star).

A hydrophone, which is a fancy piece of equipment that records continuous underwater sound, was deployed 45 miles offshore of Newport, OR between October of 2021 and December of 2022. My role this summer was to use this acoustic data to determine whether sei whales are hanging out in Oregon or not. Acoustic data was analyzed using the software Raven Pro, which allowed me to visualize sound in the form of spectrograms (Fig. 2). From there, my task was to select signals that could potentially be sei whale calls. It was a hurdle familiarizing myself with sei whale vocalizations while also keeping in mind that other species (e.g., blue and fin whales) may produce similar sounding (and looking in the spectrograms) calls. For this reason, I decided to establish confidence levels based on published sei whale acoustic research that would help me classify calls with less bias. Vocalizations produced by sei whales are characterized by low frequency, broadband, downsweeps. Sei whales can be acoustically distinguished from other whales because of their tendency to produce uniform groups of calls (typically in doublets and triplets) in a short timeframe. This key finding allowed me to navigate the acoustic data with more ease.

The majority of the summer was spent slowly scanning through the months of data at 5-minute increments. As you can imagine, excitement varied by day. Some days I would find insanely clear signals of blue, fin, and humpback whales and other days I would find nothing. The major discovery and the light at the end of the tunnel was the SEI WHALES!!! I detected numerous high quality sei whale calls throughout the study period with peaks in October and November (but a significantly higher peak in occurrence in 2022 versus 2021). I also encountered a unique vocalization type in fall of 2022, consisting of a very long series of repeated calls that we called “multiplet”, rather than doublets or triplets that is more typical of sei whales (Fig. 3). Lastly, I found no significant diel pattern in sei whale vocalization, indicating that these animals call at any hour of the day. More research needs to go into this project to better estimate sei whale occurrence and understand their behavior in Oregon but this preliminary work provides a great baseline into what sei whales sound like in this part of the world. In the future, the GEMM lab intends on implementing more hydrophone data and work on developing an automated detection system that would identify sei whale calls automatically.

Figure 2. Spectrogram of typical sei whale calls detected in acoustic data
Figure 3. Spectrogram of unique sei whale multiplet call type
Figure 4. My first time conducting fieldwork! I spent a few mornings assisting Dr. Rachel Orben’s group in surveying murre and cormorant nests (thanks to my good friend Jacque McKay :))

My experience this summer was so formative for me. As someone who has been an aspiring marine biologist for so long, I am so grateful for my experience working with the GEMM Lab alongside incredible scientists who are equally passionate about studying the mysteries of the ocean. This experience has also piqued my interest in bioacoustics and I plan on searching for other opportunities to explore the field in the future. Aside from growing professionally, I learned that I am more capable of tackling and overcoming obstacles than I had thought. I was afraid of entering a field that I knew so little about and was worried about failing and not fitting in. My anxieties were overshadowed by the welcoming atmosphere at Hatfield and I could not have asked for better people to work with. As I was searching for sei whale calls this summer, I suppose that I was also unintentionally searching for my voice as a young scientist in a great, blue field.

Figure 5. My mentor, Dr. Dawn Barlow, and I with my research poster at the Hatfield Marine Science Center Coastal Intern Symposium

Did you enjoy this blog? Want to learn more about marine life, research, and conservation? Subscribe to our blog and get a weekly alert when we make a new post! Just add your name into the subscribe box below!

Loading

References:

Nieukirk, S. L., Mellinger, D. K., Dziak, R. P., Matsumoto, H., & Klinck, H. (2020). Multi-year occurrence of sei whale calls in North Atlantic polar waters. The Journal of the Acoustical Society of America, 147(3), 1842–1850. https://doi.org/10.1121/10.0000931

McDonald, M. A., Calambokidis, J., Teranishi, A. M., & Hildebrand, J. A. (2001). The acoustic calls of blue whales off California with gender data. The Journal of the Acoustical Society of America, 109(4), 1728–1735. https://doi.org/10.1121/1.1353593

Español-Jiménez, S., Bahamonde, P. A., Chiang, G., & Häussermann, V. (2019). Discovering sounds in Patagonia: Characterizing sei whale (<i>Balaenoptera borealis</i>) downsweeps in the south-eastern Pacific Ocean. Ocean Science, 15(1), 75–82. https://doi.org/10.5194/os-15-75-2019

Rankin, S., & Barlow, J. (2007). VOCALIZATIONS OF THE SEI WHALE BALAENOPTERA BOREALIS OFF THE HAWAIIAN ISLANDS. Bioacoustics, 16(2), 137–145. https://doi.org/10.1080/09524622.2007.9753572

Burnham, R. E., Duffus, D. A., & Mouy, X. (2019). The presence of large whale species in Clayoquot Sound and its offshore waters. Continental Shelf Research, 177, 15–23. https://doi.org/10.1016/j.csr.2019.03.004

That’s so Real: Adult Beginners, Serial Podcast(s), and a whole lotta of Baja Gray Whale Video Analysis.

Celest Sorrentino, Research Technician, Geospatial Ecology of Marine Megafauna Lab

Hello again GEMM Lab family. I write to you exactly a year after (okay maybe 361 days after but who’s counting…) from my previous blog post describing my 2022 summer working in the GEMM Lab as an NSF REU intern. Since then, so much has changed, and I can’t wait to fill you in on it.

In June I walked across the commencement stage at UC Santa Barbara, earning my BS in Ecology, Evolution, and Marine Biology and my minor in Italian language. A week later, I packed my bags and headed straight back to the lukewarm beaches of Newport, Oregon as a Research Technician in the GEMM Lab. I am incredibly fortunate to have been invited back to the OSU Marine Mammal Institute to lend a hand analyzing drone footage of gray whales collected back in March 2023 when Leigh and Clara went down to Baja California, as mentioned previously in Clara’s blog

Fig. 1. View from the top! (of the bridge at Yaquina Bay Bridge in Newport, OR)

During my first meeting with Clara at the beginning of the summer we discussed that a primary goal of my position was to process all the drone footage collected in Baja so that the generated video clips could be later used in other analytical software such as BORIS and SLEAP A.I. Given my previous internships and past summer project, this video processing is familiar to me. My initial thoughts were:

Sweet! Watch drone footage, pop in some podcasts, note down when I see whales, let’s do this!*

Like any overly eager 23-year-old, I might have mentally cracked open a Celsius and kicked my feet up too soon. We added another layer to the goal: develop an ethogram – which requires me to identify and define the behaviors that the gray whales appear to be demonstrating within the videos (more on ethogram development in Clara’s previous blog.) This made me nervous. 

I don’t have any experience with behavior. How do I tell what is a real behavior or if the whale is just existing? What if I’m wrong and ruin the project? What if I totally mess this up?

Naturally, as any sane person, to resolve these thoughts I took to the Reddit search bar: “How to do a job you’ve never done before.” No dice. 

I pushed these thoughts aside and decided to just start the video analysis process. Clara provided me with the ethogram she is developing during her PhD as a point of reference (based on the published gray whale ethogram in Torres et al. 2018), I was surrounded by an insanely supportive lab, and I could Google anything at my fingertips. Fast-forward 6 weeks later: I had analyzed 128 drone videos of adult gray whales as well as mother-calf pairs, and developed an ethogram describing, 26 behaviors**. I named one of my favorite behaviors  a “Twirl” to describe when a gray whale lifts their head out of the water and performs a 360 turn. Reminds me of times when as a kid, sometimes all you really needed is a good spin!

Now I was ready to start a productive, open conversation with Leigh and Clara about this ethogram and my work. However, even walking up to that last meeting, remnants of those daunting, doubtful early summer thoughts persisted. Even after I double checked all the definitions I wrote, rewatched all videos with said behaviors, and had something to show for my work. What gives Brain?

A few days ago, as I sat on my family’s living room couch with my two younger sisters, Baylie and Cassey, Baylie wanted to watch some TikToks with me. One video that came up was of a group of adults taking a beginner dance class, having so much fun and radiating joy. The caption read, Being a beginner as an adult is such a fun and wild thing. Baylie and I watched the video at least 10x, repeating to each other phrases like, “Wow!” and “They’re so cool.” That caption and video has been on my mind since: 

Being a beginner as an adult is such a fun and wild thing.

Being a beginner as an adult is also scary. 

Having just graduated, I can no longer say I am undergraduate student. Now, I am a young adult. This was my first research technician job, as an adult. Don’t adults usually have everything figured out? Can adults be beginners too?

Yes. In fact, we’re beginners more than we realize. 

  • I was a beginner cooking my mother’s turkey recipe 3 years ago for my housemates during the pandemic (Even after having her on Facetime, I still managed to broil it a little too long.) 
  • I was a beginner driver 5 years ago in a rickety Jeep driving myself to school (Now, since I’ve been back home, I’ve been driving my little sisters to school.)
  • I was a beginner NSF REU intern just a year ago. (This summer I was the alumni on the panel for the current NSF REU interns at Hatfield.)
  • I was a beginner science communicator presenting my NSF REU project at Hatfield last summer. (This summer, I presented my research at the Animal Behavior Society Conference.) 
Fig 2A. Group Pic with the LABIRINTO Lab and GEMM Lab at the ABS Portland Conference!
Fig 2B. Clara Bird (left), Dr. Leigh Torres (middle), and I (right) at the ABS Portland Conference. 

I now recognize that during my time identifying and defining behaviors of gray whales in videos made me take on the seat of a “beginner video and behavioral analyst”. I could not rely on the automated computer vision lens I gained from previous internships, which felt familiar and secure. 

 Instead, I had to allow myself to be creative. Dig into the unfamiliar in an effort to complete a task or job I had never done before. Allowing myself to be imperfect, make mistakes, meanwhile unconsciously building a new skill. 

This is what makes being a beginner as an adult such a fun thing. 

I don’t think being a beginner is a wild thing, although it can definitely make you feel a wild range of emotions. Being a beginner means you’re allowing yourself to try something new. Being a beginner means you’re allowing yourself the chance to learn.

Whether you’re an adult beginner as you enter your 30s, adult beginner as you enter parenthood, adult beginner grabbing a drink with friends after a long day in lab, adult beginner as a dancer, or like me, a beginner of leaving behind my college student persona and entering a new identity of adulthood, being a beginner as an adult is such a fun and normal thing.

I am not sure what will be next, but I hope to write to you all again from this blog a year from now, as an adult beginner as a grad student in the GEMM Lab. For anyone approaching the question of “What’s next”, I encourage you to read “Never a straight Path” by GEMM Lab MSc alum Florence Sullivan, a blog that has brought me such solace in my new adult journey and advice that never gets old.

Being a beginner—that, is so real. 

Fig 3A. Kayaking as an adult beginner of the Port Orford Field Team!
Fig 3B “See you soon:” Wolftree evenings with the lab.
Fig 3C. GEMM Lab first BeReal!

*I listened to way too many podcasts to list them all, but I will include two that have been a GEMM Lab “gem” —-thanks to Lisa and Clara for looping me in and now, looping you in!)

**(subject to change)

References

Torres LG, Nieukirk SL, Lemos L, Chandler TE (2018) Drone Up! Quantifying Whale Behavior From a New Perspective Improves Observational Capacity. Front Mar Sci 510.3389/fmars.2018.00319

Did you enjoy this blog? Want to learn more about marine life, research, and conservation? Subscribe to our blog and get a weekly message when we post a new blog. Just add your name and email into the subscribe box below.

Loading

Title: “Blown away”: measuring the blowholes of whales from drones

By Annie Doron, Undergraduate Intern, Oregon State University, GEMM Laboratory  

Hey up! My name is Annie Doron, and I am an undergraduate Environmental Science student from the University of Sheffield (UK) on my study year abroad. One of my main motivations for undertaking this year abroad was to gain experience working in a marine megafauna lab. Whales in particular have always captivated my interest, and I have been lucky enough to observe  humpback whales in Iceland and The Azores, and even encountered one whilst diving in Australia! For the past 10 months, I have had the unique opportunity to work in the GEMM Lab analyzing Pacific Coast Feeding Group (PCFG) gray whales off the Oregon Coast (Figure 1). I must admit, it has been simply wonderful! 

Figure 1. Aerial image of a PCFG gray whale off the Oregon Coast. 

How did I end up getting involved with the GEMM Lab? I was first accepted into Scarlett Arbuckle’s research-based class in fall term 2022, which is centered around partnering with a mentor for a research project. Having explored the various fields of research at HMSC, I contacted Leigh Torres with interest in getting involved in the GEMM Lab and to establish a research project suitable for a totally inexperienced, international, undergraduate student. Thankfully, Leigh forwarded my email to KC Bierlich who offered to be my mentor for the class, and the rest is history! I first began analyzing drone imagery to measure length and body condition of  PCFG gray whales, which provided an opportunity to get involved with the lab and gain experience using the photogrammetry software MorphoMetriX (Torres & Bierlich, 2020) (see KC’s blog), which is used to make morphometric measurements of whales. Viewing drone imagery of whales sparked my interest in how they use their blowholes (otherwise called ‘nares’) to replenish their oxygen stores; this led to us establishing a research project for the class where we tested if we could use MorphoMetriX to measure blowholes from drone imagery.

Extending this project into winter and spring terms (via research credits) has enabled me to continue working with Leigh and KC, as well as to collaborate with Clara Bird and Jim Sumich. Thanks to KC, who has patiently guided me through the ins and outs of working on a research project, I now feel more confident handling and manipulating large datasets, analyzing drone footage (i.e., differentiating between behavioral states, recording breathing sequences, detecting when a whale is exhaling vs inhaling, etc.), and speaking in public (although I still get pretty bad stage fright, but I think that is a typical conundrum undergrads face). Whatsmore, applying  R – a programming language used for statistical analysis and data visualization, which I have been trying to wrap my head around for years – to my own dataset has helped me greatly enhance my skills using it. 

So, what exciting things have we been working on this year? Given that we often cannot simply study a whale from inside a laboratory – due to size-related logistical implications – we must use proxies (i.e., a variable that is representative of an immeasurable variable). Since cetaceans must return to the surface to offload carbon dioxide and replenish their oxygen stores, measuring their breath frequency and magnitude is one way to study a whale’s oxygen consumption, in turn offering insight into its energy expenditure (Williams, 1999). Blowholes are one proxy we can use to study breath magnitude. Blowholes can be utilized in this way by measuring inhalation duration (the amount of time a whale is inhaling, which is based on a calculation developed by Jim Sumich) and blowhole area (the total area of a blowhole) to gauge variations in tidal volume (the amount of air flowing in and out of the lungs).

Measuring inhalation duration and blowhole area is important because a larger blowhole area (i.e., one that is more dilated) and a longer inhalation duration is indicative of higher oxygen intake, which can infer stress. For example, in this population, higher stress levels are associated with increased vessel traffic (Lemos et al., 2022), and skinnier whales have higher stress levels compared to chubby, healthy whales (Lemos, Olsen, et al., 2022). Hence, measuring the variation around blowholes could be utilized to predict challenges whales face from climate change and anthropogenic disturbance, including fishing (Scordino et al., 2017) and whale watching industry threats (Sullivan & Torres, 2018) (see Clara’s blog), as well as to inform effective management strategies. Furthermore, measuring the variables inhalation duration and blowhole area could help to identify whether whales are taking larger breaths associated with certain ‘gross behavior states’, otherwise known as ‘primary states’, which include: travel, forage, rest, social (Torres et al., 2018). This could enable us to assess the energetic costs of different foraging tactics (i.e., head standing, side-swimming, and bubble blasting (Torres et al., 2018), as well as consequences of disturbance events, on an individual and population health perspective. 

Inhalation duration has been explored in the past by using captive animals. For example, there have been studies on heart rate and breathing of bottlenose dolphins in human care facilities (Blawas et al., 2021; Fahlman et al., 2015). Recently, Nazario et al. (2022) was able to measure inhalation duration and blowhole area using suction-cup video tags. Her study led us to consider if it was possible to measure the parameters and variation around respiration by measuring blowhole area and inhalation duration of PCFGs from drone imagery. We employed MorphoMetriX to study the length, width, and area of a blowhole (Figure 2). Preliminary analyses verified that the areas of the left and right blowholes are very similar (Figure 3); this finding saved us a lot of time because from thereon we only measured either the left or right side. Interestingly, we see some variation in blowhole area within and across individuals (Figure 4). This variation changes within individuals based on primary state. For example, the whales “Glacier”, “Nimbus”, and “Rat” show very little variation whilst traveling but a large amount whilst foraging. Comparatively, “Dice” shows little variation whilst foraging and large variation whilst traveling. Whilst considering cross-individual comparisons, we can see that “Sole”, “Rat”, “Nimbus”, “Heart”, “Glacier”, “Dice”, and “Coal” each exhibit relatively large amounts of variation, yet “Mahalo”, “Luna”, “Harry”, “Hummingbird” and “Batman” exhibit very little. One potential reason for some individuals displaying higher levels of variation than others could be higher levels of exposure to disturbance events that we were unable to measure or evaluate in this study.

Figure 2. How we measured the length, width, and area of a blowhole using MorphoMetriX.

Figure 3. Data driven evidence that the left and the right blowhole areas are very similar. 

Figure 4. Variation in blowhole area amongst individual PCFG whales. The hollow circles represent the means, and the color represents the primary state the whale is exhibiting, foraging (purple) vs. traveling (blue), which will be further explored in Clara’s PhD.

Now, we are venturing into June and are at a stage where we (KC, Clara, Jim, Leigh, and I) are preparing to publish a manuscript! What a way to finish such a fantastic year! The transition from a 3-month-long pilot study to a much larger data analysis and eventual preparation for a manuscript has been a monumental learning experience. If anybody had told me a year ago that I would be involved in publishing a body of work – especially one that is so meaningful to me – I would simply not have believed them! We hope this established methodology for measuring blowholes will help other researchers carry out blowhole measurements using drone imagery across different populations and species. Further research is required to explore the differences in inhalation duration and blowhole area between different primary states, specifically across different foraging tactics.

It has been a great privilege working with the GEMM Lab these past months, and I was grateful to be included in their monthly lab meetings, during which members gave updates and we discussed recently published papers. Seeing such an enthusiastic, kind, and empathic group of people working together taught me what working in a supportive lab could look and feel like. In spite of relocating from Corvallis to Bend after my first term, I was happy to be able to continue working remotely for the lab for the remainder of my time (even though I was ~200 miles inland). I thoroughly enjoyed living in Corvallis, highlights of which were scuba diving adventures to the Puget Sound and coastal road trips with friends. The appeal to move arose from Bend’s reputation as an adventure hub – with unlimited opportunities for backcountry ski access – as well as its selection of wildlife ecology courses (with a focus on species specific to central Oregon). I moved into ‘Bunk & Brew’ (Bend’s only hostel, which is more like a big house of friends with occasional hostel guests) on January 1st after returning from spending Christmas with friends in my old home in Banff, Canada. I have since been enjoying this wonderful multifaceted lifestyle; working remotely in the GEMM Lab, attending in-person classes, working part-time at the hostel, as well as skiing volcanoes (Mount Hood, Middle and South Sister (Figure 5) or climbing at Smith Rock during my days off. Inevitably, I do miss the beautiful Oregon coast, and I will always be grateful for this ideal opportunity and hope this year marks the start of my marine megafauna career!

Figure 5. What I get up to when I’m not studying blowholes! (This was taken at 5am on the long approach to Middle and North Sister. North Sister is the peak featured in the backdrop).

References

Blawas, A. M., Nowacek, D. P., Allen, A. S., Rocho-Levine, J., & Fahlman, A. (2021). Respiratory sinus arrhythmia and submersion bradycardia in bottlenose dolphins (Tursiops truncatus). Journal of Experimental Biology, 224(1), jeb234096. https://doi.org/10.1242/jeb.234096

Fahlman, A., Loring, S. H., Levine, G., Rocho-Levine, J., Austin, T., & Brodsky, M. (2015). Lung mechanics and pulmonary function testing in cetaceans. Journal of Experimental Biology, 218(13), 2030–2038. https://doi.org/10.1242/jeb.119149

Lemos, L. S., Haxel, J. H., Olsen, A., Burnett, J. D., Smith, A., Chandler, T. E., Nieukirk, S. L., Larson, S. E., Hunt, K. E., & Torres, L. G. (2022). Effects of vessel traffic and ocean noise on gray whale stress hormones. Scientific Reports, 12(1), 18580. https://doi.org/10.1038/s41598-022-14510-5

Lemos, L. S., Olsen, A., Smith, A., Burnett, J. D., Chandler, T. E., Larson, S., Hunt, K. E., & Torres, L. G. (2022). Stressed and slim or relaxed and chubby? A simultaneous assessment of gray whale body condition and hormone variability. Marine Mammal Science, 38(2), 801–811. https://doi.org/10.1111/mms.12877

Nazario, E. C., Cade, D. E., Bierlich, K. C., Czapanskiy, M. F., Goldbogen, J. A., Kahane-Rapport, S. R., van der Hoop, J. M., San Luis, M. T., & Friedlaender, A. S. (2022). Baleen whale inhalation variability revealed using animal-borne video tags. PeerJ, 10, e13724. https://doi.org/10.7717/peerj.13724

Scordino, J., Carretta, J., Cottrell, P., Greenman, J., Savage, K., & Scordino, J. (2017). Ship Strikes and Entanglements of Gray Whales in the North Pacific Ocean. Cambridge: International Whaling Commission, 1924–2015.

Sullivan, F. A., & Torres, L. G. (2018). Assessment of vessel disturbance to gray whales to inform sustainable ecotourism: Vessel Disturbance to Whales. The Journal of Wildlife Management, 82(5), 896–905. https://doi.org/10.1002/jwmg.21462

Sumich, J. L. (1994). Oxygen extraction in free-swimming gray whale caves. Marine Mammal Science, 10(2), 226–230. https://doi.org/10.1111/j.1748-7692.1994.tb00266.x

Torres, W., & Bierlich, K. (2020). MorphoMetriX: A photogrammetric measurement GUI for morphometric analysis of megafauna. Journal of Open Source Software, 5(45), 1825. https://doi.org/10.21105/joss.01825

Torres, L. G., Nieukirk, S. L., Lemos, L., & Chandler, T. E. (2018). Drone Up! Quantifying Whale Behavior From a New Perspective Improves Observational Capacity. Frontiers in Marine Science, 5, 319. https://doi.org/10.3389/fmars.2018.00319
Williams, T. M. (1999). The evolution of cost efficient swimming in marine mammals: Limits to energetic optimization. Philosophical Transactions of the Royal Society of London. Series B: Biological Sciences, 354(1380), 193–201. https://doi.org/10.1098/rstb.1999.0371

As waters warm, what are “anomalous conditions” in the face of climate change?

By Dr. Dawn Barlow, Postdoctoral Scholar, OSU Department of Fisheries, Wildlife, and Conservation Sciences, Geospatial Ecology of Marine Megafauna Lab

Recently, I had the opportunity to attend the Effects of Climate Change on the World’s Ocean (ECCWO) conference. This meeting brought together experts from around the world for one week in Bergen, Norway, to gather and share the latest information on how oceans are changing, what is at risk, responses that are underway, and strategies for increasing climate resilience, mitigation, and adaptation. I presented our recent findings from the EMERALD project, which examines gray whale and harbor porpoise distribution in the Northern California Current over the past three decades. Beyond sharing my postdoctoral research widely for the first time and receiving valuable feedback, the ECCWO conference was an incredibly fruitful learning experience. Marine mammals can be notoriously difficult to study, and often the latest methodological approaches or conceptual frameworks take some time to make their way into the marine mammal field. At ECCWO, I was part of discussions at the ground floor of how the scientific community can characterize the impacts of climate change on the ecosystems, species, and communities we study.

One particular theme became increasingly apparent to me throughout the conference: as the oceans warm, what are “anomalous conditions”? There was an interesting dichotomy between presentations focusing on “extreme events,” “no-analog conditions,” or “non-stationary responses,” compared with discussions about the overall trend of increasing temperatures due to climate change. Essentially, the question that kept arising was, what is our frame of reference? When measuring change, how do we define the baseline?

Marine heatwaves have emerged as an increasingly prevalent phenomenon in recent years (see previous GEMM Lab blogs about marine heatwaves here and here). The currently accepted and typically applied definition of a marine heatwave is when water temperatures exceed a seasonal threshold (greater than the 90th percentile) for a given length of time (five consecutive days or longer) (Hobday et al. 2016). These marine heatwaves can have substantial ecosystem-wide impacts including changes in water column structure, primary production, species composition, distribution, and health, and fisheries management such as closures and quota changes (Cavole et al. 2016, Oliver et al. 2018). Through some of our own previous research, we documented that blue whales in Aotearoa New Zealand shifted their distribution (Barlow et al. 2020) and reduced their reproductive effort (Barlow et al. 2023) in response to marine heatwaves. Concerningly, recent projections anticipate an increase in the frequency, intensity, and duration of marine heatwaves under global climate change (Frölicher et al. 2018, Oliver et al. 2018).

However, as the oceans continue to warm, what baseline do we use to define anomalous events like marine heatwaves? Members of the US National Oceanic and Atmospheric Administration (NOAA) Marine Ecosystem Task Force recently put forward a comment article in Nature, proposing revised definitions for marine heatwaves under climate change, so that coastal communities have the clear information they need to adapt (Amaya et al. 2023). The authors posit that while a “fixed baseline” approach, which compares current conditions to an established period in the past and has been commonly used to-date (Hobday et al. 2016), may be useful in scenarios where a species’ physiological limit is concerned (e.g., coral bleaching), this definition does not incorporate the combined effect of overall warming due to climate change. A “shifting baseline” approach to defining marine heatwaves, in contrast, uses a moving window definition for what is considered “normal” conditions. Therefore, this shifting baseline approach would account for long-term warming, while also calculating anomalous conditions relative to the current state of the system.

An overview of two different definitions for marine heatwaves, relative to either fixed or shifting baselines. Reproduced from Amaya et al. 2023.

Why bother with these seemingly nuanced definitions and differences in terminology, such as fixed versus shifting baselines for defining marine heatwave events? The impacts of these events can be extreme, and potentially bear substantial consequences to ecosystems, species, and coastal communities that rely on marine resources. With the fixed baseline definition, we may be headed toward perpetual heatwave conditions (i.e., it’s almost always hotter than it used to be), at which point disentangling the overall warming trends from these short-term extremes becomes nearly impossible. What the shifting baseline definition means in practice, however, is that in the future temperatures would need to be substantially higher than the historical average in order to qualify as a marine heatwave, which could obscure public perception from the concerning reality of warming oceans. Yet, the authors of the Nature comment article claim, “If everything is extremely warm all of the time, then the term ‘extreme’ loses its meaning. The public might become desensitized to the real threat of marine heatwaves, potentially leading to inaction or a lack of preparedness.” Therefore, clear messaging surrounding both long-term warming and short-term anomalous conditions are critically important for adaptation and resource allocation in the face of rapid environmental change.

While the findings presented and discussed at an international climate change conference could be considered quite disheartening, I left the ECCWO conference feeling re-invigorated with hope. Crown Prince Haakon of Norway gave the opening plenary and articulated that “We need wise and concerned scientists in our search for truth”. Later in the week, I was a co-convenor of a session that gathered early-career ocean professionals, where we discussed themes such as how we deal with uncertainty in our own climate change-related ocean research, and importantly, how do we communicate our findings effectively. Throughout the meeting, I had formal and informal discussions about methods and analytical techniques, and also about what connects each of us to the work that we do. Interacting with driven and dedicated researchers across a broad range of disciplines and career stages gave me some renewed hope for a future of ocean science and marine conservation that is constructive, collaborative, and impactful.

Enjoying the ~anomalously~ sunny April weather in Bergen, Norway, during the ECCWO conference.

Now, as I am diving back in to understanding the impacts of environmental conditions on harbor porpoise and gray whale habitat use patterns through the EMERALD project, I am keeping these themes and takeaways from the ECCWO conference in mind. The EMERALD project draws on a dataset that is about as old as I am, which gives me some tangible perspective on how things have things changed in the Northern California Current during my lifetime. We are grappling with what “anomalous” conditions are in this dynamic upwelling system on our doorstep, whether these anomalies are even always bad, and how conditions continue to change in terms of cyclical oscillations, long-term trends, and short-term events. Stay tuned for what we’ll find, as we continue to disentangle these intertwined patterns of change.

Did you enjoy this blog? Want to learn more about marine life, research, and conservation? Subscribe to our blog and get a weekly alert when we make a new post! Just add your name into the subscribe box below!

Loading

References

Amaya DJ, Jacox MG, Fewings MR, Saba VS, Stuecker MF, Rykaczewski RR, Ross AC, Stock CA, Capotondi A, Petrik CM, Bograd SJ, Alexander MA, Cheng W, Hermann AJ, Kearney KA, Powell BS (2023) Marine heatwaves need clear definitions so coastal communities can adapt. Nature 616:29–32.

Barlow DR, Bernard KS, Escobar-Flores P, Palacios DM, Torres LG (2020) Links in the trophic chain: Modeling functional relationships between in situ oceanography, krill, and blue whale distribution under different oceanographic regimes. Mar Ecol Prog Ser 642:207–225.

Barlow DR, Klinck H, Ponirakis D, Branch TA, Torres LG (2023) Environmental conditions and marine heatwaves influence blue whale foraging and reproductive effort. Ecol Evol 13:e9770.

Cavole LM, Demko AM, Diner RE, Giddings A, Koester I, Pagniello CMLS, Paulsen ML, Ramirez-Valdez A, Schwenck SM, Yen NK, Zill ME, Franks PJS (2016) Biological impacts of the 2013–2015 warm-water anomaly in the northeast Pacific: Winners, losers, and the future. Oceanography 29:273–285.

Frölicher TL, Fischer EM, Gruber N (2018) Marine heatwaves under global warming. Nature 560.

Hobday AJ, Alexander L V., Perkins SE, Smale DA, Straub SC, Oliver ECJ, Benthuysen JA, Burrows MT, Donat MG, Feng M, Holbrook NJ, Moore PJ, Scannell HA, Sen Gupta A, Wernberg T (2016) A hierarchical approach to defining marine heatwaves. Prog Oceanogr.

Oliver ECJ, Donat MG, Burrows MT, Moore PJ, Smale DA, Alexander L V., Benthuysen JA, Feng M, Sen Gupta A, Hobday AJ, Holbrook NJ, Perkins-Kirkpatrick SE, Scannell HA, Straub SC, Wernberg T (2018) Longer and more frequent marine heatwaves over the past century. Nat Commun 9:1–12.

A Gut Feeling: DNA Metabarcoding Gray Whale Diets

By Charles Nye, graduate student, OSU Department of Fisheries, Wildlife, & Conservation Sciences, Cetacean Conservation and Genomics Laboratory

Figure 1: An illustration (by me) of a feeding gray whale whose caudal end transitions into a DNA double helix.

Let’s consider how much stuff organisms shed daily. If you walk down a hallway, you’ll leave a microscopic trail of skin cells, evaporated sweat, and even more material if you so happen to sneeze or cough (as we’ve all learned). The residency of these bits and pieces in a given environment is on the order of days, give or take (Collins et al. 2018). These days, we can extract, amplify, and sequence DNA from leftover organismal material in environments (environmental DNA; eDNA), stomach contents (dietary DNA, dDNA), and other sources (Sousa et al. 2019; Chavez et al. 2021).

You might be familiar with genetic barcoding, where scientists are able to use documented and annotated pieces of a genome to identify a piece of DNA down to a species. Think of these as genetic fingerprints from a crime scene where all (described) species on Earth are prime suspects. With advancements in computing technology, we can barcode many species at the same time—a process known as metabarcoding. In short, you can now do an ecosystem-wide biodiversity survey without even needing to see your species of interest (Ficetola et al. 2008; Chavez et al. 2021).

(Before you ask: yes, people have tried sampling Loch Ness and came up with not a single strand of plesiosaur DNA (University of Otago, 2019).)

I received my crash course on metabarcoding when I was employed at the Monterey Bay Aquarium Research Institute (MBARI), right before grad school. There, I was employed to help refine eDNA survey field and laboratory methods (in addition to some cool robot stuff). Here at OSU, I use metabarcoding to research whale ecology, detection, and even a little bit of forensics  work. Cetacean species (or evidence thereof) I’ve worked on include North Atlantic right whales (Eubalaena glacialis), killer whales (Orcinus spp.), and gray whales (Eschrichtius robustus).

Long-time readers of the GEMM Lab Blog are probably quite knowledgeable about the summertime grays—the Pacific Coast Feeding Group (PCFG). All of us here at OSU’s Marine Mammal Institute (MMI) are keenly interested in understanding why these whales hang out in the Pacific Northwest during the summer months and what sets them apart from the rest of the Eastern North Pacific gray whale population. What interests me? Well, I want to double-check what they’re eating—genetically.

“What does my study species eat?” is a straightforward but underappreciated question. It’s also deceptively difficult to address. What if your species live somewhere remote or relatively inaccessible? You can imagine this is a common logistical issue for most research in marine sciences. How many observations do you need to make to account for seasonal or annual changes in prey availability? Do all individuals in your study population eat the same thing? I certainly like to mix and match my diet.

Gray whale foraging ecology has been studied comprehensively over the last several decades, including an in-depth stomach content evaluation by Mary Nerini in 1984 and GEMMer Lisa Hildebrand’s MSc research. PCFG whales seem to prefer shrimpy little creatures called mysids, along with Dungeness crab (Cancer magister) larvae, during their stay in the Pacific Northwest (PNW), most notably the mysid Neomysis rayii (Guerrero 1989; Hildebrand et al. 2021). Indeed, the average energetic values of common suspected prey species in PNW waters rival the caloric richness of Arctic amphipods (Hildebrand et al. 2021). However, despite our wealth of visual foraging observations, metabarcoding may add an additional layer of resolution. For example, the ocean sunfish (Mola mola) was believed to exclusively forage on gelatinous zooplankton, but a metabarcoding approach revealed a much higher diversity of prey items, including other bony fishes and arthropods (Sousa et al. 2016).

Given all this exposition, you may be wondering: “Charles—how do you intend on getting dDNA from gray whales? Are you going to cut them open?”

Figure 2: The battle station, a vacuum pump that I use to filter out all of the particulate matter from a gray whale dDNA sample. The filter is made of polycarbonate track etch material, which melts away in the DNA extraction process—quite handy, indeed!

No. I’m going to extract DNA from their poop.

Well, actually, I’ve been doing that for the last two years. My lab (Cetacean Conservation and Genomics Laboratory, CCGL) and GEMM Lab have been collaborating to make lemonade out of, er…whale poop. An archive of gray whale fecal samples (with ongoing collections every field season) originally collected for hormone analyses presented itself with new life—the genomics kind. In addition to community-level data, we are also able to recover informative DNA from the gray whales, including sex ID from “depositing” individuals, though the recovery rate isn’t perfect.

Because the GEMM Lab/MMI can non-invasively collect multiple samples from the same individuals over time, dDNA metabarcoding is a great way to repeatedly evaluate the diets of the PCFG, just shy of being at the right place at the right time with a GoPro or drone to witness a feeding event.  While we can get stomach contents and even usable dDNA from a naturally deceased whale, those data may not be ideal. How representative a stranded whale is of the population is dependent on the cause of death; an emaciated or critically injured individual, for example, is a strong outlier.

Figure 3: Presence/absence of the top 10 most-common taxonomic Families observed in the PCFG gray whale dDNA dataset (n = 20, randomly selected). Filled-in dots indicate at least one genetic read associated with that Family, and empty dots indicate none. Note the prey taxa: mysids (Mysidae), krill (Euphausiidae), and olive snails (Olividae).

Here’s a snapshot of progress to date for this dDNA metabarcoding project. I pulled out twenty random samples from my much larger working dataset (n = 82) for illustrative purposes (and legibility). After some bioinformatic wizardry, we can use a presence/absence approach to get an empirical glimpse at what passes through a PCFG gray whale. While I am able to recover species-level information, using higher-level taxonomic rankings summarizes the dataset in a cleaner fashion (and also, not every identifiable sequence resolves to species).

The title of most commonly observed prey taxa belongs to our friends, the mysids (Mysidae). Surprisingly, crabs and amphipods are not as common in this dataset, instead losing to krill (Euphausiidae) and olive snails (Olividae). The latter has been found in association with gray whale foraging grounds but not documented in a prey study (Jenkinson 2001). We also get an appreciable amount of interference from non-prey taxa, most notably barnacles (Balanidae), with an honorable mention to hydrozoans (Clytiidae, Corynidae). While easy to dismiss as background environmental DNA, as gray whales do forage at the benthos, these taxa were physically present and identifiable in Nerini’s (1984) gray whale stomach content evaluation.

So—can we conclude that barnacles and hydrozoans are an important part of a gray whale’s diet, as much as mysids? From decades of previous observations, we might say…probably not. Gray whales are actively targeting patches of crabby, shrimpy zooplankton things, and even employ novel foraging strategies to do so (Newell & Cowles 2006; Torres et al. 2018). However, the sheer diversity of consumed species does present additional dimensionality to our understanding of gray whale ecology.

The whales are eating these ancillary organisms, whether they intend to or not, and this probably does influence population dynamics, recruitment, and succession in these nearshore benthic habitats. After all, the shallow pits that gray whales leave behind post-feeding provide a commensal trophic link with other predatory taxa, including seabirds and groundfish (Oliver & Slattery 1985). Perhaps the consumption of these collateral species affects gray whale energetics and reflects on their “performance”?

I hope to address all of this and more in some capacity with my published work and graduate chapters. I’m confident to declare that we can document diet composition of PCFG whales using dDNA metabarcoding, but what comes next is where one can get lost in the sea(weeds). How does the diet of individuals compare to one another? What about at differing time points? Age groups? How many calories are in a barnacle? No need to fret—this is where the fun begins!

References

Chavez F, Min M, Pitz K, Truelove N, Baker J, LaScala-Grunewald D, Blum M, Walz K,

Nye C, Djurhuus A, et al. 2021. Observing Life in the Sea Using Environmental

DNA Oceanog. 34(2):102–119. doi:10.5670/oceanog.2021.218.

Collins R, Wangensteen OS, O’Gorman EJ, Mariani S, Sims DW, Genner M. 2018. Persistence

of environmental DNA in marine systems. Comm Biol. 1(185).

https://doi.org/10.1038/s42003-018-0192-6

Ficetola GF, Miaud C, Pompanon F, Taberlet P. 2008. Species detection using

environmental DNA from water samples. Biol Lett. 4(4):423–425.

doi:10.1098/rsbl.2008.0118.

Hildebrand L, Bernard KS, Torres LG. 2021. Do Gray Whales Count Calories?

Comparing Energetic Values of Gray Whale Prey Across Two Different Feeding

Grounds in the Eastern North Pacific. Front Mar Sci. 8:683634.

doi:10.3389/fmars.2021.683634.

Jenkinson R. 2001. Gray whale (Eschrichtius robustus) prey availability and feeding ecology in

northern California, 1999-2000 [thesis]. California State Polytechnic University,

Humboldt. 81 p.

Newell CL, Cowles TJ. 2006. Unusual gray whale Eschrichtius robustus feeding in the summer

of 2005 off the central Oregon Coast. Geophys Res Lett. 33(22):L22S11.

doi:10.1029/2006GL027189.

Oliver JS, Slattery PN. 1985. Destruction and Opportunity on the Sea Floor: Effects of

Gray Whale Feeding. Ecology. 66(6):1965–1975. doi:10.2307/2937392.

Sousa LL, Silva SM, Xavier R. 2019. DNA metabarcoding in diet studies: Unveiling

ecological aspects in aquatic and terrestrial ecosystems. Environmental DNA.

1(3):199–214. doi:10.1002/edn3.27.

Sousa LL, Xavier R, Costa V, Humphries NE, Trueman C, Rosa R, Sims DW, Queiroz N.

2016. DNA barcoding identifies a cosmopolitan diet in the ocean sunfish. Sci

Rep. 6(1):28762. doi:10.1038/srep28762.

Torres LG, Nieukirk SL, Lemos L, Chandler TE. 2018. Drone Up! Quantifying Whale Behavior

From a New Perspective Improves Observational Capacity. Front Mar Sci. 5:319.

doi:10.3389/fmars.2018.00319.

University of Otago. 2019. First eDNA study of Loch Ness points to something fishy.

https://www.otago.ac.nz/news/news/otago717609.html. [accessed 2023 Apr 25]

Navigating the Research Rollercoaster

By Amanda Rose Kent, College of Earth Ocean and Atmospheric Sciences, OSU, GEMM Lab/Krill Seeker undergraduate intern

If you asked me five years ago where I’d thought I’d be today, the answer I would give would not reflect where I am now. Back then, I was a customer service representative for a hazardous waste company, and I believed that going to university and participating in research was a straightforward experience. I learned soon after I left that career and began my journey at OSU in 2020 that I wasn’t even remotely aware of the process. I knew that as part of my oceanography degree I would need to become involved in some form of research, but I had no idea where to start.

I started looking through the Oregon State website and I eventually found an outdated flier from 2018 that advertised a lab that studied plankton in Antarctica, and that was when I first reached out to Dr. Kim Bernard. My journey took off from there. As an undergraduate researcher in the URSA Engage program working with Kim and one of her graduate students, Rachel, I conducted a literature review on the ecosystem services provided by two species of krill off the coast of Oregon, including their value to baleen whales. After learning all I could from the literature about krill and how important they were to the ocean, I knew that there was so much more to learn and that this was the topic I wanted to continue to pursue. After I completed the URSA program, I remained a member of Kim’s zooplankton ecology lab.

While continuing to work with Rachel, I was given the opportunity to join the GEMM Lab’s Project HALO for a daylong cruise conducting a whale survey along the Newport Hydrographic Line. I was initially brought on to learn how to use the echosounder to collect krill data but unfortunately, the device had technical difficulties and Rachel and I were no longer needed. We decided to go on the cruise anyway, and I was able to instead learn how to survey for marine mammals (it’s not as easy as it may seem, but still very fun!).

Figure 1. Enjoying the point of view from the crow’s nest on the R/V Pacific Storm, but also very cold.

Soon, another opportunity arose to apply for a brand-new program called ARC-Learn. This two-year research program focuses on studying the Arctic using publicly available data, and with the support of my mentors, I applied and was accepted. Initially I found that there were no mentors within the program that studied krill, so I found myself becoming immersed in a new topic: harmful algal blooms (HABs). Determined to incorporate krill into this research, I started looking through the literature trying to develop my hypothesis that HABs affected zooplankton in some way. There was evidence to potentially support my hypothesis, but I ended up encountering numerous data gaps in the region I was studying. After months of roadblocks, I eventually started feeling defeated and regretted applying for the program. Rachel was quick to remind me that all experiences are valuable experiences, and that I was still gaining new skills I could use in graduate school or my career.

As my undergraduate degree progressed, I continued supporting Rachel in her graduate research, spending some time during the summer processing krill samples by sorting, sexing, and drying them to crush them into pellets. Our goal was to process them in an instrument called a bomb calorimeter, which is used to quantify the caloric content of prey species and help us better understand the energy flux required for animals higher up the food chain (like whales) and the amount they need to eat. I was only able to do this for a few weeks before heading out on the experience of a lifetime, spending three weeks on a ship traveling around the Bering, Chukchi, and Beaufort Seas with one of my ARC-Learn mentors. It was a great opportunity for me to see the toxic phytoplankton (which can form HABs) I had been studying and learn about methods of sample collection and processing. If I could go back and do it again, I’d go in a heartbeat.

Figure 2. Pulling out all of the animal biomass out of the Arctic sediment.

At the beginning of my bachelor’s degree, I had expected to just work with Kim and conduct research within her lab. Instead, I have had opportunities I would never have expected five years ago. I have learned a vast amount from my graduate mentor, Rachel, which has helped influence my trajectory in my degree. I have had the privilege to not only meet giants in the field I’m interested in, but also work with them and learn from them, and to spend three weeks in the Arctic Ocean.  The experiences I have had throughout this roller-coaster helped me develop a project idea with new mentors that I eventually hope to pursue in my master’s degree. I wasn’t prepared for the number of adjustments I would make to find new experiences and start new projects, but all the experiences I had were necessary to learn about what I was interested in and what I wanted to pursue. Looking back on it all today, I have zero regrets.

Figure 3. A picture of the Norseman II, the ship I was on in the Arctic, taken by the Japanese ship JAMSTEC on a short rendezvous between the Chukchi and Beaufort Seas.
Loading

Migrating south to another foraging ground

By Rachel Kaplan, PhD student, OSU College of Earth, Ocean and Atmospheric Sciences and Department of Fisheries, Wildlife, & Conservation Sciences, Geospatial Ecology of Marine Megafauna Lab 

Krill, a shrimplike crustacean found across our oceans, embodies the term “small but mighty”. Though individuals tend to be small, sometimes weighing in at less than a gram, the numerous species of krill have a global distribution and are estimated to collectively outweigh the entire human population. Much of my graduate research focuses on relationships between foraging whales and krill (Euphausia pacifica and Thysanoessa spinifera) in the Northern California Current (NCC) region. This work hinges on themes that are universal across environments: just as krill are ubiquitous across the global ocean, questions of prey quality, distribution, and ecological relationships with predators are universal.

Next week, I’m headed south to consider these questions in a very different foraging environment: the Western Antarctic Peninsula (WAP). One benefit of being a co-advised student is the incredible opportunity to be exposed to diverse projects and types of research. My graduate co-advisor, Kim Bernard, has studied krill in the WAP region for over a decade, and she is currently leading research into the implications of the shifting polar food web for Antarctic krill (Euphasia superba). Through a series of laboratory experiments and fieldwork, the project, titled “The Omnivore’s Dilemma: The effect of autumn diet on winter physiology and condition of juvenile Antarctic krill”,  investigates the impact of climate-driven changes in diet on the health of juvenile krill in autumn and winter, a key time for their survival and recruitment. Winter is a poorly studied season in Antarctica, and this project has already shed light on the physiology, respiration, and growth potential of juvenile krill (Bernard et al., 2022).

 Figure 1: Antarctic krill are much bigger than those found in the NCC region – they can be as long as your thumb! (Source: Australian Antarctic Program)

Just as in the NCC region, krill are an essential link in Southern Ocean food webs, where they transfer energy from their microscopic prey to the higher trophic levels that eat them, including several species of fish, seals, penguins, and whales (Bernard & Steinberg, 2013; Cavan et al., 2019; Ducklow et al., 2013). These predators depend upon this high-quality prey to fuel their seasonal migrations and to build the energy reserves they need to survive the frigid Antarctic winter (Cade et al., 2022; Schaafsma et al., 2018). But, the quality of krill depends upon the food that it can consume itself, and climate change may alter their diet.

There’s a lot to love about krill, but my fascination with them is directly tied to their value as a food source for predators. I want to know how the caloric content of individuals and the aggregations they form changes spatially along the WAP, and how this might shift under climate-forced food web changes. This work will clarify the climate-driven variability in the quality of krill as prey, and the implications this might have for top predators in the region.

Figure 2: The upcoming field season will involve sampling krill along a latitudinal gradient in the WAP region, spanning approximately from the Gerlache Strait in the north to Marguerite Bay in the south (Bernard et al., 2022).

In order to investigate these questions, I’ll be spending the next six months based out of Palmer Station, the smallest of the United States’ research bases in Antarctica, along with Kim and our undergraduate intern Abby. During this upcoming field season, we’ll spend about a month at sea collecting krill samples and active acoustic data using an echosounder, and the rest of the time conducting experiments and sampling in the nearshore. Over the last year, Abby has worked with me to quantify krill caloric content in the NCC, as well as processing samples collected in Antarctica last year. I’m so impressed by everything she’s accomplished, and excited to see her take in this environment, learn a fresh set of experimental and field sampling approaches, and be inspired to ask new questions.

Figure 3: Abby preparing NCC krill samples for caloric analysis (Kim Kenny/OSU CEOAS).

For me, heading south will be a bit like coming home. After graduating from college, I spent about nine months living at Palmer Station and working on the microbial ecology component of the long-term ecological research station there. The experience of being immersed in the WAP environment was foundational to my curiosity about ocean ecology and the impacts of climate change. It is also where I met Kim! All in all, this environment fueled my desire to study krill with Kim and spatial ecology with Leigh, and set me on the course I’m on today.

It also feels meaningful to return here again at this point in my educational journey. With new knowledge and questions I have formed while working in the NCC, I am now excited to apply this knowledge and consider similar questions in the WAP. Abby and I will write blogs through the season and post them here, so stay tuned for news from down south!

Figure 4: Kim and I (the two farthest right in the front row) prepare for a group costumed polar plunge in 2015. Will we do it again? We’ll keep you posted!
Loading

References

Bernard, K. S., & Steinberg, D. K. (2013). Krill biomass and aggregation structure in relation to tidal cycle in a penguin foraging region off the Western Antarctic Peninsula. ICES Journal of Marine Science, 70(4), 834–849. https://doi.org/10.1093/icesjms/fst088

Bernard, K. S., Steinke, K. B., & Fontana, J. M. (2022). Winter condition, physiology, and growth potential of juvenile Antarctic krill. Frontiers in Marine Science, 9, 990853. https://doi.org/10.3389/fmars.2022.990853

Cade, D. E., Kahane-Rapport, S. R., Wallis, B., Goldbogen, J. A., & Friedlaender, A. S. (2022). Evidence for Size-Selective Predation by Antarctic Humpback Whales. Frontiers in Marine Science, 9, 747788. https://doi.org/10.3389/fmars.2022.747788

Cavan, E. L., Belcher, A., Atkinson, A., Hill, S. L., Kawaguchi, S., McCormack, S., Meyer, B., Nicol, S., Ratnarajah, L., Schmidt, K., Steinberg, D. K., Tarling, G. A., & Boyd, P. W. (2019). The importance of Antarctic krill in biogeochemical cycles. Nat Commun, 10(1), 4742. https://doi.org/10.1038/s41467-019-12668-7

Ducklow, H., Fraser, W., Meredith, M., Stammerjohn, S., Doney, S., Martinson, D., Sailley, S., Schofield, O., Steinberg, D., Venables, H., & Amsler, C. (2013). West Antarctic Peninsula: An Ice-Dependent Coastal Marine Ecosystem in Transition. Oceanography, 26(3), 190–203. https://doi.org/10.5670/oceanog.2013.62

Schaafsma, F. L., Cherel, Y., Flores, H., van Franeker, J. A., Lea, M.-A., Raymond, B., & van de Putte, A. P. (2018). Review: The energetic value of zooplankton and nekton species of the Southern Ocean. Marine Biology, 165(8), 129. https://doi.org/10.1007/s00227-018-3386-z

SST, EKE, SSH: Wading Through the Alphabet Soup of Oceanographic Parameters related to Deep-Dwelling Odontocetes

By: Marissa Garcia, PhD Student, Cornell University, Department of Natural Resources and the Environment, K. Lisa Yang Center for Conservation Bioacoustics

Predator-Prey Inference: A Tale as Old as Time

It’s a tale as old as time: where there’s prey, there’ll be predators.

As apex predators, cetaceans act as top-down regulators of ecosystem function. While baleen whales act as “ecosystem engineers,” facilitating nutrient cycling in the ocean (Roman et al., 2014), toothed whales, or “odontocetes,” can impart keystone-level effects — that is, they disproportionately control the marine community’s food-web structure (Valls, Coll, & Christensen, 2015). The menus of prey vary widely by species — ranging from mircronekton to fish to squid – and by extension, vary widely across trophic levels.

So, it naturally follows the old adage: where there’s an abundance of prey, there’ll be an abundance of cetaceans. Yet, creating models that accurately depict this predator-prey relationship is, perhaps unsurprisingly, not as straightforward.

Detecting the ‘Predator’ Half of the Equation

Scientists have successfully documented cetacean presence drawing upon a myriad of methods, each bearing its unique advantages and limitations.

Visual surveys — spanning viewpoints from land, boats, and air — can attain precise spatial data and species ID. However, this data can be constrained by “availability bias” — that is, scientists can only observe cetaceans visible at the surface, not those obscured by the ocean’s depths. Species that spend less time near the surface are more likely to elude the observer’s line of sight, thereby being missed in the data. Consequently, visual surveys have historically undersampled deep-diving species. For instance, since its discovery by western science in 1945, the Hubb’s beaked whale (Mesoplodon carlshubbi) has only been observed alive twice by OSU MMI’s very own Bob Pitman, once in 1994 and another time in 2021.

Scientists have also been increasingly conducting acoustic surveys to document cetacean presence. Acoustic recorders can “hear” each cetacean species at different ranges. Baleen whales, which bellow low-frequency calls, can be heard as far as across ocean basins (Munk et al., 1994). Toothed whales whistle, echolocate, and buzz at frequencies so high they’re considered ultrasonic. But it comes at a trade-off: high-frequency sounds have shorter wavelengths, meaning they are heard across smaller ranges. This high variability, which scientists refer to as “detection range,” translates to not always knowing where the vocalizing cetacean that was recorded is: as such, acoustic data can lack the high-resolution spatial precision often achieved by visual surveys. Nevertheless, acoustic data triumphs in temporal extent, sometimes managing to record continuously at six months at a time. Additionally, animals can elude visual detection in poor weather conditions or if they have a cryptic surface expression, but detected in acoustic surveys (e.g., North Atlantic right whales (Eubalaena glacialis) (Ganley, Brault, & Mayo, 2019; Clark et. al, 2010). Thus, acoustic surveys may be especially optimal for recording elusive deep-dwellers that occupy the often rough Oregon waters, such as beaked whales, the focus of my research in collaboration with the GEMM Lab.

Figure 1: HALO Project researchers Marissa Garcia (left; Yang Center via Cornell) and Imogen Lucciano (right; OSU MMI) among three Rockhopper acoustic recording units, ahead of deployment off the Oregon coast. Credit: Marissa Garcia.

Detecting the ‘Prey’ Half of the Equation

Prey can be measured by numerous methods. Most directly, prey can be measured “in-situ” — that is, prey is collected directly from the site where the cetaceans are detected or observed. A 2020 study combined fish trawls with a towed hydrophone array to identify which fish species odontocetes along the continental shelf of West Ireland (e.g., pilot whales, sperm whales, and Sowerby’s beaked whales) were feasting; the results found that odontocetes primarily fed upon mesopelagic fish and cephalopods (Breen et al., 2020). While trawls can glean species ID of prey, associating this prey data with depth and biomass can prove challenging.

Alternatively, prey can be detected via active acoustics. Echosounders release an acoustic signal that descends through the water column and then echoes back once it hits a sound-scattering organism. Beaked whales forage within deep scattering layers typically composed of myctophid fish and squid, both of which can echo back echosounder pings (Hazen et al., 2011). Thus, echosounder data can map prey density through the water column. When mapping prey density of beaked whales, Hazen et al. 2011 found a strong positive correlation among prey density, ocean vertical structure, and clicks primarily produced while foraging – suggesting beaked whales forage at depth when encountering large, multi-species aggregations of prey.

Figure 2: An example of prey mapping via a Simrad EK60 120 kHz split-beam echosounder. Credit: Rachel Kaplan (OSU MMI) via the HALO Project.

Most relevant to the HALO Project, prey is measured using proximate indices, which are more easily quantifiable metrics of ocean conditions, such as collected from ships via CTD casts or via satellite imagery, that are indirectly related to prey abundance. CTD data can provide information related to the water column structure, including depth and strength of the thermocline, depth of the mixed layer, depth of the euphotic zone, and total chlorophyll concentration in the euphotic zone (Redfern et al. 2006). Satellite imagery can characterize the dynamic patterns of the surface later, including sea surface temperature (SST), salinity, surface chlorophyll a, sea surface height (SSH), and sea surface currents (Virgili et al., 2022; Redfern et al., 2006). Ocean model data products can, such as the Regional Ocean Modeling System (ROMS) which models how an oceanic region of interest responds to physical processes, can provide water column variables related to eddy kinetic energy (EKE) and average temperature gradients (Virgili et al., 2022). In the case of my research with the HALO Project, we will be using oceanographic data collected through the Ocean Observatories Initiative to inform odontocete species distribution models.

Connecting the Dots: Linking Deep-Dwelling Top Predators and Prey

While scientists have made significant advances with collecting both cetacean and prey data, connecting the dots between the ecology of deep-dwelling odontocetes and the oceanographic parameters indicative of their prey still remains a challenge.

In the absence of in situ sampling, species distribution models of marine top predators often derive proxies for “prey data” from static bathymetric and dynamic surface water variables (Virgili et al., 2022). However, surface variables may be irrelevant to toothed whale prey inhabiting great depths (Virgili et al., 2022). Within the HALO Project, the deepest Rockhopper acoustic recording unit is recording odontocetes at nearly 3,000 m below the surface, putting into question the relevance of oceanographic parameters collected at the surface.

Figure 3: Schematic depicting the variation among different zones in the water column. Conditions at the surface may not represent conditions at depth. Credit: Barbara Ambrose, NOAA via NOAA Ocean Explorer.

In my research, I am setting out to estimate which oceanographic variables are optimal for explaining deep-dwelling odontocete presence. A 2022 study using visual survey data found that surface, subsurface, and static variables best explained beaked whale presence, whereas only surface and deep-water variables – not static – best explained sperm whale presence (Virgili et al., 2022). These results are associated with each species’ distinct foraging ecologies; beaked whales may truly only rely on organisms that live near the seabed, whereas sperm whales also feast upon meso-to-bathypelagic organisms, so they may be more sensitive to changes in water column conditions (Virgili et al., 2022). This study expanded the narrative: deep-water variables can also be key to predicting deep-dwelling odontocete presence. The oceanographic variables must be tailored to the ecology of each species of interest.

In the months ahead, I seek to build on this study by investigating which parameters best predict odontocete presence using an acoustic approach instead — I am looking forward to the results to come!

Loading

References

Breen, P., Pirotta, E., Allcock, L., Bennison, A., Boisseau, O., Bouch, P., Hearty, A., Jessopp, M., Kavanagh, A., Taite, M., & Rogan, E. (2020). Insights into the habitat of deep diving odontocetes around a canyon system in the northeast Atlantic ocean from a short multidisciplinary survey. Deep-Sea Research. Part I, Oceanographic Research Papers, 159, 103236. https://doi.org/10.1016/j.dsr.2020.103236

Clark, C.W., Brown, M.W., & Corkeron, P. (2010). Visual and acoustic surveys

for North Atlantic right whales, Eubalaena glacialis, in Cape Cod Bay, Massachusetts, 2001–2005: Management implications. Marine Mammal Science, 26(4), 837-854.

Ganley, L.C., Brault, S., & Mayo, C.A. (2019). What we see is not what there is: Estimating North Atlantic right whale Eubalaena glacialis local abundance. Endangered Species Research, 38, 101-113.

Hazen, E. L., Nowacek, D. P., St Laurent, L., Halpin, P. N., & Moretti, D. J. (2011). The relationship among oceanography, prey fields, and beaked whale foraging habitat in the Tongue of the Ocean. PloS One, 6(4), e19269–e19269.

Munk, W. H., Spindel, R. C., Baggeroer, A., & Birdsall, T. G. (1994). The Heard Island Feasibility Test. The Journal of the Acoustical Society of America, 96(4), 2330–2342. https://doi.org/10.1121/1.410105

Redfern, J. V., Ferguson, M. C., Becker, E. A., Hyrenbach, K. D., Good, C., Barlow, J., Kaschner, K., Baumgartner, M. F., Forney, K. A., Ballance, L. T., Fauchald, P., Halpin, P., Hamazaki, T., Pershing, A. J., Qian, S. S., Read, A., Reilly, S. B., Torres, L., & Werner, F. (2006). Techniques for cetacean–habitat modeling. Marine Ecology. Progress Series (Halstenbek), 310, 271–295.

Roman, J., Estes, J. A., Morissette, L., Smith, C., Costa, D., McCarthy, J., Nation, J., Nicol, S., Pershing, A., & Smetacek, V. (2014). Whales as marine ecosystem engineers. Frontiers in Ecology and the Environment, 12(7), 377–385.

Valls, A., Coll, M., & Christensen, V. (2015). Keystone species: toward an operational concept for marine biodiversity conservation. Ecological Monographs, 85(1), 29–47.

Virgili, A., Teillard, V., Dorémus, G., Dunn, T. E., Laran, S., Lewis, M., Louzao, M., Martínez-Cedeira, J., Pettex, E., Ruiz, L., Saavedra, C., Santos, M. B., Van Canneyt, O., Vázquez Bonales, J. A., & Ridoux, V. (2022). Deep ocean drivers better explain habitat preferences of sperm whales Physeter macrocephalus than beaked whales in the Bay of Biscay. Scientific Reports, 12(1), 9620–9620.