Makah Gray Whale Hunt Waiver – a long-time coming, but still premature?

By Lisa Hildebrand, MSc student, OSU Department of Fisheries & Wildlife, Marine Mammal Institute, Geospatial Ecology of Marine Megafauna Lab

Archaeological site of Ozette Village. Source: Makah Museum.

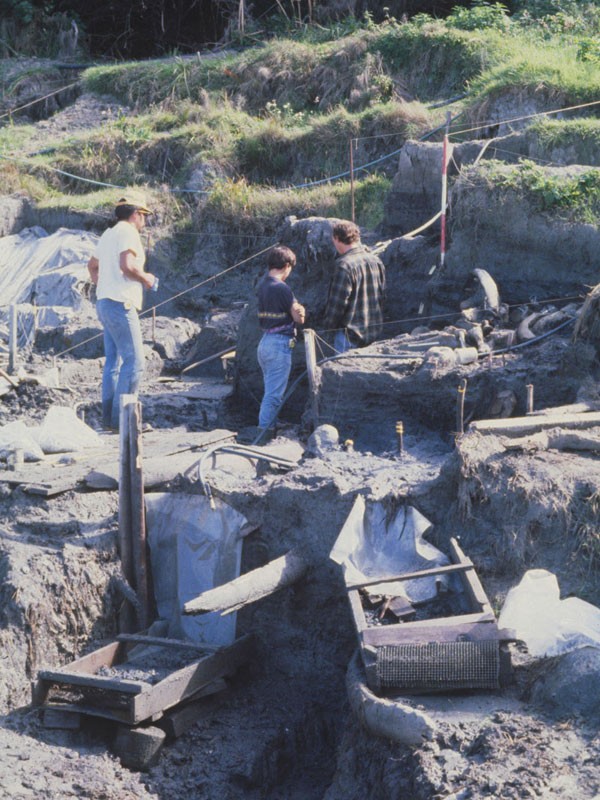
The Makah, an indigenous people of the Pacific Northwest Coast living in Washington State, have a long history with whaling. Deposits from a mudslide in the village of Ozette suggest that whaling may date back 2,000 years as archaeologists uncovered humpback and gray whale bones and barbs from harpoons (Kirk 1986). However, the history of Makah whaling is also quite recent. On January 29 of this year, the National Marine Fisheries Service (NMFS; informally known as NOAA Fisheries) announced a 45-day public comment period regarding a NMFS proposed waiver on the Marine Mammal Protection Act’s (MMPA) moratorium on the take of marine mammals to allow the Makah to take a limited number of eastern North Pacific gray whales (ENP). To understand how the process reached this point, we first must go back to 1855.

1855 marks the year in which the U.S. government and the Makah entered into the Treaty of Neah Bay (in Washington state). The Makah ceded thousands of acres of land to the U.S. government, and in return reserved their right to whale. Following the treaty, the Makah hunt of gray whales continued until the 1920s. At this point, commercial hunting had greatly reduced the ENP population, so much so that the Makah voluntarily ceased their whaling. The next seven decades brought about the formation of the International Whaling Commission (IWC), the enactment of the Whaling Convention Act, the listing of gray whales as endangered under the U.S. Endangered Species Act, and the enactment of the MMPA. For gray whales, these national and international measures were hugely successful, leading to the removal of the ENP from the Federal List of Endangered Wildlife in 1994 when it was determined that the population had recovered to near its estimated original population size.

One year later on May 5, 1995 (just one month after I was born!), the Makah asked the U.S. Department of Commerce to represent its interest to obtain a quota for gray whales from the IWC in order to resume their treaty right for ceremonial and subsistence harvest of the ENP. The U.S. government pursued this request at the next IWC meeting, and subsequently NMFS issued a final Environmental Assessment that found no significant impact to the ENP population if the hunt recommenced. The IWC set a catch limit and NMFS granted the Makah a quota in 1998. In 1999 the Makah hunted, struck and landed an ENP gray whale.

“Makahs cutting up whale, Neah Bay, ca. 1930. Photo by Asahel Curtis, Courtesy UW Special Collections (CUR767)”. Source and caption: History Link.

I will not go into detail about what happened between 1999 and now because frankly, a lot happened, particularly a lot of legal events including summary judgements, appeals, and a lot of other legal jargon that I do not quite understand. If you want to know the specifics of what happened in those two decades, I suggest you look at NMFS’ chronology of the Makah Tribal Whale Hunt. In short, cases brought against NMFS argued that they did not take a “hard [enough] look” at the National Environmental Policy Act when deciding that the Makah could resume the hunt. Consequently, the hunt was put on hold. Yet, in 2005 NMFS received a waiver request from the Makah on the MMPA’s take moratorium and NMFS published a notice of intent to review this request. A lot more happened between that event and now, including on January 29 of this year when NMFS announced the availability of transcripts from the Administrative Law Judge’s (ALJ) hearing (which happened from November 14-21, 2019) on the proposed regulations and waiver to allow the Makah to resume hunting the ENP. We are currently in the middle of the aforementioned 45-day public comment period on the formal rulemaking record. 

It has been 15 years since the Makah requested the waiver and while the decision has not yet been reached, we are likely nearing the end of this long process. This blog has turned into somewhat of a history lesson (not really my intention) but I feel it is important to understand the lengthy and complex history associated with the decision that is probably going to happen sometime this year. My actual intent for this blog is to ruminate on a few questions, some of which remain unanswered in my opinion, that are large and broad, and important to consider. Some of these questions point out gaps in our ecological knowledge regarding gray whales that I believe should be addressed for a truly informed decision to be made on NMFS’ proposed waiver now or anytime in the near future. 

1. Should the Pacific Coast Feeding Group (PCFG) of gray whales be recognized as its own stock?

Currently, the PCFG are considered a part of the ENP stock. This decision was published following a workshop held by a NMFS task force (Weller et al. 2013). The report concluded that based on photo-identification, genetics, tagging, and other data, there was a substantial level of uncertainty in the strength of the evidence to support the independence of the PCFG from the ENP. Nevertheless, mitochondrial genetic data have indicated a differentiation between the PCFG and the ENP, and the exchange rate between the two groups may be small enough for the two to be considered demographically independent (Frasier et al. 2011). Based on all currently available data, it seems that matrilineal fidelity plays a role in creating population structure within and between the PCFG and the ENP, however there has not been any evidence to suggest that whales from one feeding area (i.e. the PCFG range) are reproductively isolated from whales that utilize other feeding areas (i.e. the Arctic ENP feeding grounds) (Lang et al. 2011). Several PCFG researchers do argue that there needs to be recognition of the PCFG as an independent stock. It is clear that more research, especially efforts to link genetic and photo-identification data within and between groups, is required.

ENP gray whales foraging off the coast of Alaska on their main foraging grounds in the Bering Sea. Photo taken by ASAMM/AFSC. Funded by BOEM IAA No. M11PG00033. Source: NMFS.

2. Is emigration/immigration driving PCFG population growth, or is it births/deaths?

It is unclear whether the current PCFG population growth is a consequence of births and deaths that occur within the group (internal dynamics) or whether it is due to immigration and emigration (external dynamics). Likely, it is a combination of the two, however which of the two has more of an effect or is more prevalent? This question is important to answer because if population growth is driven more by external dynamics, then potential losses to the PCFG population due to the Makah hunt may not be as detrimental to the group as a whole. However, if internal dynamics play a bigger role, then the loss of just a few females could have long-term ramifications for the PCFG (Schubert 2019). NMFS has taken precautions to try and avoid such effects. In their proposed waiver, of the cumulative limit of 16 strikes of PCFG whales over the 10-year waiver period, no more than 8 of the strikes may be PCFG females (Yates 2019a). While a great step, it still begs the question how the loss of 8 females, admittedly over a rather long period of time, may affect population dynamics since we do not know what ultimately drives recruitment. Especially when taken together with potential non-lethal effects on whales (further discussed in question 5 below).

“Scarlet” is a PCFG female who has had multiple calves in the decades that researchers have seen her in the PCFG range. Image captured under NOAA/NMFS permit #21678. Source: L Hildebrand.

3. How important are individual patterns within the PCFG, and how might the loss of these individuals affect the population? 

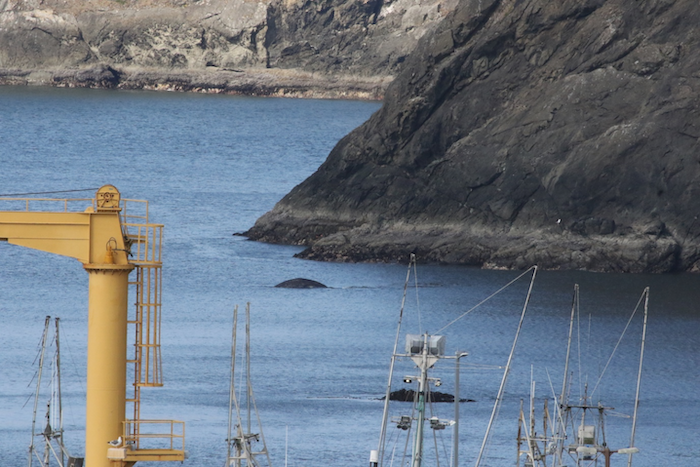
The hunt will be restricted to the Makah Usual & Accustomed fishing area (U&A), which is off the Washington coast. It has been shown that site fidelity among PCFG individuals is strong. In fact, based on the 143 PCFG gray whales observed in nine or more years from 1996 to 2015, 94.4% were seen in at least one of nine different PCFG regions during six or more of the years they were seen (Calambokidis et al. 2017). While high site-fidelity seems to be common for some PCFG individuals in certain regions, interestingly, an analysis of sighting histories of all individuals that utilized the Makah U&A from 1985-2011 revealed that most PCFG whales do not have strong site fidelity to the Makah U&A (Scordino et al. 2017). Only about 20% of the whales were observed in six or more years of the total 26 years of data analyzed. Since high individual site fidelity does not appear to be strong in this area, perhaps a loss of genetic diversity, cultural knowledge, and behavioral individualism is not of great concern.

“Buttons” seems to have a preference for the southern Oregon coast as in the last 5 years the GEMM Lab has conducted research, he has only been sighted in 1 year in Newport but in all 5 years in Port Orford. However, perhaps such preferences are not common among all PCFG whales. Source: F. Sullivan.

4. How has the current UME affected the situation?

The ENP has experienced two Unusual Mortality Events (UMEs) in the past 20 years; one from 1999-2000 and the second began in May 2019. Many questions arise when thinking about the Makah hunt in light of the UME. 

  • What impacts will the current UME have on ENP and PCFG birth rates in subsequent years? 
  • Could the UME lead to shifts in feeding behavior of ENP whales and result in greater use of PCFG range by more individuals?
  • What caused the UME? Shifting prey availability and a changing climate? Or has the ENP reached carrying capacity? 
  • Will UMEs become more frequent in the future with continued warming of the Arctic? 
  • What is the added impact of such periodic UMEs on population trends?
“A gray whale found dead off Point Reyes National Seashore in northern California [during the 2019 UME]. Photo by M. Flannery, California Academy of Sciences.” Source and caption: NMFS.

A key assumption of the model developed by NMFS (Moore 2019) to forecast PCFG population size for the period 2016-2028, is that the population processes underlying the data from 2002-2015 (population size estimates developed by Calambokidis et al. 2017) will be the same during the forecasted period. In other words, it is assuming that PCFG gray whales will experience similar environmental conditions (with similar variation) during the next decade as the previous one, and that there will be no catastrophic events that could drastically affect population dynamics. The UME that is still ongoing could arguably affect population dynamics enough such that they are drastically different to effects on the population dynamics during the previous decade. The cause of  the 1999/2000 UME remains undetermined and the results of the investigation of the current UME will possibly not be available for several years (Yates 2019b). Even though the ENP did rebound following the 1999/2000 UME and the abundance of the PCFG increased during and subsequent to that UME, much has changed in the 20 years since then. Increased noise due to increased vessel traffic and other anthropogenic activities (seismic surveys, pile driving, construction to name a few) as well as increased coastal recreational and commercial fishing, have all contributed to a very different oceanscape than the ENP and PCFG encountered 20 years ago. Furthermore, the climate has changed considerably since then too, which likely has caused changes in the spatial distribution of habitat and quantity, quality, and predictability of prey. All of these factors make it difficult to predict what impact the UME will have now. If such events were to become more frequent in the future or the impacts of such events are greater than anticipated, then the PCFG population forecasts will not have accounted for this change. 

5. What impacts will the hunt and associated training exercises have on energy and stress levels of whales?

The proposed waiver would allow hunts to occur in the following manner: in even-years, the hunting period is from December 1 of an odd-numbered year through May 31 of the following even-numbered year. While in odd-years, the hunt is limited from July to October.

In the even-years, the hunt coincides with the northbound migration toward the foraging grounds for ENP whales and with the arrival of PCFG whales to their foraging grounds near the Makah U&A. During the northbound migration, gray whales are at their most nutritionally stressed state as they have been fasting for several months. They are therefore most vulnerable to energy losses due to disturbance at this point (Villegas-Amtmann 2019). Attempted strikes and training exercises would certainly cause some level of disturbance and stress to the whales. Furthermore, the timing of even-year hunts, means that hunters would likely encounter pregnant females, as they are the first to arrive at foraging grounds. A loss of just ~4% of a pregnant female’s energy budget could cause them to abort the fetus or not produce a calf that year (Villegas-Amtmann 2019).

In odd-years, the Makah hunt will most certainly target PCFG whales as the Makah U&A forms one of the nine PCFG regions where PCFG individuals will be feeding during those months. However, NMFS’ waiver limits the number of strikes during odd-years to 2 (Yates 2019a), which certainly protects the PCFG population.

Stress is a difficult response to quantify in baleen whales and research on stress through hormone analysis is still relatively novel. It is unlikely that a single boat training approach of a gray whale will have an adverse effect on the individual. However, a whale is never just experiencing one disturbance at a time. There are typically many confounding factors that influence a whale’s state. In an ideal world, we would know what all of these factors are and how to recognize these effects. Yet, this is virtually impossible. Therefore, while precautions will be taken to try to minimize harm and stress to the gray whales, there may very well still be unanticipated impacts that we cannot anticipate. 

Gray whale fluke. Image captured under NOAA/NMFS permit #21678. Photo: L Hildebrand.

Final thoughts

Many unknowns still remain about the ENP and PCFG gray whale populations. During the ALJ hearing, both sides tried to deal with these unknowns. After reading testimony from both sides, it is clear to me that some of the unknowns still have not been reconciled. Ultimately, a lot of the questions circle back to the first one I posed above: Are the PCFG an independent stock? If there is independent population structure, then the proposed waiver put forth by NMFS would likely change. While NMFS has certainly taken the PCFG into account during the declarations of several experts at the ALJ hearing and has aired on the side of caution, the fact that the PCFG is considered part of the ENP might underestimate the impact that a resumption of the Makah hunt may have on the PCFG. As you can see, there are still many questions that should be addressed to make fully informed decisions on such an important ruling. While this research may take several years to obtain results, the data are within reach through synthesis and collaboration that will fill these critical knowledge gaps. 

Literature cited

Calambokidis, J. C., J. Laake, and A. Pérez. 2017. Updated analysis of abundance and population structure of seasonal gray whales in the Pacific Northwest, 1996-2015. International Whaling Commission SC/A17/GW/05.

Frasier, T. R., S. M. Koroscil, B. N. White, and J. D. Darling. 2011. Assessment of population substructure in relation to summer feeding ground use in eastern North Pacific gray whale. Endangered Species Research 14:39-48.

Kirk, Ruth. 1986. Tradition and change on the Northwest Coast: the Makah, Nuu-chah-nulth, southern Kwakiutl and Nuxalk. University of Washington Press, Seattle.

Lang, A. R., D. W. Weller, R. LeDuc, A. M. Burdin, V. L. Pease, D. Litovka, V. Burkanov, and R. L. Brownell, Jr. 2011. Genetic analysis of stock structure and movements of gray whales in the eastern and western North Pacific. SC/63/BRG10.

Moore, J. E. 2019. Declaration in re: ‘Proposed Waiver and Regulations Governing the Taking of Eastern North Pacific Gray Whales by the Makah Indian Tribe’. Administrative Law Judge, Hon. George J. Jordan. Docket No. 19-NMFS-0001. RINs: 0648-BI58; 0648-XG584.

Schubert, D. J. 2019. Rebuttal testimony in re: ‘Proposed Waiver and Regulations Governing the Taking of Eastern North Pacific Gray Whales by the Makah Indian Tribe’. Administrative Law Judge, Hon. George J. Jordan. Docket No. 19-NMFS-0001. RINs: 0648-BI58; 0648-XG584.

Scordino, J. J., M. Gosho, P. J. Gearin, A. Akmajian, J. Calambokidis, and N. Wright. 2017. Individual gray whale use of coastal waters off northwest Washington during the feeding season 1984-2011: Implications for management. Journal of Cetacean Research and Management 16:57-69.

Villegas-Amtmann, S. 2019. Declaration in re: ‘Proposed Waiver and Regulations Governing the Taking of Eastern North Pacific Gray Whales by the Makah Indian Tribe’. Administrative Law Judge, Hon. George J. Jordan. Docket No. 19-NMFS-0001.

Weller, D. W., S. Bettridge, R. L. Brownell, Jr., J. L. Laake, J. E. Moore, P. E. Rosel, B. L. Taylor, and P. R. Wade. 2013. Report of the National Marine Fisheries Service Gray Whale Stock Identification Workshop. NOAA-TM-NMFS-SWFSC-507. 

Yates, C. 2019a. Declaration in re: ‘Proposed Waiver and Regulations Governing the Taking of Eastern North Pacific Gray Whales by the Makah Indian Tribe’. Administrative Law Judge, Hon. George J. Jordan. Docket No. 19-NMFS-0001. RINs: 0648-BI58; 0648-XG584.

Yates, C. 2019b. Fifth declaration in re: ‘Proposed Waiver and Regulations Governing the Taking of Eastern North Pacific Gray Whales by the Makah Indian Tribe’. Administrative Law Judge, Hon. George J. Jordan. Docket No. 19-NMFS-0001. RINs: 0648-BI58; 0648-XG584.

The complex relationship between behavior and body condition

Clara Bird, Masters Student, OSU Department of Fisheries and Wildlife, Geospatial Ecology of Marine Megafauna Lab

Imagine that you are a wild foraging animal: In order to forage enough food to survive and be healthy you need to be healthy enough to move around to find and eat your food. Do you see the paradox? You need to be in good condition to forage, and you need to forage to be in good condition. This complex relationship between body condition and behavior is a central aspect of my thesis.

One of the great benefits of having drone data is that we can simultaneously collect data on the body condition of the whale and on its behavior. The GEMM lab has been measuring and monitoring the body condition of gray whales for several years (check out Leila’s blog on photogrammetry for a refresher on her research). However, there is not much research linking the body condition of whales to their behavior. Hence, I have expanded my background research beyond the marine world to looked for papers that tried to understand this connection between the two factors in non-cetaceans. The literature shows that there are examples of both, so let’s go through some case studies.

Ransom et al. (2010) studied the effect of a specific type of contraception on the behavior of a population of feral horses using a mixed model. Aside from looking at the effect of the treatment (a type of contraception), they also considered the effect of body condition. There was no difference in body condition between the treatment and control groups, however, they found that body condition was a strong predictor of feeding, resting, maintenance, and social behaviors. Females with better body condition spent less time foraging than females with poorer body condition. While it was not the main question of the study, these results provide a great example of taking into account the relationship between body condition and behavior when researching any disturbance effect.

While Ransom et al. (2010) did not find that body condition affected response to treatment, Beale and Monaghan (2004) found that body condition affected the response of seabirds to human disturbance. They altered the body condition of birds at different sites by providing extra food for several days leading up to a standardized disturbance. Then the authors recorded a set of response variables to a disturbance event, such as flush distance (the distance from the disturbance when the birds leave their location). Interestingly, they found that birds with better body condition responded earlier to the disturbance (i.e., when the disturbance was farther away) than birds with poorer body condition (Figure 1). The authors suggest that this was because individuals with better body condition could afford to respond sooner to a disturbance, while individuals with poorer body condition could not afford to stop foraging and move away, and therefore did not show a behavioral response. I emphasize behavioral response because it would have been interesting to monitor the vital rates of the birds during the experiment; maybe the birds’ heart rates increased even though they did not move away. This finding is important when evaluating disturbance effects and management approaches because it demonstrates the importance of considering body condition when evaluating impacts: animals that are in the worst condition, and therefore the individuals that are most vulnerable, may appear to be undisturbed when in reality they tolerate the disturbance because they cannot afford the energy or time to move away.

Figure 1.  Figure showing flush distance of birds that were fed (good body condition) and unfed (poor body condition).

These two studies are examples of body condition affecting behavior. However, a study on the effect of habitat deterioration on lizards showed that behavior can also affect body condition. To study this effect, Amo et al. (2007) compared the behavior and body condition of lizards in ski slopes to those in natural areas. They found that habitat deterioration led to an increased perceived risk of predation, which led to an increase in movement speed when crossing these deteriorated, “risky”, areas. In turn, this elevated movement cost led to a decrease in body condition (Figure 2). Hence, the lizard’s behavior affected their body condition.


Figure 2. Figure showing the difference in body condition of lizards in natural and deteriorated habitats.

Together, these case studies provide an interesting overview of the potential answers to the question: does body condition affect behavior or does behavior affect body condition? The answer is that the relationship can go both ways. Ransom et al. (2004) showed that regardless of the treatment, behavior of female horses differed between body conditions, indicating that regardless of a disturbance, body condition affects behavior. Beale and Monaghan (2004) demonstrated that seabird reactions to disturbance differed between body conditions, indicating that disturbance studies should take body condition into account. And, Amo et al. (2007) showed that disturbance affects behavior, which consequently affects body condition.

Looking at the results from these three studies, I can envision finding similar results in my gray whale research. I hypothesize that gray whale behavior varies by body condition in everyday circumstances and when the whale is disturbed. Yet, I also hypothesize that being disturbed will affect gray whale behavior and subsequently their body condition. Therefore, what I anticipate based on these studies is a circular relationship between behavior and body condition of gray whales: if an increase in perceived risk affects behavior and then body condition, maybe those affected individuals with poor body condition will respond differently to the disturbance. It is yet to be determined if a sequence like this could ever be detected, but I think that it is important to investigate.

Reading through these studies, I am ready and eager to start digging into these hypotheses with our data. I am especially excited that I will be able to perform this investigation on an individual level because we have identified the whales in each drone video. I am confident that this work will lead to some interesting and important results connecting behavior and health, thus opening avenues for further investigations to improve conservation studies.

References

Beale, Colin M, and Pat Monaghan. 2004. “Behavioural Responses to Human Disturbance: A Matter of Choice?” Animal Behaviour 68 (5): 1065–69. https://doi.org/10.1016/j.anbehav.2004.07.002.

Ransom, Jason I, Brian S Cade, and N. Thompson Hobbs. 2010. “Influences of Immunocontraception on Time Budgets, Social Behavior, and Body Condition in Feral Horses.” Applied Animal Behaviour Science 124 (1–2): 51–60. https://doi.org/10.1016/j.applanim.2010.01.015.

Amo, Luisa, Pilar López, and José Martín. 2007. “Habitat Deterioration Affects Body Condition of Lizards: A Behavioral Approach with Iberolacerta Cyreni Lizards Inhabiting Ski Resorts.” Biological Conservation 135 (1): 77–85. https://doi.org/10.1016/j.biocon.2006.09.020.

What is that whale doing? Only residence in space and time will tell…

By Lisa Hildebrand, MSc student, OSU Department of Fisheries and Wildlife, Geospatial Ecology of Marine Megafauna Lab

For my research in Port Orford, my field team and I track individual gray whales continuously from a shore-based location: once we spot a whale we will track it for the entire time that it remains in our study site. The time spent tracking a whale can vary widely. In the 2018 field season, our shortest trackline was three minutes, and our longest track was over three hours in duration.

This variability in foraging time is partly what sparked my curiosity to investigate potential foraging differences between individuals of the Pacific Coast Feeding Group (PCFG) gray whales. I want to know why some individuals, like “Humpy” who was our longest tracked individual in 2018, stayed in an area for so long, while others, like “Smokey”, only stayed for three minutes (Figure 1). It is hard to pinpoint just one variable that drives these decisions (e.g., prey, habitat) made by individuals about where they forage and how long because the marine environment is so dynamic. Foraging decisions are likely dictated by several factors acting in concert with one another. As a result, I have many research questions, including (but certainly not limited to):

  1. Does prey density drive length of individual foraging bouts?
  2. Do individual whales have preferences for a particular prey species?
  3. Are prey patches containing gravid zooplankton targeted more by whales?
  4. Do whales prefer to feed closer to kelp patches?
  5. How does water depth factor into all of the above decisions and/or preferences? 

I hope to get to the bottom of these questions through the data analyses I will be undertaking for my second chapter of my Master’s thesis. However, before I can answer those questions, I need to do a little bit of tidying up of my whale tracklines. Now that the 2019 field season is over and I have all of the years of data that I will be analyzing for my thesis (2015-2019), I have spent the past 1-2 weeks diving into the trackline clean-up and analysis preparation.

The first step in this process is to run a speed filter over each trackline. The aim of the speed filter is to remove any erroneous points or outliers that must be wrong based on the known travel speeds of gray whales. Barb Lagerquist, a Marine Mammal Institute (MMI) colleague who has tracked gray whales for several field seasons, found that the fastest individual she ever encountered traveled at a speed of 17.3 km/h (personal communication). Therefore, based on this information,  my tracklines are run through a speed filter set to remove any points that suggest that the whale traveled at 17.3 km/h or faster (Figure 2). 

Fig 3. Trackline of “Humpy” after interpolation. The red points are interpolated.

Next, the speed-filtered tracklines are interpolated (Figure 3). Interpolation fills spatial and/or temporal gaps in a data set by evenly spacing points (by distance or time interval) between adjacent points. These gaps sometimes occur in my tracklines when the tracking teams misses one or several surfacings of a whale or because the whale is obscured by a large rock. 

After speed filtration and interpolation has occurred, the tracklines are ready to be analyzed using Residence in Space and Time (RST; Torres et al. 2017) to assign behavior state to each location. The questions I am hoping to answer for my thesis are based upon knowing the behavioral state of a whale at a given location and time. In order for me to draw conclusions over whether or not a whale prefers to forage by a reef with kelp rather than a reef without kelp, or whether it prefers Holmesimysis sculpta over Neomysis rayii, I need to know when a whale is actually foraging and when it is not. When we track whales from our cliff site, we assign a behavior to each marked location of an individual. It may sound simple to pick the behavior a whale is currently exhibiting, however it is much harder than it seems. Sometimes the behavioral state of a whale only becomes apparent after tracking it for several minutes. Yet, it’s difficult to change behaviors retroactively while tracking a whale and the qualitative assignment of behavior states is not an objective method. Here is where RST comes in.

Those of you who have been following the blog for a few years may recall a post written in early 2017 by Rachael Orben, a former post-doc in the GEMM Lab who currently leads the Seabird Oceanography Lab. The post discussed the paper “Classification of Animal Movement Behavior through Residence in Space Time” written by Leigh and Rachael with two other collaborators, which had just been published a few days prior. If you want to know the nitty gritty of what RST is and how it works, I suggest reading Rachael’s blog, the GEMM lab’s brief description of the project and/or the actual paper since it is an open-access publication. However, in a nut shell, RST allows a user to identify three primary behavioral states in a tracking dataset based on the time and distance the individual spent within a given radius. The three behavioral categories are as follows:

Fig 4. Visualization of the three RST behavioral categories. Taken from Torres et al. (2017).
  • Transit – characterized by short time and distance spent within an area (radius of given size), meaning the individual is traveling.
  • Time-intensive – characterized by a long time spent within an area, meaning the individual is spending relatively more time but not moving much distance (such as resting in one spot). 
  • Time & distance-intensive – characterized by relatively high time and distances spent within an area, meaning the individual is staying within and moving around a lot in an area, such as searching or foraging. 

What behavior these three categories represent depends on the resolution of the data analyzed. Is one point every day for two years? Then the data are unlikely to represent resting. Or is the data 1 point every second for 1 hour? In which case travel segments may cover short distances. On average, my gray whale tracklines are composed of a point every 4-5 minutes for 1-2 hours.  Bases on this scale of tracking data, I will interpret the categories as follows: Transit is still travel, time & distance-intensive points represent locations where the whale was searching because it was moving around one area for a while, and time-intensive points represent foraging behavior because the whale has ‘found what it is looking for’ and is spending lots of time there but not moving around much anymore. The great thing about RST is that it removes the bias that is introduced by my field team when assigning behavioral states to individual whales (Figure 5). RST looks at the tracklines in a very objective way and determines the behavioral categories quantitatively, which helps to remove the human subjectivity.

While it took quite a bit of troubleshooting in R and overcoming error messages to make the codes run on my data, I am proud to have results that are interesting and meaningful with which I can now start to answer some of my many research questions. My next steps are to create interpolated prey density and distance to kelp layers in ArcGIS. I will then be able to overlay my cleaned up tracklines to start teasing out potential patterns and relationships between individual whale foraging movements and their environment. 

Literature cited

Torres, L. G., R. A. Orben, I. Tolkova, and D. R. Thompson. 2017. Classification of animal movement behavior through residence in space and time. PLoS ONE: doi. org/10.1371/journal.pone.0168513.

A Series of Short Stories from A Field Season in Port Orford

By Mia Arvizu, Marine Studies Initiative (MSI) & GEMM Lab summer intern, OSU junior

Part 1: The Green Life Jacket

The swells are churning and for once my stomach is calm. I take advantage of it while I can, and head out on the kayak. Another beautiful day, another good data set. After about three hours in the kayak and a long paddle fighting winds and swells, we arrive at TC1. That’s short for Tichenor Cove Station 1. I’m fairly tired by now but my teammate and I are determined to finish all stations today. GPS says we arrived, and I paddle against any slight movement to keep us on station. It’s getting more difficult though, so I check in with Anthony, one of the high school interns this summer. “Anthony, have you sent the GoPro camera down yet?”  I take a quick look back peering over my green life jacket. Red flash, and I know it’s on. Anthony sends it down, and I watch as it plunges into depths I couldn’t see on my own. I’m confident it’s doing its job. 

Part 2: The GoPro Dive

The green life jacket is familiar, but there’s a different soul, a different face every year. It’s the same month though. August – the month of whales. 

Red flash, I’m on,  and it’s my time to shine. The scientists debrief me on my latest mission, and I’m alive. “Secchi depth .75 meters.” Hmm, low visibility. This may be a tough one. “Station TC1” One of my favorites but challenging no doubt. “Time is 10:36. 5, 6, 7, 8…” I’m ready. A flush of swirling water surrounds me as I plunge into the depths of a different realm. I’m cocooned in the beauty of an ocean so blue, so majestic, so entrancing. Oh, the mission! Right, I need to stay focused. They lurk all around but with sand clouding the water, I can barely see. I just need one good visual of the purple spikes and the swaying green leaves, and the mission will be complete. I glance just to the left and oh my!

Sea urchins actively foraging on kelp at station TC1 in Tichenor Cove. Source: GEMM Lab.

A giant purple spike comes too close. I barely caught a glimpse of it. I need a better shot, but I only have so much control especially with these undercurrents. I’m ready now though. I peer through the sediment and nothing, but one quick swivel to the right shows me what I feared and what the green life jackets predicted: The purple spikes have grown too many and reduced the swaying greens down to half chewed, severed, scared dead masses. I thought their hypothesis was right, but I didn’t expect this degree of damage. It’s so frightening I almost look away.

But I don’t. I have a mission. So, I look straight ahead documenting the scene. I haven’t seen it this bad in the past years. I wonder what the green life jackets will do about this. I feel a tug, and I’m reeled in. I guess I’ll find out.

GoPro video taken from tandem research kayak during 2019 gray whale field season in Tichenor Cove, Port Orford. Source: GEMM Lab.

Part 3: The Science, how I see it

After collecting data in the kayak, I go back to the field station ready to do data processing. I grab the GoPro and take a look at the video from TC1. I’m both amazed and terrified for the surrounding habitat from what I see. Sea urchins seem to have been actively foraging on kelp stalks. 

Last summer, around this time, a previous intern pointed out that he was witnessing damaged kelp and a notable number of urchins in the GoPro videos. Thus, the GEMM Lab is looking into the relationship between kelp health and sea urchin abundance in Port Orford, which can have significant trophic cascades for the rest of the ecosystem, including whales and their zooplankton prey. The hypothesis is that if sea urchin populations increase in number they may actively forage on kelp, reducing the health of that habitat. Many creatures depend on this habitat including zooplankton which whales feed on. I have looked at videos from past years and the temporal difference in the abundance of urchins is stark. A detailed methodology for the project and our pending results will be featured in a later post, but for now this story is unfolding before our eyes and the GoPro’s lens as well. 

Part 4: The Transformation from STEM to STEAM

I hope you enjoyed these short stories. As the writer, it was nice to express the ecological phenomena I’ve learned about in the last few weeks between sea urchins and kelp in this creative and artistic outlet. Especially since I feel science can be rigid at times. It can be easy to lose myself in numbers and large datasets. However, by tying together the arts and STEM (Science, Technology, Engineering, Mathematics), there is more space for well-rounded inquiry and expressive results. STEAM, which is STEM with the Arts included, is not a new movement. Examples of STEAM are preserved in the past and is ongoing in present examples. A great example of how the sciences and arts are merged together is in the songs of Aboriginal Australians. These songs can take hours to recite fully and are full of environmental knowledge such as species types, behavior of animals, and edible plants. The combination of art and STEM is also displayed in the modern age and is shown in Leah Heiss’s work to create jewelry that helps measure cardiac data and also helps diabetics administer their insulin.  

This is one of Leah’s feature blends of biotechnology and jewelry. It measures cardiac data and is primarily beneficial for patients at risk of heart attacks. Source: Leah Heiss.

There are many ways in which the two subjects can merge together, making each other stronger and better. As a well-rounded student pursuing Environmental Science and interested dance and writing, I am comforted to know that STEAM can allow me to blend my interests. 

Intricacies of Zooplankton Species Identification

By Donovan Burns, Astoria High School Junior, GEMM Lab summer intern

The term zooplankton is used to describe a large number of creatures; the exact definition is any animal that cannot move against a sustained current in the marine environment. There are two main types of plankton: holoplankton and meroplankton. Meroplankton are organisms that are plankton for only part of their life cycle. So this makes most sea creatures plankton, for instance, salmon, sunfish, tuna, and most other fish are meroplankton because they start out their lives as plankton. Holoplankton are plankton that remain plankton for their whole lives, these include mysid shrimp, most marine worms, and most jellyfish.

I have spent a good deal of time this summer looking through a microscope at the zooplankton we have captured during sampling from our research kayak, trying to distinguish and identify different species. Telsons, the tail of the tail, are what we use to identify different types of mysid shrimp, which are a primary gray whale prey item along the Oregon coast and the most predominant type of zooplankton we capture in our sampling. For instance Neomysis is a genus of mysid shrimp and is one of the two most abundant zooplankton species we get. Their telsons end with two spikes that are somewhat longer than the spikes on the side of the telson.  This look is distinct from Holmesimysis sculpta, the other of the two most abundant zooplankton species we get, which have four-pronged telsons with varying sizes of spikes along the sides of the telson. Alienacanthomysis macropsis is identified by both their long eye stalks and their rather bland rounded telson.

Caprellidae. Source: R. Norman.

However, creatures that are not mysid shrimp cannot be identified this way.  Like gammarids, they look like fleas.  We have only found one kind of gammarid here in Port Orford this year, Atylus tridens. There are other types but that is the only type we have found this year. After that, we have Caprellidae, also known as skeleton shrimp. They are long and stalky, and have claws in every spot where they could have claws.

Copepod. Source: L. Hildebrand.

Then there are copepods. Copepods are tiny and have long antennae that string down to the sides of their bodies. We also have been seeing lots of crab larvae. I have also seen a couple of polychaete worms, which are marine worms with many legs and segments. The only reason I was able to identify them as polychaetes is due to my marine biology class at Astoria High School where we identified these worms using microscopes before.

We also have had some trouble identifying somethings. For instance, we have found a few individuals of a type of mysid shrimp with a rake-like tail that we are still trying to identify.  Also, we have captured some jellyfish that we are not trying to identify. When the kayak team gets back in from gathering samples, we freeze the samples to kill and preserve the critters in them. This process turns the jellyfish to mush, so they are hard to identify.

To identify these zooplankton and other critters, we put them into a Petri dish and under a dissection scope, at which point we use forceps to move and pivot creatures.  If a jellyfish had just eaten another plankton, we have to cut it open to get the plankton out so we can identify it.  

Sometimes we have large samples of thousands of the same creature, in this case, we would normally sub-sample it. Sub-sampling is when we take a portion of a sample and identify and count individual zooplankton in that sub-sample. Then we multiply those counts by the portion of the whole sample to get the approximate total number that are in that sample.  For instance, say we had a rather large sample, we would take a tenth of that sample and count what is in it. Say we count 500 individuals in that tenth. We would then multiply 500 by ten to get the total number in that whole sample.

Then there are some plankton that we do not catch, like large jellyfish.  The kayak team has gotten photos of a giant jellyfish that was nearly a meter long.

Jellyfish seen by the kayak team. Source: L. Hildebrand.

All in all, Port Orford has an amazing and diverse population of marine life. From gray whales to thresher sharks to mysid shrimp to copepods to jellyfish, this little ecosystem has pretty much some of everything. 

Fieldwork experience as a GEMM Lab intern

By Anthony Howe, Astoria High School graduate 2019, GEMM Lab summer intern

Murphy’s Law says that “things will go wrong in any given situation if you give them a chance”. This statement certainly applies to research where you never really know what is going to happen when performing fieldwork. You can only try to be prepared for all of the situations. When I arrived at the Oregon State University (OSU) Field Station in Port Orford, I had no idea that it would harbor some of the best educational experiences I have ever had. I had no idea what a theodolite was, nor did I know how to kayak in the ocean, but I learned fast. When we first started being trained on using a theodolite and the program that processes the data, Pythagoras, we had some problems. The theodolite would not stay level, but just as we were learning how to work the theodolite, we also learned how to work as a team. When we finally managed to level the theodolite, which did take a few days, I began to realize the hard work of doing fieldwork. You can be prepared but there will always be something that goes wrong, and that’s okay. I have learned that mistakes happen and cannot be dwelled on. Only learned from. No one is perfect.

Fig 1. Me holding two zooplankton samples after collecting them on the kayak. Source: L. Hildebrand.

Just two days ago I was on our tandem research kayak with Mia Arvizu, the OSU Marine Studies Initiative (MSI) undergraduate intern. When we go out on the kayak, we paddle around our study area and go to GPS-marked “stations” to collect prey samples of zooplankton, test for water visibility using a Secchi disk, and send a GoPro underwater to have a better understanding of what is going on under the surface. While sampling at Station 15 in Mill Rocks I lowered the GoPro into the water using a downrigger. When the GoPro reached the bottom, I began to pull it up, only to realize it had gotten snagged in a crevice. I gave the line to which the GoPro is attached some slack and began to give Mia instructions to move to different spots to try and retrieve the GoPro out of this tight crevice. Unfortunately, I did not realize all of the lines had wrapped themselves underneath the downrigger and as soon as a swell came up, the line broke. My eyes widened as I realized what had just happened. Thankfully, I managed to grasp the last of the remaining line left connected to the GoPro and pulled it back into the kayak using my hand wrapped in a towel since the line is thin and can cut into your hands easily. Only then did I realize that neither Mia nor I had packed a knife in the event we needed to cut a line. We sat and pondered ideas of how to cut the last of the line so that I could reattach the GoPro to the downrigger. Mia came up with the idea to use a barnacle or a mussel, and it worked perfectly. We were proud of ourselves for being resourceful and using nature to our advantage. But as soon as I finished using the mussel to cut the line, Lisa’s voice came over the VHF radio that we always carry with us in the kayak that there were scissors in the First Aid Kit that is stowed in the dry hatch of the kayak. Mia and I looked at each other and could only laugh. The kayak team can be rough at times but it’s made up by the fact that we get beautiful prey samples and stunning GoPro videos of what is below the water.

Fig 2. Mia and myself paddling the kayak across “The Passage”, the approximately 1 km stretch between Mill Rocks and Tichenor Cove, our two study sites. Red Fish Rocks, which is Oregon’s first Marine Reserve, can be seen in the background. Source: L. Hildebrand.

After all of the kayak sampling is done we organize and store our gear, and then go to the lab. In the lab, one person will clean all tools and devices touched by saltwater while the other sieves all of our zooplankton samples. Each sample is individually sieved and then placed in a sample jar with its station name on it and placed into the freezer. We put them in the freezer to increase the longevity of the samples, as well as euthanizing all zooplankton so that they are easier to identify under a dissection scope. After all of that is done we take a 45-minute break before taking over the cliff team job so they can have a lunch break, as well as a rest from staring at the glare of the water all day searching for whales. 

The cliff team generally consists of two people. One person will be on the theodolite, and the other will be on the laptop. The idea is that the theodolite uses the Pythagorean Theorem to get the exact coordinates of the whale we are spotting. This allows us to track exactly where the whales are going, what they are doing, how they’re doing it, and the fashion in which they’re doing it. The fixed points will fall on a plotted map on the laptop. The other job of the person on the laptop is to take pictures when possible so we can identify the whales. For instance, there is a whale named Buttons that has been recorded during past summers in Port Orford. By using the photos we take of a whale, combined with previous data about the whale named Buttons, we can cross-reference the body color and patterns of the whale to be able to re-identify Buttons. We now know that we have seen Buttons for 4 consecutive days feeding in our study area. The camera also acts as a tool to take pictures of whales not just for identity but for rare activity. Today while on the cliff Mia and I spotted a whale in Tichenor Cove (one of our sampling sites) that breached four times! These experiences are rare and beautiful. You never think about how big a whale truly is until you see it almost completely leap out of the water – it is beautiful. 

Fig 3. The post-breach splash created by Buttons. Unfortunately we weren’t able to get a good photo from the cliff because we were too stunned by the fact that we were seeing this rare behavior. Source: GEMM Lab.

I’m sure more mistakes will be made but that’s okay. I have many more experiences to witness, and many more memories to make from this internship, as well as challenges. I couldn’t be more than happy with the team I have to share all of these learning experiences and hardships with. 

Introducing Crew Cinco – the Port Orford Gray Whale Foraging Ecology Field Team of 2019

By Lisa Hildebrand, MSc student, OSU Department of Fisheries and Wildlife, Geospatial Ecology of Marine Megafauna Lab

It seems unfathomable to me that one year and two months ago I had never used a theodolite before, never been in an ocean kayak before, never identified zooplankton before, never seen a Time-Depth-Recorder (TDR) before. Now, one year later, it seems like all of those tools, techniques and things are just a couple of old friends with which I am being reunited with again. My second field season as the project team lead of the gray whale foraging ecology project in Port Orford (PO) is slowly getting underway and so many of the lessons I learned from my first field season last year have already helped me tremendously this year. I know how to interpret weather forecasts and determine whether it will be a kayak-appropriate day. I know how to figure out the quirks of Pythagoras, the program we use to interface with our theodolite which helps us track whales from our cliff site. I know how to keep track of a budget and feed a team of hungry researchers after a long day of work. Knowing all of these things ahead of this year’s field season have made me feel a little more prepared and at ease with the training of my team and the work to be done. Nevertheless, there are always new curveballs to be thrown my way and while they can often be frustrating, I enjoy the challenges that being a team leader has to offer as it allows me to continue to grow as a field research scientist. 

Figure 1. Crew Cinco tracks a whale in Tichenor Cove. Source: L Hildebrand.

2019 marks the fifth year that this project has been taking place in PO. Back in the summer of 2015, former GEMM Lab Master’s student Florence Sullivan started this project together with Leigh. That year the research focused more on investigating vessel disturbance to gray whales by comparing sites of heavy (Boiler Bay) to low boat traffic (Port Orford). The effort found that there were significant differences in gray whale activity budgets between the heavy and low boat traffic conditions (Sullivan & Torres 2018). The following year, the focus of the research switched to being more on the foraging ecology side of things and the project was based solely out of Port Orford, as it continues to be to this day. Being in our fifth year means that we are starting to build a humbly-sized database of sightings across multiple years allowing me to investigate potential individual specialization of the whales that we document. Similarly, multiple years of prey sampling is starting to reveal temporal and spatial trends of prey community assemblages.

Figure 2. Buttons (pictured above) is one of the stars of the Port Orford gray whale foraging ecology project as he has been seen every year since 2016. Crew Cinco has already seen him three times since the start of August. Source: L Hildebrand.

It has become a tradition to come up with a name for the field team that spends 6 weeks at the Oregon State University (OSU) Port Orford Field Station to collect the data for the project. It started with Team Ro“buff”stus in 2015, which I believe carried through until 2017. This is understandable since it’s such a clever name. It’s a play on the species name for gray whales, robustus, but the word “Buff” has been substituted in the center. Buffs are pieces of cloth sewn into a cylindrical shape, often with fun patterns or colors, that can be used as face masks, headbands, and scarves, which come in very handy when your face is exposed to the elements. Doing this project, we can be confronted by wind, sun, fog and sea water all in one day, so Buffs have definitely served the team members very well over the years. Last year, as the project’s torch was passed from Florence to myself, I felt a new team name was apt, and so last year’s team decided our name would be Team Whale Storm. I believe it was because we said we would take the whale world by storm with our insanely good theodolite tracking and kayak sampling skills. With a new year and new team upon us, a new team name was in order. As the title of this blog post indicates, this year the team is called Crew Cinco. The reason behind this name is that we are the fifth team to carry out this field work. Since the gray whales breed in the lagoons of Baja California, Mexico, I like to think that their native language is Spanish. Hence, we have decided that instead of being Crew Five, we are Crew Cinco, as cinco is the Spanish word for five (besides, alliteration makes for a much better team name).

Now that you are up to speed on the history of the PO gray whale project, let me tell you a little about who is part of Crew Cinco and what we have been up to already.

This year’s Marine Studies Initiative OSU undergraduate intern is Mia Arvizu. Mia has just finished her sophomore year at OSU and majors in Environmental Science. Besides being my co-captain this year in the field, Mia is also undertaking an independent research project which focuses on the relationship between sea urchin abundance, kelp health and gray whale foraging. She will tell you all about this project in a few weeks when she takes over the GEMM lab blog. Aside from her interest in ecology and the way science can be used to help local communities in a changing environment, Mia is a dancer, having performed in several dances in OSU’s annual luau this year, and she is currently teaching herself Spanish and Hawaiian.

Both of our high school interns this year are from Astoria. Anthony Howe has just graduated from Astoria High School and will be starting at Clatsop Community College in the fall. His plan is to transfer to OSU and to pursue his interest in marine biology. Anthony, like myself, was born in Germany and lived there until he was six, which means that he is able to speak fluent German. He also introduced the team to the wonders of the Instant Pot, which has made cooking for a team of four hungry scientists much simpler.

Donovan Burns is our other high school intern. He will be going into his junior year in the fall. Donovan never ceases to amaze us with the seemingly endless amounts of general knowledge he has, often sharing facts about Astoria’s history to Asimov’s Laws of Robotics to pickling vegetables, specifically carrots, with us during dinner or while scanning for whales on the cliff site. He also named the first whale we saw here this season – Speckles. 

Figure 3. Crew Cinco, from left to right: Anthony Howe, Donovan Burns, Lisa Hildebrand and Mia Arvizu. Source: L Torres.

Crew Cinco has already been in PO for two weeks now. After having a full team meeting with Leigh in Newport and a GEMM lab summer pizza party, we headed south to begin our 6-week field season. It’s hard to believe that the two training weeks are already over. The team worked hard to figure out the subtleties of the theodolite, observe different gray whales and start to understand their dive and foraging patterns, undertake a kayak paddle & safety course, as well as CPR and First Aid training, learn about data processing and management, and how to use a variety of gizmos to aid us in data collection. But it hasn’t all been work. We enjoyed a day in the Californian Redwoods on one of our day’s off and picked blueberries at the Twin Creek Ranch, stocking our freezer with several bags of juicy berries. We have played ‘Sorry!’ perhaps one too many times already (we are in desperate need of some more boardgames if anyone wants to send some our way to the field station!), and enjoyed many walks and runs on beautiful Battle Rock Beach. 

The next four weeks will not be easy – very early mornings, lots of paddling and squinting into the sun, followed by several hours in the lab processing samples and backing up data. But the next four weeks will also be extremely rewarding – learning lots of new skills that will be valuable beyond this 6-week period, revealing ecological trends and relationships, and ultimately (the true reason for why Mia, Anthony, Donovan and myself are more than happy to put in 6 weeks-worth of hard work), the chance to see whales every day up close and personal. Follow Crew Cinco’s journey over the next few weeks as my interns will be posting to the blog for the next three weeks!

References

Sullivan, F.A., & Torres L.G. Assessment of vessel disturbance to gray whales to inform sustainable ecotourism. Journal of Wildlife Management, 2018. 82: 896-905. 

Our GEM(M), Ruby, is back in action!

By Lisa Hildebrand, MSc student, OSU Department of Fisheries and Wildlife, Geospatial Ecology of Marine Megafauna Lab

Every season, or significant period of time, usually has a distinct event that marks its beginning. For example, even though winter officially begins when the winter solstice occurs sometime between December 20 and December 23, many people often associate the first snowfall as the real start of winter. To mark the beginning of schooling, when children start 1stgrade in Germany (which is where I’m from), they receive something called a “Zuckertüte”, which translated means “sugar bag”. It is a large (sometimes as large as the child) cone-shaped container made of cardboard filled with toys, chocolates, sweets, school supplies and various other treats topped with a large bow.

Receiving my Zuckertüte in August of 2001 before starting 1st grade. Source: Ines Hildebrand.

I still remember (and even have) mine – it was almost as tall as I was, had a large Barbie printed on it (and a real one sitting on top of it) and was bright pink. And of course, while at a movie theatre, once the lights dim completely and the curtain surrounding the screen opens just a little further, members of the audience stop chit-chatting or sending text messages, everyone quietens down and puts their devices away – the film is about to start. There are hundreds upon thousands of examples like these – moments, events, days that mark the start of something.

In the past, the beginning of summer has always been tied to two things for me: the end of school and the chance to be outside in the sun for many hours and days. This reality has changed slightly since moving to Oregon. While I don’t technically have any classes during the summer, the work definitely won’t stop. There are still dozens of papers to read, samples to run in the lab, and data points to plot. For anyone from Oregon or the Pacific Northwest (PNW), it’s pretty well known that the weather can be a little unpredictable and variable, meaning that summer might not always be filled with sunny days. Despite somewhat losing these two “summer markers”, I have found a new event to mark the beginning of summer – the arrival of the gray whales.

Their propensity for coastal waters and near-shore feeding is part of what makes gray whales so unique and arguably “easier” to study than some other baleen whale species. Image captured under NOAA/NMFS permit #21678. Source: Leigh Torres.


It’s official – the gray whale field season is upon us! As many of you may already know, the GEMM Lab has two active gray whale research projects: investigating the impacts of ocean noise on gray whale physiology and exploring potential individual foraging specialization among the Pacific Coast Feeding Group (PCFG) gray whales. Both projects involve field work, with the former operating out of Newport and the latter taking place in Port Orford, both collecting photographs and a variety of samples and tracklines to study the PCFG, which is a sub-group of the larger Eastern North Pacific (ENP) population. June 1st is the widely accepted “cut-off date” for the PCFG whales, whereby gray whales seen after June 1st along the PNW coastline (specifically northern California, Oregon, Washington and British Columbia) are considered members of the PCFG. While this date is not the only qualifying factor for an individual to be considered a PCFG member, it is a good general rule of thumb. Since last week happened to be the first week of June, PI Leigh Torres, field technician Todd Chandler and myself launched out onto the Pacific Ocean in our trusty RHIB Ruby twice looking for gray whales, and it sure was a successful start to the season!

Even though I have done small boat-based field work before, every project and field team operates a little differently, which is why I was a little nervous at first. There are a lot of components to the Newport-based project as Leigh & co. assess gray whale physiology by collecting fecal samples, drone imagery and taking photographs, observing behavior patterns, as well as assessing local prey through GoPro footage and light traps. I wasn’t worried about the prey components of the research, since there is plenty of prey sampling involved in my Port Orford research, however I was worried about the whale side of things. I wasn’t sure whether I would be able to catch the drone as it returned back home to Ruby, fearing I might fumble and let it slip through my fingers. I also experienced slight déjà vu when handling the net we use to collect the fecal samples as I was forced to think back to some previous field work that involved collecting a biopsy dart with a net as well. During that project, I had somehow managed to get the end of the net stuck in the back of the boat and as I tried to scoop up the biopsy dart with the net-end, the pole became more and more stuck while the water kept dragging the net-end down and eventually the pole ended up snapping in my hands. On top of all this anxiety and work, trying to find your footing in a small RHIB like Ruby packed with lots of gear and a good amount of swell doesn’t make any of those tasks any easier.

However, as it turned out, none of my fears came to fruition. As soon as Todd fired up Ruby’s engine and we whizzed out and under the Newport bridge, I felt exhilarated. I love field work and was so excited to be out on the water again. During the two days I was able to observe multiple individuals of a species of whale that I find unique and fascinating.

Markings and pigmentation on the flukes are also unique to individuals and allow us to perform photo identification to track individuals over months and years. Image captured under NOAA/NMFS permit #21678. Source: Leigh Torres.

I felt back in my natural element and working with Leigh and Todd was rewarding and fun, as I have so much to learn from their years of experience and natural talent in the field dealing with stressful situations and juggling multiple components and gear. Even though I wasn’t out there collecting data for my own project, some of my observations did get me thinking about what I hope to focus on in my thesis – individualization. It is always interesting to see how differently whales will behave, whether due to the substrate we find them over, the water depths we find them in, or what their surfacing patterns are like. Although I still have six weeks to go until my field season starts and feel lucky to have the opportunity to help Leigh and Todd with the Newport field work, I am already looking forward to getting down to Port Orford in mid-July and starting the fifth consecutive gray whale field season down there.

But back to Newport – over the course of two days, we were able to deploy and retrieve one light trap to collect zooplankton, collect two fecal samples, perform two GoPro drops, fly the drone three times, and take hundreds of photos of whales. Leigh and Todd were both glad to be reunited with an old friend while I felt lucky to be able to meet such a famous lady – Scarback. A whale with a long sighting history not just for the GEMM Lab but for various researchers along the coast that study this population. Scarback is well-known (and easily identified) by the large concave injury on her back that is covered in whale lice, or cyamids. While there are stories about how Scarback’s wound came to be, it is not known for sure how she was injured. However, what researchers do know is that the wound has not stopped this female from reproducing and successfully raising several calves over her lifetime. After hearing her story from Leigh, I wasn’t surprised that both she and Todd were so thrilled to get both a fecal sample and a drone flight from her early in the season. The two days weren’t all rosy; most of day 1 was shrouded in a cloud of mist resulting in a thin but continuous layer of moisture forming on our clothes, while on day 2 we battled with some pretty big swells (up to 6 feet tall) and in typical Oregon coast style we were victims of a sudden downpour for about 10 minutes. We had some excellent sightings and some not-so-excellent sightings. Sightings where we had four whales surrounding our boat at the same time and sightings where we couldn’t re-locate a whale that had popped up right next to us. It happens.


A local celebrity – Scarback. Image captured under NOAA/NMFS permit #21678. Source: Lisa Hildebrand.


An ecstatic Lisa with wild hair standing in the bow pulpit of Ruby camera at the ready. Source: Leigh Torres.

Field work is certainly one of my favorite things in the world. The smell of the salt, the rustling of cereal bar wrappers, the whipping of hair, the perpetual rosy noses and cheeks no matter how many times you apply and re-apply sunscreen, the awkward hilarity of clambering onto the back of the boat where the engine is housed to take a potty break, the whooshing sound of a blow, the sometimes gentle and sometimes aggressive rocking of the boat, the realization that you haven’t had water in four hours only to chug half of your water in a few seconds, the waft of peanut butter and jelly sandwiches, the circular footprint where a whale has just gracefully dipped beneath the surface slipping away from view. I don’t think I will ever tire of any of those things.


Signs you’re an ecologist – you don’t spend nearly enough time geeking out about your study species…

By Lisa Hildebrand, MSc student, OSU Department of Fisheries and Wildlife, Geospatial Ecology of Marine Megafauna Lab

This past week has been very busy for me as I gave three quite important, yet very different, presentations. The first was on Tuesday at the Pacific High School in Port Orford, near my study site. The aim of the game was recruitment – my quest for two eager local high schoolers to be my interns for this 2019 summer field season has begun (read blogs written by our 2017 HS interns Nathan Malamud and Quince Nye)! I was lucky enough to be given an entire class period to talk to the students and so I hope that the picture I painted of kayaks, gray whales and sun will be enough to entice students to apply to the internship.

The second was a short presentation in one of the classes I took this term, GEOG 561: GIScience II Analysis and Applications. The class focuses on developing and conducting geospatial analyses in R and throughout the term each student develops a small independent research project using some of their own data. For my research project, I decided to do a small cluster analysis of the zooplankton community data that we have collected from the kayak net samples.

The third and final presentation of the week happened on Thursday and marked one of the big milestones on my Master’s journey: my research review. The research review is a mandatory (and extremely helpful) process in the Department of Fisheries & Wildlife where the student (in this case me), the committee (Dr Leigh Torres, Dr Rachael Orben, Dr Kim Bernard and Dr Susanne Brander) and a department representative (Dr Brian Sidlauskas) all assemble to discuss the student’s research proposal, which lays out the intended work, chapters, analysis and timeline for the students’ thesis. My proposal (which currently bears the title: “Tonight’s specials include mysids, gammarids and more: An examination of the zooplankton prey of Oregon gray whales and its impact on individual foraging patterns”) proposes a two-chapter thesis where the first examines the quality of zooplankton prey, while the second looks at potential individual foraging specialization of gray whales along the Oregon coast. While my entire committee agreed that what I have set forth to do in the next two or so years is ambitious, they provided me with excellent feedback and confidence that I would be able to achieve what I have planned.

Now that it’s the weekend and I’ve had some time to sit back and think about the week, I realized one major commonality between all three presentations I gave. None of the Powerpoints featured more than one image of a gray whale. How could this be?! It is after all my study species and I spend so much of my summer looking at them – how could it be that so little of what I showed and talked about was the thing that I am most passionate about and is so central to my research?

In the course of doing research, it’s easy to get wound up in the nitty gritty and forget about the big picture. While the nitty gritty is also imperative to conducting the research (and ultimately getting results), I sometimes forget about why I do what I do, which is that gray whales are AWESOME. Looking into the past, it seems that some of my lab mates have had the same realizations about their study species before too: see here and here. So for this blog, I want to bring it back to basics and share some of the things that I think are most fascinating about gray whales.

  1. Gray whales are the only baleen whale that feeds benthically. This behavior is facilitated by the shorter and tougher baleen that gray whales possess in comparison to other baleen whale species (Pivorunas 1979). The majority of the Eastern North Pacific (ENP) gray whale population feeds benthically in the Bering Sea where they eat ampeliscid amphipods, which are a type of benthic invertebrates (Nerini 1984). It is estimated that gray whales must regain 11-29% of critical body mass during the feeding season (Villegas-Amtmann et al. 2015) in order to obtain the energy stores they require for the entire year. Besides the personal benefit of sea floor foraging, by using this feeding tactic gray whales create depressions in the soft sediment that benefit other species besides themselves. The highly disruptive nature of this action can increase the biodiversity of the seafloor and initiate scavenging events by lysiannassid amphipods on other infauna (Oliver & Slattery 1985). Furthermore, Grebmeier & Harrison (1992) documented that a variety of seabirds including northern fulmars, black-legged kittiwakes and thick-billed murres feed on benthic amphipods brought to the surface by this unique foraging behavior performed by gray whales.
  1. Gray whales are essentially acrobats. A preference for benthic prey goes hand in hand with a preference for shallow, coastal waters, as for example Pacific Coast Feeding Group gray whales tend to forage within the 5-15 m depth range (Weller et al. 1999). With female adults ranging between 13-15 m in length (females tend to be slightly larger than adult males) and weighing anywhere between 15-33 tons (Jones et al. 1984), I am continuously fascinated by how gracefully and slowly gray whales can navigate extremely shallow waters.

    However, it is more than just simple navigation – the behaviors and moves that some gray whales display while in the shallows is phenomenal too. Last year Torres et al. (2018) documented this agility through unmanned aerial systems (UAS) footage that provided evidence for some novel foraging tactics including headstands, side-swimming, and jaw snapping and flexing.

  1. They sure are resilient. Commercial whaling of gray whales began in 1846 after two commercial whaling vessels first discovered the winter breeding grounds in Baja California, Mexico (Henderson 1984). Following this discovery, the ENP were targeted for roughly a century before receiving full protection under the International Convention for the Regulation of Whaling in 1946 (Reeves 1984). Through genetic analyses, it has been estimated that the pre-whaling abundance of the ENP population was between 76,000 – 118,000 individuals (Alter et al. 2012), which is roughly three to five times larger than current estimates (24,000 – 26,000; Scordino et al. 2018). While the gray whale populations that once existed in the Atlantic Ocean were not as fortunate as those in the Pacific (Atlantic gray whales were declared extinct in the 18thcentury due to extensive whaling; Bryant 1995), the ENP has definitely made a strong comeback. Additionally, gray whale resilience is not only evident on this long temporal scale but it can also be seen annually when gray whale mothers fight relentlessly to keep their calves alive when under attack from killer whales. A study on predation of gray whales by transient killer whales in Alaska reported that attacks were quickly abandoned if calves were aggressively defended by their mothers or if gray whales succeeded in reaching depths of 3 m or less (Barrett-Lennard et al. 2011).
  1. For some unimaginable reason, gray whales appear to feel a strong connection to us. For many, gray whales might be best known for actively seeking out human contact during their breeding season in the Mexican lagoons. I find this actuality particularly interesting because of the bloody history we share with Pacific gray whales.

Those are just some of the things about gray whales that make them so fascinating to me. I look forward to potentially discovering one or two more things that we don’t know about them yet through my research. Even if that doesn’t turn out to be the case, I feel so lucky that I at least get to spend so much time with them during their feeding season here along the Oregon coast.


References

Alter, E.S., et al., Pre-whaling genetic diversity and population ecology in Eastern Pacific gray whales: Insights from ancient DNA and stable isotopes.PLoS ONE, 2012. doi.org/10.1371/journal.pone.0035039.

Barrett-Lennard, L.G., et al., Predation on gray whales and prolonged feeding on submerged carcasses by transient killer whales at Unimak Island, Alaska. Marine Ecology Progress Series, 2011. 421: 229-241.

Bryant, P.J., Dating remains of gray whales from the Eastern North Atlantic. Journal of Mammalogy, 1995. 76(3): 857-861.

Grebmeier, J.M., & Harrison, N.M., Seabird feeding on benthic amphipods facilitated by gray whale feeding activity in the northern Bering Sea. Marine Ecology Progress Series, 1992. 80: 125-133.

Henderson, D.A., Nineteenth century gray whaling: Grounds, catches and kills, practices and depletion of the whale population.Pages 159-186 inJones, M.L. et al., eds. The gray whale: Eschrichtius robustus, 1984. Academic Press, Orlando.

Jones, M.L., et al., The gray whale: Eschrichtius robustus. 1984. Academic Press, Orlando.

Nerini, M., A review of the gray whale feeding ecology. Pages 423-448 inJones, M.L. et al., eds. The gray whale: Eschrichtius robustus, 1984. Academic Press, Orlando.

Oliver, J.S., & Slattery, P.N., Destruction and obstruction on the sea floor: effects of gray whale feeding.Ecology, 1985. 66: 1965-1975.

Pivorunas, A., The feeding mechanisms of baleen whales.American Scientist, 1979. 67(4): 432-440.

Reeves, R.R., Modern commercial pelagic whaling for gray whales. Pages 187-200 inJones, M.L. et al., eds. The gray whale: Eschrichtius robustus, 1984. Academic Press, Orlando.

Scordino, J., et al., Report of gray whale implementation review coordination call on 5 December 2018.

Torres, L.G., et al., Drone up! Quantifying whale behavior from a new perspective improves observational capacity.Frontiers in Marine Science, 2018. 5: doi:10.3389/fmars.2018.00319.

Villegas-Amtmann, S., et al., A bioenergetics model to evaluate demographic consequences of disturbance in marine mammals applied to gray whales. Ecosphere, 2015. 6(10): 1-19.

Weller, D.W., et al., Gray whale (Eschrichtius robustus) off Sakhalin Island, Russia: Seasonal and annual patterns of occurrence. Marine Mammal Science, 1999. 15(4): 1208-1227.

Plastics truly are ubiquitous in the marine environment

By Lisa Hildebrand, MSc student, OSU Department of Fisheries and Wildlife, Geospatial Ecology of Marine Megafauna Lab

As I enter my second term at OSU as a Master’s student, the ideas and structure of my thesis are slowly coming together. As of right now, my plan is to have two data chapters: The first chapter will assess the quality of zooplankton prey gray whales have access to along the Oregon coast, by looking at energetic value and microplastic content. I will contemplate about how my results potentially affect gray whale health. The second chapter will investigate fine-scale foraging and space use of gray whales in the Port Orford area to determine whether individual specialisation exists.

Fig 1. What it feels like when you start a literature review. Source: Harvard Blogs.

When I first started digging into the scientific literature to prepare for writing my thesis proposal (which is still underway but I’m getting close to the end of a first draft…), one sentence that I seemed to stumble across more often than not was “Marine plastics are ubiquitous” or “Plastics have become ubiquitous in the marine environment” or some other, very similar, iteration of that statement (e.g. Machovsky-Capuska et al. 2019; Eriksen et al. 2014; Fendall & Sewell 2009).

Many of the papers I first read were review papers on microplastics that mostly discussed general concepts like dispersal mechanisms, trophic transfer, or how microplastics become degraded. While I often think of review papers as treasure chests, since they neatly and succinctly summarise an often complicated and busy area of research into just a few pages, sometimes the fine-scale detail can go missing. Therefore, when reading these review papers, I wasn’t learning the in depth details about specific studies where microplastics had been detected in a group of individuals, population or species. So I felt the statement “Plastics are ubiquitous” was just a good (and pretty dramatic) opening line for a paper. However, once I delved into the studies on single species, I was overwhelmed by the amount of results that GoogleScholar spit out at me. If you type “microplastics marine” into the search bar, you’ll get about 7,650 results. This amount might not sound like a lot, especially if you compare it to say “gray whale”, which generates 96,600 results. Yet, the microplastic extraction method typically used was only developed in 2004 (Thompson et al. 2004). Hence, in a span of just 15 years, over 7,000 studies have detected microplastics in over 660 marine organisms (Secretariat of the Convention on Biological Diversity 2012) – a fact I find extremely troubling.

Fig 2. Graphic explaining how plastics don’t go away. Source: Biotecnika.

Microplastics are most commonly viewed as particles <5 mm in size (though there is some contention on this size classification, e.g. Claessens et al. 2013). Microplastics arise from several sources, including fragmentation of larger plastics by UV photo-degradation, wave action and physical abrasion, loss of pre-production pellets (nurdles) and polystyrene beads from shipping vessels, waste water discharge containing microbeads used in cosmetics and microfibers released during the washing of textiles and run-off from land (Nelms et al. 2018). Their small size makes these persistent particles bioavailable to ingestion by a variety of marine taxa, ranging from small prey organisms such as zooplankton, to large megafauna such as whales.

Zooplankton are at the base of marine food webs and are therefore consumed in large quantities by a large number of consumers. The propensity of zooplankton to feed in surface waters makes them highly susceptible to encountering and ingesting microplastics as this is where these synthetic particles are highly abundant (Botterell et al. 2018). Microplastics have been detected in zooplankton from the Northeast Pacific Ocean (Desforges et al. 2015), northern South China Sea (Sun et al. 2017), and Portuguese coast (Frias et al. 2014). Additionally, there is documented overlap between microplastic and zooplankton occurrence at many more locations (e.g. North Western Mediterranean Sea, Collignon et al. 2012; Baltic Sea, Gorokhova 2015; Arctic Ocean, Lusher et al. 2015a). As microplastics research is still in its relative infancy, the extent to which microplastics are ingested by zooplankton and the consequences of this behaviour are uncertain. Nevertheless, exposure to microplastics could lead to entanglement of particles within feeding appendages and/or block internal organs, which may result in reduced feeding, poor overall health, injury and death (Desforges et al. 2015). Though a lab study has found that microplastics are expelled by zooplankton after ingestion, the gut-retention times varied between species, and there is the potential risk of exposure to toxins that leech off of particles while in the body (Cole et al. 2013; the below video is from the afore-mentioned study showing how plankton eat plastics, which are illuminated in fluorescent green).

The large knowledge gap regarding the health implications indicates a strong need for more laboratory studies that investigate the long-term effects of persistent exposure to microplastics on lower trophic organisms, as well as continued short-term experiments that examine whether different zooplankton species are affected differently, since morphologies and life-histories vary widely.

Let’s take a step back and re-focus our lens onto a marine taxa that is much, much bigger in size than a zooplankton: cetaceans. Plastic debris has been documented in the stomachs of stranded individuals of several cetacean species (See Baulch & Perry 2014 for a review), however findings of microplastics in cetaceans are less common. Since cetaceans consume large amounts of prey a day, up to several tons daily for some baleen whales, the likelihood that they are ingesting microplastics through their prey is relatively high (Nelms et al. 2018). Therefore the low number of reported cases is again likely due to the relative novelty of microplastic detection methods. Despite the paucity of studies, microplastics have been found in a True’s beaked whale (Mesoplodon mirus, Lusher et al. 2015b), a humpback whale (Megaptera novaeangliae, Besseling et al. 2015) and an Indo-Pacific humpback dolphin (Sousa chinensis, Zhu et al. 2018), showing that microplastic ingestion by cetaceans does occur. Whether these individuals actively (i.e. active feeding) or passively (i.e. uptake through prey consumption) consumed the microplastics, or inhaled them at the water-air interface, is unknown. As with zooplankton, the short- and long-term impacts of ingesting microplastics by marine mammals is also unknown, though impacts on survival, feeding and uptake of toxins are all possibilities.

Fig 3. Example of a light trap sample collected off the Newport coast. Source: L. Torres.

The data collection and analysis I am doing for my thesis will hopefully fill small pockets in these large knowledge gaps. I hope to be able to quantify the extent of microplastic pollution among zooplankton species in nearshore Oregon waters. By comparing samples from several years, months and locations, I will determine whether microplastic loads vary spatially and temporally. Since their abundance and presence have been described as being patchy due to the influence of oceanographic and weather conditions (GESAMP 2016), it would seem reasonable to assume that there will be variation. But, results are a ways away as we have not even started our microplastic extraction techniques, which involves digesting samples in potassium hydroxide solution, incubating them at 50ºC for 48-72 hours, sorting through the dissolved material to identify potential plastics and sending them away for analysis. We first have to work our way through jars upon jars of unopened zooplankton light trap samplesthat need to be sorted by species. I am thankfully joined by undergraduate Robyn Norman who has already assisted this project immensely over the last two years with her zooplankton sorting prowess. So in case anyone wants to come looking for us over the next few weeks, you’ll find both Robyn and me sitting in front of a laminar flow hood in the lab of ecotoxicologist Dr. Susanne Brander, with whom we are collaborating on the microplastics portion of my thesis.


References

Baulch, S., & Perry, C., Evaluating the impacts of marine debris on cetaceans. Marine Pollution Bulletin, 2014. 80(1-2): 210-221.

Besseling, E., et al., Microplastic in a macro filter feeder: humpback whale Megaptera novaeangliae. Marine Pollution Bulletin, 2015. 95: 248-252.

Botterell, Z.L.R., et al., Bioavailability and effects of microplastics on marine zooplankton: a review. Environmental Pollution, 2018. 245: 98-110.

Claessens, M., et al., New techniques for the detection of microplastics in sediments and field collected organisms. Marine Pollution Bulletin, 2013. 70(1-2): 227-233.

Cole, M., et al., Microplastic ingestion by zooplankton. Environmental Science & Technology, 2013. 47(12): 6646-6655.

Collignon, A., et al., Neustonic microplastic and zooplankton in the North Western Mediterranean Sea. Marine Pollution Bulletin, 2012. 64(4): 861-864.

Desforges, JP.W., et al., Ingestion of microplastics by zooplankton in the Northeast Pacific Ocean. Archives of Environmental Contamination and Toxicology, 2015. 69(3): 320-330.

Eriksen, M., et al., Plastic pollution in the world’s oceans: more than 5 trillion plastic pieces weighing over 250,000 tons afloat at sea. PLoS ONE, 2014. doi.org/10.1371/journal.pone.0111913.

Fendall, L.S., & Sewell, M.A., Contributing to marine pollution by washing your face: microplastics in facial cleansers. Marine Pollution Bulletin, 2009. 58(8): 1225-1228.

Frias, J.P.G.L., et al., Evidence of microplastics in samples of zooplankton from Portuguese coastal waters. Marine Environmental Research, 2014. 95: 89-95.

GESAMP, Sources, fates and effects of microplastics in the marine environment: part 2 of a global assessment. Second United Nations Environment Assembly, 2016. http://www.gesamp.org/site/assets/files/1720/rs93e.pdf

Gorokhova, E., Screening for microplastic particles in plankton samples: how to integrate marine litter assessment into existing monitoring programs? Marine Pollution Bulletin, 2015. 99(1-2): 271-275.

Lusher, A.L., et al., Microplastics in Arctic polar waters: the first reported values of particles in surface and sub-surface samples. Scientific Reports, 2015a. 5: 14947.

Lusher, A.L., et al., Microplastic and macroplastic ingestion by a deep diving, oceanic cetacean: the True’s beaked whales Mesoplodon mirus. Environmental Pollution, 2015b. 199: 185-191.

Machovsky-Capuska, G.E., et al., A nutritional perspective on plastic ingestion in wildlife. Science of the Total Environment, 2019. 656: 789-796.

Nelms, S.E., et al., Investigating microplastic trophic transfer in marine top predators. Environmental Pollution, 2018. 238: 999-1007.

Secretariat of the Convention on Biological Diversity and the Scientific and Technical Advisory Panel – GEF (2012), Impacts of marine debris on biodiversity: current status and potential solutions. Montreal, Technical Series. 67: 1-61.

Sun, X., et al., Ingestion of microplastics by natural zooplankton groups in the northern South China Sea. Marine Pollution Bulletin, 2017. 115(1-2): 217-224.

Thompson, R.C., et al., Lost at sea: where is all the plastic? Science, 2004. 304(5672): 838.

Zhu, J., et al., Cetaceans and microplastics: First report of microplastic ingestion by a coastal delphinid, Sousa chinensis. Science of the Total Environment, 2018. 659: 649-654.