Classifying cetacean behavior

Clara Bird, Masters Student, OSU Department of Fisheries and Wildlife, Geospatial Ecology of Marine Megafauna Lab

The GEMM lab recently completed its fourth field season studying gray whales along the Oregon coast. The 2019 field season was an especially exciting one, we collected rare footage of several interesting gray whale behaviors including GoPro footage of a gray whale feeding on the seafloor, drone footage of a gray whale breaching, and drone footage of surface feeding (check out our recently released highlight video here). For my master’s thesis, I’ll use the drone footage to analyze gray whale behavior and how it varies across space, time, and individual. But before I ask how behavior is related to other variables, I need to understand how to best classify the behaviors.

How do we collect data on behavior?

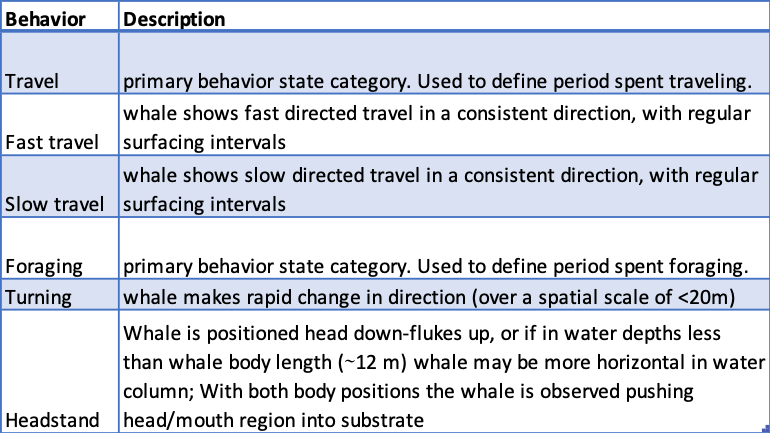
One of the most important tools in behavioral ecology is an ‘ethogram’. An ethogram is a list of defined behaviors that the researcher expects to see based on prior knowledge. It is important because it provides a standardized list of behaviors so the data can be properly analyzed. For example, without an ethogram, someone observing human behavior could say that their subject was walking on one occasion, but then say strolling on a different occasion when they actually meant walking. It is important to pre-determine how behaviors will be recorded so that data classification is consistent throughout the study. Table 1 provides a sample from the ethogram I use to analyze gray whale behavior. The specificity of the behaviors depends on how the data is collected.

Table 1. Sample from gray whale ethogram. Based on ethogram from Torres et al. (2018).

In marine mammal ecology, it is challenging to define specific behaviors because from the traditional viewpoint of a boat, we can only see what the individuals are doing at the surface. The most common method of collecting behavioral data is called a ‘focal follow’. In focal follows an individual, or group, is followed for a set period of time and its behavioral state is recorded at set intervals.  For example, a researcher might decide to follow an animal for an hour and record its behavioral state at each minute (Mann 1999). In some studies, they also recorded the location of the whale at each time point. When we use drones our methods are a little different; we collect behavioral data in the form of continuous 15-minute videos of the whale. While we collect data for a shorter amount of time than a typical focal follow, we can analyze the whole video and record what the whale was doing at each second with the added benefit of being able to review the video to ensure accuracy. Additionally, from the drone’s perspective, we can see what the whales are doing below the surface, which can dramatically improve our ability to identify and describe behaviors (Torres et al. 2018).

Categorizing Behaviors

In our ethogram, the behaviors are already categorized into primary states. Primary states are the broadest behavioral states, and in my study, they are foraging, traveling, socializing, and resting. We categorize the specific behaviors we observe in the drone videos into these categories because they are associated with the function of a behavior. While our categorization is based on prior knowledge and critical evaluation, this process can still be somewhat subjective.  Quantitative methods provide an objective interpretation of the behaviors that can confirm our broad categorization and provide insight into relationships between categories.  These methods include path characterization, cluster analysis, and sequence analysis.

Path characterization classifies behaviors using characteristics of their track line, this method is similar to the RST method that fellow GEMM lab graduate student Lisa Hildebrand described in a recent blog. Mayo and Marx (1990) analyzed the paths of surface foraging North Atlantic Right Whales and were able to classify the paths into primary states; they found that the path of a traveling whale was more linear and then paths of foraging or socializing whales that were more convoluted (Fig 1). I plan to analyze the drone GPS track line as a proxy for the whale’s track line to help distinguish between traveling and foraging in the cases where the 15-minute snapshot does not provide enough context.

Figure 1. Figure from Mayo and Marx (1990) showing different track lines symbolized by behavior category.

Cluster analysis looks for natural groupings in behavior. For example, Hastie et al. (2004) used cluster analysis to find that there were four natural groupings of bottlenose dolphin surface behaviors (Fig. 2). I am considering using this method to see if there are natural groupings of behaviors within the foraging primary state that might relate to different prey types or habitat. This process is analogous to breaking human foraging down into sub-categories like fishing or farming by looking for different foraging behaviors that typically occur together.

Figure 2. Figure from Hastie et al. (2004) showing the results of a hierarchical cluster analysis.

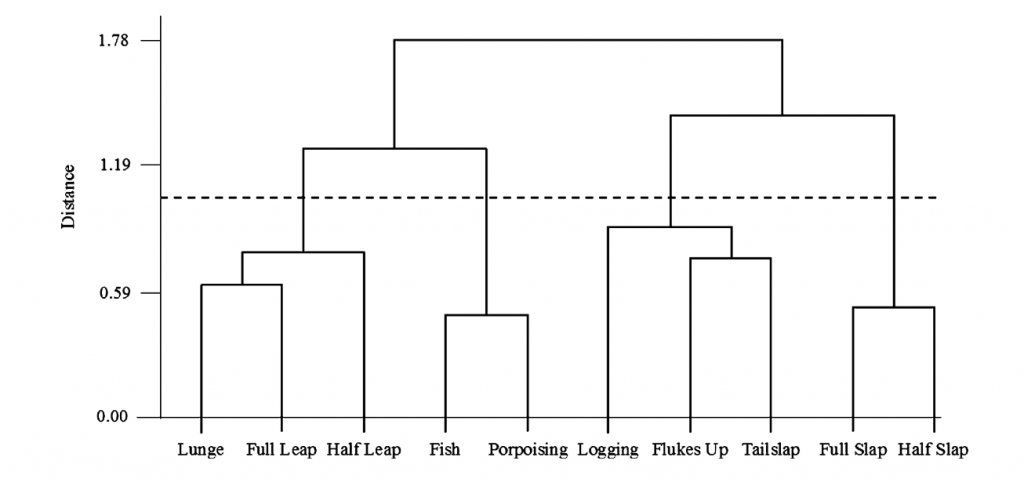
Lastly, sequence analysis also looks for groupings of behaviors but, unlike cluster analysis, it also uses the order in which behaviors occur. Slooten (1994) used this method to classify Hector’s dolphin surface behaviors and found that there were five classes of behaviors and certain behaviors connected the different categories (Fig. 3). This method is interesting because if there are certain behaviors that are consistently in the same order then that indicates that the order of events is important. What function does a specific sequence of behaviors provide that the behaviors out of that order do not?

Figure 3. Figure from Slooten (1994) showing the results of sequence analysis.

Think about harvesting fruits and vegetables from a garden: the order of how things are done matters and you might use different methods to harvest different kinds of produce. Without knowing what food was being harvested, these methods could detect that there were different harvesting methods for different fruits or veggies. By then studying when and where the different methods were used and by whom, we could gain insight into the different functions and patterns associated with the different behaviors. We might be able to detect that some methods were always used in certain habitat types or that different methods were consistently used at different times of the year.

Behavior classification methods such as these described provide a more refined and detailed analysis of categories that can then be used to identify patterns of gray whale behaviors. While our ultimate goal is to understand how gray whales will be affected by a changing environment, a comprehensive understanding of their current behavior serves as a baseline for that future study.

References

Burnett, J. D., Lemos, L., Barlow, D., Wing, M. G., Chandler, T., & Torres, L. G. (2019). Estimating morphometric attributes of baleen whales with photogrammetry from small UASs: A case study with blue and gray whales. Marine Mammal Science, 35(1), 108–139. https://doi.org/10.1111/mms.12527

Darling, J. D., Keogh, K. E., & Steeves, T. E. (1998). Gray whale (Eschrichtius robustus) habitat utilization and prey species off Vancouver Island, B.C. Marine Mammal Science, 14(4), 692–720. https://doi.org/10.1111/j.1748-7692.1998.tb00757.x

Hastie, G. D., Wilson, B., Wilson, L. J., Parsons, K. M., & Thompson, P. M. (2004). Functional mechanisms underlying cetacean distribution patterns: Hotspots for bottlenose dolphins are linked to foraging. Marine Biology, 144(2), 397–403. https://doi.org/10.1007/s00227-003-1195-4

Mann, J. (1999). Behavioral sampling methods for cetaceans: A review and critique. Marine Mammal Science, 15(1), 102–122. https://doi.org/10.1111/j.1748-7692.1999.tb00784.x

Slooten, E. (1994). Behavior of Hector’s Dolphin: Classifying Behavior by Sequence Analysis. Journal of Mammalogy, 75(4), 956–964. https://doi.org/10.2307/1382477

Torres, L. G., Nieukirk, S. L., Lemos, L., & Chandler, T. E. (2018). Drone up! Quantifying whale behavior from a new perspective improves observational capacity. Frontiers in Marine Science, 5(SEP). https://doi.org/10.3389/fmars.2018.00319

Mayo, C. A., & Marx, M. K. (1990). Surface foraging behaviour of the North Atlantic right whale, Eubalaena glacialis, and associated zooplankton characteristics. Canadian Journal of Zoology, 68(10), 2214–2220. https://doi.org/10.1139/z90-308

An update on Oregon’s sound sensitive marine mammal, the harbor porpoise.

By Amanda Holdman, M.S. Student

Marine renewable energy is developing at great speeds all around the world. In 2013, the Northwest Marine Renewable Energy Center (NMREC) chose Newport, Oregon as the future site of first utility-scale, grid-connected wave energy test site in the United States – The Pacific Marine Energy Center (PMEC). The development of marine energy holds great potential to help meet our energy needs – it is renewable, and it is predicted that marine energy sources could fulfill nearly one-third of the United States energy demands.

Wave energy construction in Newport could begin as early as 2017. Therefore, it is important to fully understand the potential risks and benefits of wave energy as the industry moves forward. Currently, there is limited information on wave energy devices and the potential ecological impacts that they may have on marine mammals and their habitats. In order to assess the effects of wave energy, pertinent information needs to be collected prior to the installation of the devices.

This is where I contribute to the wave energy industry in Oregon.

Harbor porpoise are a focal species when it comes to renewable energy management; they are sensitive to a range of anthropogenic sounds at very low levels of exposure and may show behavioral responses before other marine mammals, making them a great indicator species for potential problems with wave energy. Little is known about harbor porpoise in Oregon, necessitating the need to look at the fine scale habitat use patterns of harbor porpoise within the proposed wave energy sites.

I used two methods to study harbor porpoise presence and activity in coastal waters: visual boat surveys, and passive acoustic monitoring. Visual surveys have a high spatial resolution and a low temporal resolution, meaning you can conduct visual boat surveys over a wide area, but only during daylight hours. Whereas acoustic surveys have opposite characteristics; you can conduct surveys during all hours of the day, however, the range of the acoustic device is only a few hundred meters. Therefore, these methods work well together to gain complimentary information about harbor porpoise. These methods are crucial for collecting baseline data on harbor porpoise distribution, and providing valuable information for understanding, managing, and mitigating potential impacts.

Bi-monthly standard visual line-transect surveys were conducted for two full years (October 2013-2015), while acoustic devices were deployed May – October 2014. Field work ended last October, and since then, data analysis efforts have uncovered  seasonal, diel, and tidal patterns in harbor porpoise occurrence and activity.

Harbor porpoises in Oregon are thought to be seasonally migratory. With the onset of spring, coinciding with the start of the upwelling season, porpoise are thought to move inshore and abundance increases into the summer. Most births also occur during the late spring and summer. With the return of winter, porpoise are thought to leave the coastal waters and head out to the deeper waters (Dohl 1983, Barlow 1988, Green et al. 1992).

Results from my data support this seasonal trend. Both visual survey and acoustic recording data document the general pattern of peak porpoise presence occurring in the summer months of June and July, with a gradual decline of detections into the fall (Fig. 1 & 2).

1

Figure 1: Overall, from our acoustic surveys we see a large increase from May to June, suggesting the arrival of harbor porpoise to coastal waters. From July, we see a slow decline into the fall months, suggestive of harbor porpoise moving offshore.

2

Figure 2: Our data from visual surveys mimic those of our acoustic surveys. We see a large increase of porpoises from May to June and then a decline into the fall. We had very low survey effort in July, due to rough seas.  If we were able to survey more, it is likely we would have seen more harbor porpoise during this time.

Using acoustic recorders, we are able to get data on harbor porpoise occurrence throughout all hours of the day, regardless of weather conditions. We deployed hydrophones in two locations – one in a near-shore REEF habitat located 4 km from shore, and the second in the middle of the South Energy Testing Site (SETS) 12 km off-shore. These two sites differ in depth and habitat type. The REEF habitat is 30 m deep and has a rocky bottom as a habitat type, while SETS is 60 m deep and has a sandy bottom. When we compare the two sites (Figure 3), we can see that harbor porpoise have a preference for the REEF site.

Additionally, we are also able to get some indices of behavior from acoustic recordings. Equivalent to sonar or radar, marine mammals use echolocation (high frequency sounds) to communicate and navigate. Marine mammals, specifically odonotocetes, also use echolocation to locate prey at depth when there is very little or no light. Porpoises use a series of clicks during their dives, and as the porpoise approach their prey, the clicks become closer and closer together so they sound like a continuous buzz. When studying echolocation patterns in odontocetes we typically look at the inter-click-intervals (ICIs) or the time between clicks. When ICIs are very close together (less than 10 ms apart) it is considered a foraging behavior or a buzz. Anything greater than 10 ms is classified as other (or clicks in this figure).

Click_Buzz_bargraph.

Figure 3: We see harbor porpoise clicks were detected about 27% of the time at the REEF, but only 18% at SETS. Potential feeding was also higher at the REEF site (14%) compared to (4%) at SETS.

Not only did we find patterns in foraging behavior between the two sites, we also found foraging patterns across diel cycles and tidal cycles:

  1. We found a tendency for harbor porpoise to forage more at night (Figure 4).
  2. The diel pattern of harbor porpoise foraging is stronger at the SETS than the REEF site (Figure 4). This result may be due to the prey at the SETS (sandy bottom) exhibiting vertical migration with the day and night cycles since prey there do not have alternative cover, as they would in the rocky reef habitat.
  3. At the reef site, we see a relationship between increased foraging behavior and low tide (Figure 5).

ratio

Figure 4: When analyzing data for trends in foraging behavior across different sites and diel cycles, we use a ratio of buzzes to clicks, so that we incorporate both echolocation behaviors in one value. This figure shows us that the ratio of buzzes to clicks is pretty similar at the REEF site across diel periods, but there is more variation at the SETS site, with more detections at night and during sunrise.

blog_5

Figure 5: Due to the circular nature of tides rotating between high tide and low tide, circular histograms help to observe patterns. In this figure, we see a large preference for harbor porpoise to feed during low tide. We are unclear why harbor porpoise may prefer low tide, but the relationship may be due to minimal current movement that could enhance feeding opportunities for porpoises.

Overall, the combination of visual surveys and passive acoustic monitoring has provided high quality baseline data on harbor porpoise occurrence patterns. It is results like these that can help with decisions regarding wave energy siting, operation and permitting off of the Oregon Coast.

REFERENCES

Barlow, J. 1987. Abundance estimation for harbor porpoise (Phocoena phocoena) based on ship surveys along the coasts of California, Oregon and Washington. SWFC Administrative Report LJ-87-05. Southwest Fishery Center, La Jolla, CA. 36pp.

Dohl, T.P., Guess, R.C., Dunman, M.L. and Helm, R.C. 1983, Cetaceans of central and northern California, 1980-83: status, abundance, and distribution. Final Report to the Minerals Management Service, Contract 14-12-0001-29090. 285pp.

Green, G.A., Brueggeman, J. J., Grotefendt, R.A., Bowlby, C.E., Bonnel, M. L. and Balcomb, K.C. 1992. Cetacean distribution and abundance off Oregon and Washington, 1989-1990. Chapter 1 In Oregon and Washington Marine Mammal and Seabird Surveys. Ed. By J. J. Brueggeman. Minerals Management Service Contract Report 14-12-0001-30426.

Surveying Harbor Porpoises on the Oregon Coast!

Hello Gemm lab readers!

Spring has officially made it to the Oregon coast.  The smells of blooming flowers are lingering in the air at the Hatfield Marine Science Center (HMSC), the seagulls are hovering around our afternoon BBQ’s, the local whale watching tour boats are zipping through the jetty’s to catch sight of all the whales still hovering in the area, and my team and I are right behind them as the field season is upon us in full force!

My name is Amanda Holdman and I am a master’s student in the Oregon State University’s Department of Fisheries and Wildlife and Marine Mammal Institute. Our lab, the geospatial ecology of marine megafuana, or GEMM lab for short, focuseharbor-porpoises_569_600x450s on the ecology, behavior and conservation of marine megafauna including cetaceans, pinnipeds, seabirds, and sharks. My research in particular is centered around the cetacean species that inhabit Oregon’s near coastal waters. While the cetacean order includes over 80 species, 30 of which can be found in Oregon, I am specifically targeting the small and charismatic harbor porpoise! I am hoping to answer questions about seasonal and diel patterns, and the drivers of these patterns to create a better understanding of the porpoise community off the coast of Newport.

To accomplish this, I have been using a couple different survey methods! Over the last year or so I have been conducting marine mammal visual surveys with a crew of observers, binoculars, cameras and lifejackets.  We’ve been very fortunate to work alongside and partner up with a number of labs and projects taking place at HMSC — including Sarah Henkel’s Benthic Ecology Lab, Jay Peterson’s Zooplankton Ecology Project, and Rob Suryan’s Seabird Oceanography Lab — who’ve invited us to share their boat time and join in on cruises to spot marine mammals. We had some motivating cruises with last year’s field season (bow riding pacific white sided dolphins and a possible fin whale sighting!) but now that the summer season is around the corner, It’s time to recruit additional observers and get everyone up to date on their safety certifications (at sea safety, first aid, etc.)

10511604_10152778085291070_5111035247949699751_o

Porpoise-1

While we currently have about 6-8 boat trips a month, I am not only just looking  for harbor porpoises, I’m also listening for them. To complement the visual surveys, I’ve added an acoustic component to my research, with the help of the Oregon State Research Collective for Applied Acoustics lab (ORCAA). This allows me to survey for harbor porpoises even under the worst sea conditions, when boat trips are unavailable. Odontocetes, such as the harbor porpoise use echolocation to navigate and forage and can be identified acoustically by their frequency range. While a full-depth analysis of last summer’s data hasn’t yet been accomplished, I was able to take a quick peek and MAN IT LOOKS GOOD! Both harbor porpoise and killer whale vocalizations were identified – you can check out the spectrogram below! This combination of using visual and acoustic surveys will help us answer when the porpoises are in our near waters, and where there primary hang-outs are!

REEF-20140612-231045
Visual representation of an echolocation clicks emitted by a feeding harbor porpoise

But springtime isn’t just for fieldwork, it’s also for course work! This quarter, my lab mate Erin Picket and I have enrolled into Julia Jones “Arcaholics anonymous” class, an introductory spatial statistics and GIS course that helps us piece together all the hard work we’ve put towards data collection to look for trends of animal distributions across space and time. This is the first time for both of us that we  get to upgrade our excel spreadsheets into a visual representation of our data! There will be more updates to come soon on how our projects are unfolding, but if you can’t wait til then, feel free to follow along with our class website!