Sketchnoting, also known as « visual notetaking » is a technique combining words with drawings, diagrams and typography to record ideas (Figure 1). This concept was invented by designer Michael Rohde in 2006 to combine tedious notetaking with doodling. He quickly discovered that adding drawings to his notes helped him concentrate and remember better. He would also be more likely to come back to his notes later on (something we must all admit is not so common). Similarly, after I followed a short online class by Magalie Le Gall (Sorbonne Université) I became convinced that sketchnoting shows promise and can have a positive impact on my scientific work.
Figure 1 : What is sketchnoting ? By verbaltovisual.com
Draw to remember more
The impact of sketchnoting on memory is not without scientific backing. Back in 1971, Allan Paivio, an American professor of psychology, developed the dual-coding theory. It posits that visual and verbal information are mentally processed in two distinctive systems and have additive effects on cognitive operations such as memory. Numerous experiments have empirically confirmed that dual coding (images + words) improve learning and memory. In addition, converting what you hear or see into visually interconnected drawings and words helps you synthesize content. Personalizing ideas into your own symbols and images also lays a strong basis for remembering. The implications of sketchnoting for educational purposes are therefore huge!
Draw to stay focused
I have only started sketchnoting recently but the impact this method had on my concentration immediately struck me. In the constant stream of information that we experience nowadays, I found that synthesizing ideas on paper using symbols and diagrams helped me stay focused on what I am presently reading or hearing, instead of letting my thoughts drift in a thousand different directions. Again, this outcome can have big implications in the classroom or at your desk. Using very basic lettering, bullets, frames and connectors (Figure 2), sketchnoting appears to be a good didactic tool.
Figure 2 : A few drawing tips by sketchnoter Carol Anne McGuire.
Draw to create and appeal
Figure 3 (source: ASIDE 2013)
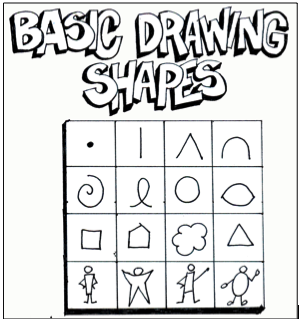
Mike Rohde’s motto is « ideas, not art » because a lot of people have an immediate reaction of fear of failure when they are asked to draw something. He emphasizes that sketchnoting is not necessarily meant to be pretty, as it mostly serves a personal purpose. However, if you have an artistic fiber (even slightly!), sketchnoting becomes a great communication tool and can help you convey ideas in posters, slides, blogs, etc. Even very simple drawings are appealing and fun. You can create your own visual libraries from a few basic shapes (Figure 3). Anything can be drawn with a few simple lines! You can also use drawing libraries such as quickdraw.withgoogle.com to find examples and eventually gain confidence… as you realize that the average people’s drawing skills are pretty low (the dolphin drawings on this website are worth a look)!
Now, the key to developing this new skill is clearly to practice! From now on, I have decided to record every one of our monthly GEMM lab meetings in a sketchnote to make sure I keep track of our great discussions. I will also definitely try to apply this approach when reading scientific literature, attending conferences, preparing drafts, teaching and so much more! And for a start, what could be better then to sketchnote the research project I currently working on (Figure 4)?
Figure 4 : My first attempt at sketchnoting! Illustration of the OPAL project that I am working on (credit : S. Derville).
Ever since I was a teenager, I have been drawn to both arts and sciences. When I decided to go down the path of marine biology and research, I never thought I would one day be led to exploit my artistic skills as well as my scientific interests.
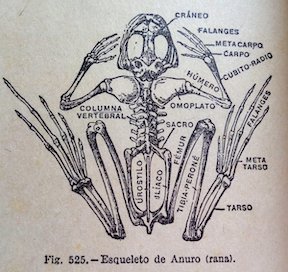
Processing data, coding, analyzing, modeling… these tasks form the core of my everyday work and are what generates my excitement and passion for research. But once a new result has come up, or a new hypothesis has been formed, how boring would it be to keep it for myself? Science is all about communication, exchanges with our peers, with stakeholders, and with the general public. Graphical representations have always been supported in research throughout the history of sciences, and particularly the life sciences (Figure 1).
I have come to realize how much I enjoy this aspect of my work, and also how much I wish I was better prepared for it! In this blogpost I will talk about visual communication in science, and tackle the question of how to make our plots, diagrams, powerpoints, figures, maps, etc. convey information that goes beyond any spoken language? I have compiled a few tips from the design and infographics fields that I think could be reinvested in our scientific communication material.
Figure 1. Illustration from anonymous biology book (credit: Katie Garrett)
Plan, order, design
This suggestion may appear like a rather simplistic piece of advice, but any form of communication should start with a plan. What is the name of my project, the goal, and the audience? A scientific conference poster will not be created with the same design as a flyer aimed at the general public, nor will the same tools be used. Libre office powerpoint, canva, inkscape, scribus, R, plotly, GIMP… these are the open-source software I use on a regular basis but there so many more possibilities!
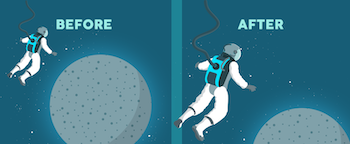
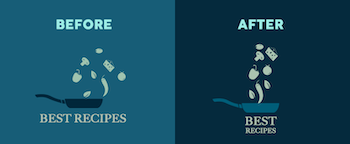
For whatever the type of visual you want to create, there are two major rules that need to be considered. First, embrace the empty space! You may think that you are wasting space that could be filled by all sorts of extremely valuable pieces of information… but this empty space has a purpose all by itself. The empty space brings forward the central elements of your design and will help focus the attention of the viewer toward them (top panel of Figure 2). Second, keep it neat and aligned. Whether you choose to anchor elements to each other or to an invisible grid, pay attention to details so that all images and text in the design from a harmonious whole (bottom panel in Figure 2).
Figure 2. Empty spaces and alignment principles of design – examples presented by Kingcom (http://kingkom.net/12-criteres-hierarchie-visuelle/)
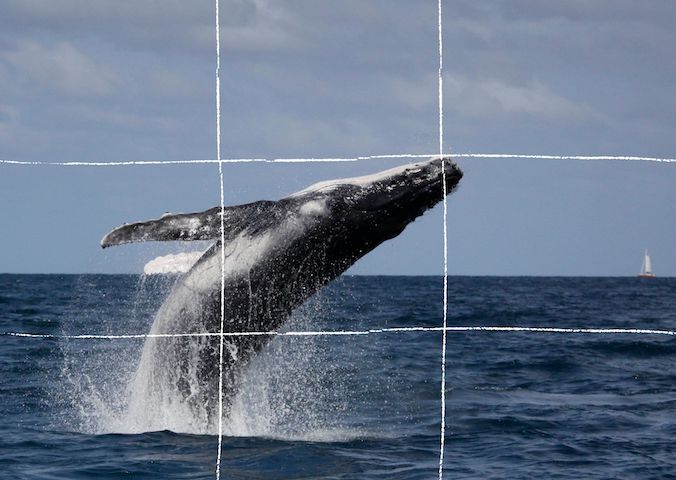
Alignment is also an essential aspect to consider when editing images. More than any text, images will provide the first impression to the viewer and may subjectively communicate ideas in an instant. To make them most effective, images may follow the ‘rule of thirds’. Imagine breaking the image down into thirds, hence creating four directive lines over it (Figure 3). Placing the points of interest of the image at the intersections or along the lines will provide balance and attract the viewer’s attention. In marine mammal science where we often use pictures of animals with the ocean as a background, aligning the horizon along one of these horizontal lines may be a good technique (which I have not followed in Figure 3 though!).
Figure 3. Rule of thirds example applied to a photo of a humpback whale calf (South Lagoon New Caledonia, credit: Opération Cétacés – Solène Derville). Notice how the tip of the calf’s jaw is at the intersection of two lines.
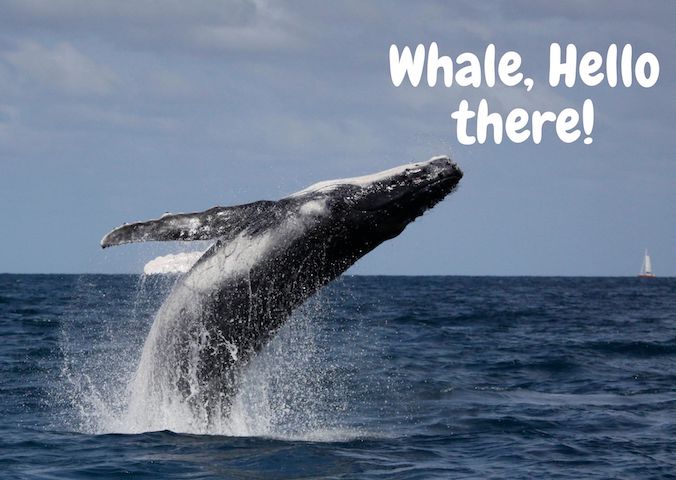
When adding text to images, it is important to not overwhelm illustrations with text by trying to use extensive written material (which happens much too often). I try to keep the text to the strict minimum and let the visuals speak for themselves. When including text over or next to an image, I place the text in the empty spaces, where the eye is drawn to (Figure 4). When using dark or contrasted images, I add a semi-transparent layer in between the text and the image to make my text pop out.
Figure 4. Text embedding example applied to a photo of a humpback whale calf (South Lagoon New Caledonia, credit: Opération Cétacés – Solène Derville). Notice how I placed the text in the empty space so that the nose of the calf would point to it.
Fonts
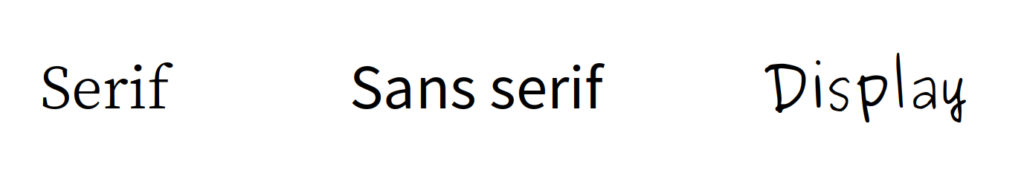
Tired of using Arial, Times and Calibri but don’t know which other font to pick? One good piece of advice I found online was to choose a font that complements the purpose of the design. To do so, it is necessary to choose the message before picking the font. There are three categories of fonts (show in Image 1):
– Serif (classic style designed for books as the little feet at the extremities of the letters guide the eye along the lines of text)
– Sans serif (designed to look clean on digital screen)
– Display (more personality, but to be used in small doses!)
Image 1. Examples of each font category
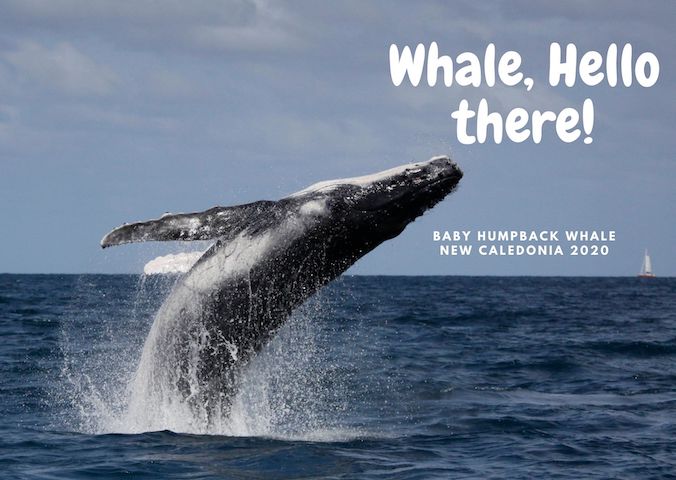
I have also learned that pairing fonts together is often about using opposites (Figure 5). Contrasting fonts are complementary. For instance, it is visually appealing to combine a very bold font with a very light font, or a round font with something tall. And if you need more font choices than the ones provided by your usual software, here is a web repository to freely download thousands of different fonts: https://www.dafont.com
Figure 5. Paired fonts example applied to a photo of a humpback whale calf (South Lagoon New Caledonia, credit: Opération Cétacés – Solène Derville). Notice how I combined a rounded font with a smaller sans serif font.
Colors
Colors have inherent meaning that depends on individual cultures. Whether we want it or not, any plot, photo, or diagram that we present to an audience will carry a subliminal message depending on its color palette. So better make it fit with the message!
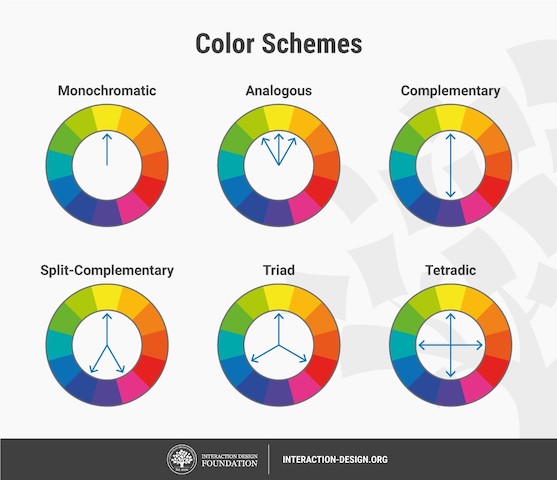
Let us go passed the boring blue shades we have used for all of our marine science presentations so far, and instead open ourselves up to an infinite choice of colors! Color nuances are defined by three things: hue (the color itself), saturation (intensity, whether the color looks more subtle or more vibrant), and value (how dark or light a color is, ranging from white to black). The color wheel helps us visualize the relationships between hues and pick the best associations (Figure 6).
Figure 6. The color wheel helps us visualize the relationships between hues and pick the best associations. Any of the principles above should work, from the simple monochromatic schemes to the more complex triad or tetradic schemes.
First, pick the main color, the hero color for your design. Choose a cool color (blues and greens) if you want to provide a calming impression or a warm color (reds and yellows) for something more energizing. This basic principle of color theory made me think back on the black/blue dark shaded presentations that I might have attended in the past and had trouble staying awake!
Now, create your color palette, which are the three to four colors that will compose your design, ideally combining some vibrant and some more neutral colors for contrast. For instance, in a publication, a color palette may be used consistently in all plots or figures to represent a set of variables, study areas, or species . Now how do you pick the right complementary colors? The color wheel provides you with a few basic principles that should help you choose a palette (Figure 6). From monochromatic to tetradic schemes, the choice is up to you:
– monochromatic colors: varying values or saturation of a given color picked in the wheel
– analogous colors: colors sitting next to each other in the wheel
– complementary color: colors sitting opposite to each other
If you are an R user, there are a myriad of color palettes available to produce your visuals. One of the most comprehensive list I have found was compiled by Emil Hvitfeldt in github (https://github.com/EmilHvitfeldt/r-color-palettes). For discrete color palettes, I enjoy using the Canva palettes, which are available both in the Canva designs and in R using the ‘canva’ library in combination with the ‘ggplot2’ library (https://www.canva.com/learn/100-color-combinations/).
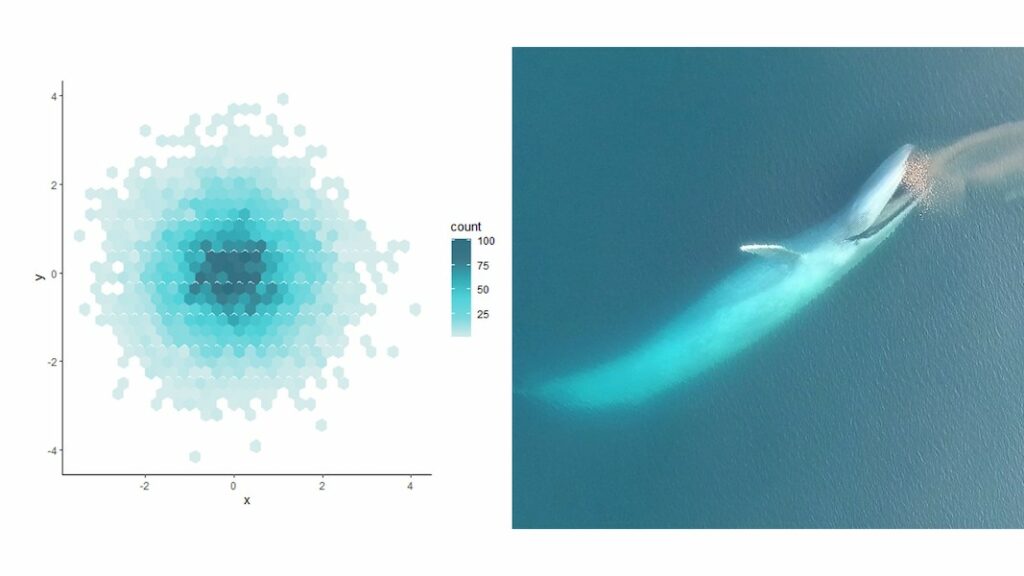
In practice, this means I can produce R plots or maps with color codes that match those I use in my canva presentations or posters. And finally, thumbs up to Dawn and Clara for creating our very own GEMM lab color palette based on whale photos collected in the field (Figure 7: https://github.com/dawnbarlow/musculusColors)!
Figure 7: Example of a R plot colored with the musculusColors package using the blue whale “Bmlunge” palette (credit: Dawn Barlow & Clara Bird)
I hope these few tips help you make your science as look as pretty as it is in your mind!
There is something special about the Oregon Coast. It’s like nowhere else in the world. When Lisa told me that gray whales are understudied on our coastline, I secretly and selfishly thought to myself, “I hope it stays that way”. Then I would have a chance to be a pioneer one day too, studying something along this rugged coast full of life, death and everything in between, that no one has answered before. Of course, I only feel this way half of the time.
Yet, the more time I spend in Port Orford, the more I realize that our coastline truly is one of those last frontiers. A place where fundamental questions have yet to be explored, where the passing of seasons brings with it a violent change in conditions. From sunny summer days on the Port Orford beaches taking in the soft glistening of sunlight illuminating Redfish Rocks Marine Reserve, to cold, dark and stormy months with no end in sight and nothing but the sound of wind curving around the bends of your home and rain puttering against the windows.
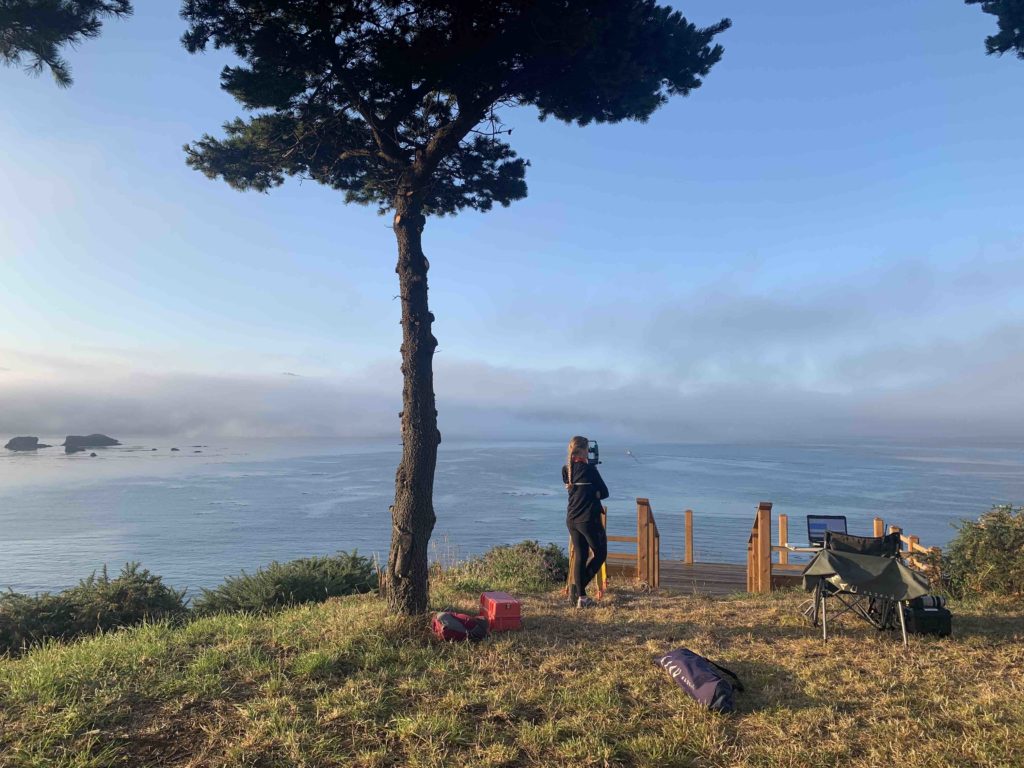
Noah reading a book on the cliff site with a view of Mill Rocks in the background. Source: N. Dolinajec.
But no matter the season, no matter the conditions, the Oregon Coast harnesses something truly special, truly extraordinary. A cyclical diversity of life.
Since I was a kid, the Oregon Coast has inspired me. Not always to think about wildlife, in fact, mostly in other ways. To contemplate more primal philosophical questions. At 28 years old, it’s been a longer road than expected to get to this point, working with these amazing people, in this amazing place, on this amazing project. And the more time that passes, the more failures, missteps and dysfunctional experiences I absorb, the more that I learn about what really needs to change. In the world of course, but, mostly in science.
In the past few years, as I eek closer to 30, and I begin to look back on some of the adventures I have taken in my life, I take heavy note of where I am now, sitting on a kayak in Mill Rocks sampling for gray whale prey abundance and distribution, or atop the cliff, gazing out into the open ocean waiting patiently and graciously (at least trying to be) for a small poof of water spray from the beating surface of the sea. That little poof? It may not seem like much but it’s a sign of life. Of an age-old journey, one we know very little about. And here I am, a part of it, albeit a small one, but nevertheless, forever a part of that great journey.
A foggy view of Mill Rocks from the cliff (left) and a shot from the kayak (right). Source: N. Dolinajec.
And without losing sight of my job, sampling for zooplankton or tracking the whales as they move across the open water, I’ve found myself thinking about the depth of being involved in such an ancient process, and considering a very important question. One that doesn’t spend nearly enough time in the day-to-day conversation of an academic…
What exactly is a scientist? And how does one become a scientist?
The academic path to the sciences is exclusionary, beyond any reasonable level. It discriminates on gender, race, experience and age. Making the sciences, which are meant as a tool to better the world and make useful contributions to society and the future, feel inaccessible for so many people full of potential but without the right boxes ticked on a form.
How many beautiful ideas have been left to decay because of the ego that science has built for itself?
A sign that sits in the front window of the OSU Port Orford Field Station. Source: N. Dolinajec.
Don’t get me wrong, I love science, it has given me joy that other things in life cannot. It has shown me both the complexity of the world and the simplicity of how we view it. And I believe that science can still be the future. But in order for science to command our future, to guide us in the right direction, it cannot be a hierarchy of antiquated procedures any longer. We must open our arms, our minds and our resources to take chances on students, far and wide, that may lack traditional training but instead have other skills or experiences to offer science. Science needs an overhaul. Science needs diversity.
After all, change of perspective can be a profound driver of scientific results, can it not?
Here in Port Orford, in this bizarre year of 2020, we have the beginning, the makings if-you-will, of that very diversity that I am speaking of. The four of us, ‘The Theyodelers’ as we righteously call ourselves, each come from such drastically different places in life only to meet under the same roof for 6 weeks and miraculously not only survive together, but thrive together.
‘The Theyodelers’ after the 2020 (virtual) Port Orford Community Presentation, from left to right: Dr. Leigh Torres, Lisa Hildebrand, Liz Kelly, Mattea Holt Colberg, Noah Dolinajec, Tom Calvanese, Tom McCambridge (front). Source: L. Hildebrand.
And that, that essence of positivity that we have been able to build around one another this season, is exactly what I mean when I say that science needs an overhaul.
We do not all find our way to this moment, doing science in such an inspiring place, in the same way. Some of us are born with the innate ability to see the world through objective eyes, the kind of mind that makes great science happen from an early age. And others find our way to science after being enlightened by trials and travails, failures and mistakes, missed opportunities and missteps.
No matter the journey, we all ended up here. Watching these great gray giants on their journeys.
And it all comes full circle doesn’t it?
Each of our journeys, human or whale, can lead to the very same point despite beginning at very different places. And in that diversity of experience, of life, of age, of color, is where we find our brightest moments, our grandest ideas and our future, driven by science.
By Elizabeth Kelly, Pacific High School senior, GEMM Lab summer intern
Figure 1. Liz on the cliff. Source: E. Kelly.
The gray whale foraging ecology project with OSU’s GEMM Lab has been nothing short of a dream come true. Going into this internship, I was just a high schooler who had taken zoology my previous school year. With my lack of a formal education in marine biology, let alone gray whales, I was a little daunted at the thought of going to a university field station with college students and actual biologists. When I applied for this internship, I didn’t think I was even going to be accepted for the internship, but I applied with high hopes and a lot of excitement. When I was officially accepted, I wanted to start immediately.
Despite my concerns of the steep learning curves I knew I would have to overcome, I was ready to jump right into the internship. The other interns live at the field station since they do not live locally, but I drive to the field station every morning because I live about 20 minutes away. However, this situation has never made me feel like an outsider. I spend a lot of my time at the field station and it would be hard to not get comfortable there immediately. I don’t feel sad that somebody is cooking some sort of delicious meal every night because even though I don’t live at the station, I sometimes stay for dinners. When I’m there for whatever reason, whether it be while working or eating and hanging out after a day of working or during breaks, I never feel out of my depth socially or even academically even though I am clearly younger and less experienced. The environment and team here, which is made up of scholarly individuals with lots of personality and character, is never judgemental or patronizing; rather it is inviting and the graduate student intern, Noah, and my team leader, Lisa, give off a feeling of mentorship. This has made my internship fun and given me far more of an interest and intent towards pursuing Wildlife Sciences after high school.
Figure 2. A photo taken by Liz today on the cliff as a whale traveled from Tichenor Cove to Mill Rocks. Source: GEMM Lab.
While there have been tedious parts of the internship with a steep learning curve, including asking many questions about whales, and learning to use different programs, tools and methods, it all pays off and comes in handy when the whole focus of the work comes through town – the famous gray whales. During this field season we have been having low whale sightings for the first 4 weeks (but our sightings are slowly picking up over the last couple days), so the waiting for the grand appearance of a whale can feel eternal. Though, when the red curtains reveal a blow out in the distance headed our way, the feeling of boredom when staring at the ocean is completely forgotten. Suddenly, everyone jumps to action – the theodolite’s position needs to be adjusted as we try to pinpoint where the whale will surface next after its dive.
Figure 3. A zoomed-in photo from the kayak of a gray whale headstanding (a feeding behavior) in Tichenor Cove. Source: E. Kelly.
Recently we have been collecting larger samples of zooplankton when sampling from our research kayak, and the whales have been coming in larger numbers too. Every time I see a whale while I am out on the kayak I am crippled with excitement and adrenaline. There is absolutely nothing like seeing these majestic mammals out and about in their day-to-day lives. I love when I get to see them forage, blow, shark, and even do headstands in the water. When we see them forage in a spot that is not one of our regular zooplankton sampling stations we do some adaptive sampling (sampling at spots where we see whales actively feeding), and so far the whales haven’t lied to me about where the zooplankton is. I’m very curious as to how the whales know where the higher concentrations of zooplankton are, even in low visibility (we have had plenty of that this year too). Nevertheless, they know and aren’t shy about getting what they want.
The only downfall of this internship is that it ends soon. I have thoroughly enjoyed my time with my team and at the field station. This in-the-field experience is one of a kind. Even though I didn’t think I was going to receive this internship, I really wanted it and now that I have had it and am finishing up with it, I am so grateful for the knowledge and experiences I have gained from it and look forward to the opportunities it will further grant me.
By Mattea Holt Colberg, GEMM Lab summer intern, OSU junior
Science is about asking new questions in order to make new discoveries. Starting every investigation with a question, sparked by an observation, is enshrined in the scientific method and pursued by researchers everywhere. Asking questions goes beyond scientific research though; it is the best way to learn new things in any setting.
When I first arrived in Port Orford, I did not know much about gray whales. The extent of my knowledge was that they are large baleen whales that migrate every year and feed on plankton. I did, however, know quite a bit about killer whales. I have been interested in killer whales since I was 5 years old, so I have spent years reading about, watching, and listening to them (my current favorite book about them is Of Orcas and Men, by David Neiwert and I highly recommend it!). I have also had opportunities to research them in the Salish Sea, both on a sailing trip and through the dual-enrollment program Ocean Research College Academy, where I explored how killer whales respond to ambient underwater noise for a small independent project. Knowing more about killer whales than other species has caused killer whales to be the lens through which I approach learning and asking questions about other whales.
Figure 1a. Killer whales traveling in a group in the Salish Sea. Source: ISTOCK.
Figure 1b. A gray whale traveling solo in Tichenor Cove. Source: GEMM Lab.
At first, I was not sure how to apply what I know about killer whales specifically to research on gray whales, since killer whales are toothed whales, while gray whales are baleen whales. There are several differences between toothed whales and baleen whales; toothed whales tend to be more social, occurring in pods or groups, eat larger prey like fish, squid, and seals, and they echolocate. In comparison, baleen whales are less social, eat mostly tiny zooplankton prey, and do not echolocate. Because of these differences, I wanted to learn more about gray whales, so I started asking Lisa questions. Killer whales only sleep with half of their brain at a time, so I asked if gray whales do the same. They do. Killer whales typically travel in stable, long-term matriarchal groups, and I recently learned that gray whales frequently travel alone (though not exclusively). This new knowledge to me led me to ask if gray whales vocalize while traveling. They typically do not. Through asking these questions, and others, I have begun to learn more about gray whales.
Figure 2. Mattea on the tandem research kayak taking a break in between prey sampling. Source: L. Hildebrand.
I am still learning about marine mammal research, and from what I have experienced so far, marine mammal acoustics intrigues me the most. As a child, I developed a general interest in whale vocalizations after hearing recordings of them in museums and aquariums. Then, two years ago, I heard orcas vocalizing in the wild, and I decided I wanted to learn more about their vocalizations as a long-term career goal.
To pursue a career studying marine mammal acoustics, I will need scientific and communication skills that this internship is helping me develop. Sitting on the cliff for hours at a time, sometimes with gray whales swimming in our view-scape and sometimes without, is teaching me the patience and attention needed to review hours of sound recordings with or without vocalizations. Identifying and counting zooplankton most days is teaching me the importance of processing data regularly, so it does not build up or get too confusing, as well as attention to detail and keeping focused. Collecting data from a kayak is teaching me how to assess ocean conditions, keep track of gear, and stay calm when things go wrong. I am also practicing the skill of taking and identifying whale photos, which can be applied to many whale research topics I hope to pursue. Through writing this blog post and discussing the project with Lisa and my fellow interns, I am improving my science communication skills.
Figure 3. Mattea manning the theodolite watching and waiting for a gray whale to show up in our study area. Source: L. Hildebrand.
As an undergraduate student, it can sometimes be difficult to find opportunities to research marine mammals, so I am very grateful for and excited about this internship, both because of the skills it is helping me build and the field work experiences that I enjoy participating in. Another aspect of research this internship is helping me learn about is to ask engaging questions. As I mentioned at the beginning of this post, asking questions is a key element of conducting research. By asking questions about gray whales based on both prior knowledge and new observations, I am practicing this skill, as well as thinking of topics I am curious about and might want to explore in the future. While watching for whales, I have thought of questions such as: How is whale behavior affected by surface conditions? Do gray whales prefer feeding at certain times of the day? Questions like these help me learn about whales, and they keep me excited about research. Thanks to this internship, I can continue working towards my dreams of pursuing similar questions about whales as a career.
What do I mean by impact? There are different ways to measure the impact of science and I bet that the readers of this blog had different ideas pop into their heads when they read the title. My guess is that most ideas were related to the impact factor (IF) of a journal, which acts as a measure of a journal’s impact within its discipline and allows journals to be compared. Recent GEMM Lab graduate and newly minted Dr. Leila Lemos wrote a blog about this topic and I suggest reading it for more detail. In a nutshell though, the higher the IF, the more prestigious and impactful the journal. It is unsurprising that scientists found a way to measure our impact on the broader scientific community quantitatively.
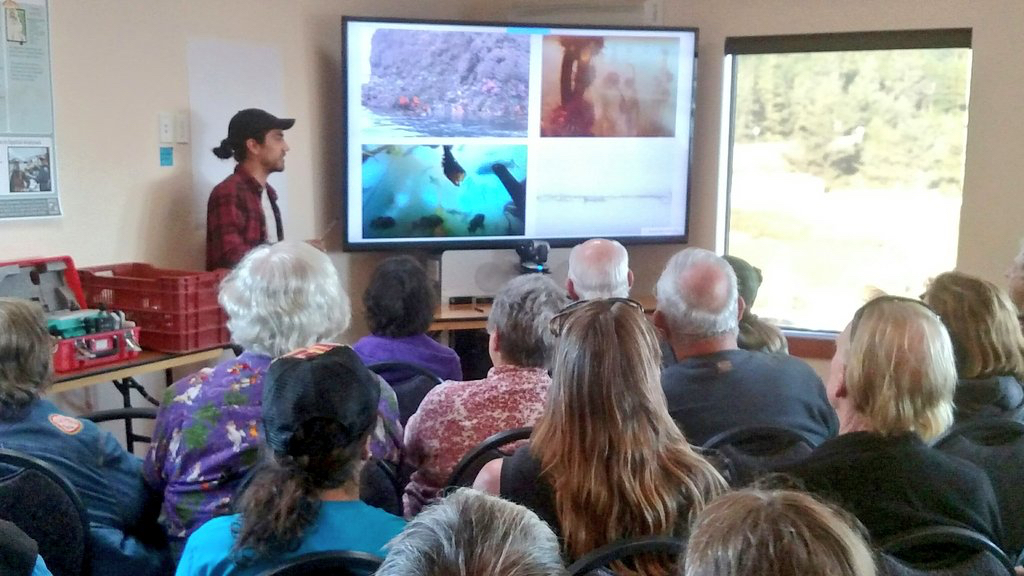
However, IFs are not the impact I was referring to in my title. The impact I am talking about is arguably much harder to measure because you can’t easily put a number on it. I am talking about the impact we have on communities and individuals through outreach and engagement. The GEMM Lab’s Port Orford gray whale ecology project, which I lead, is going into its 6th consecutive year of summer field work this year. Outreach and engagement are two core components of the project that I have become very invested in since I started in 2018. And so, since we are only one week away from the field season commencing (yes, somehow it’s mid-July already…), for this week’s blog I have decided to reflect on what scientific outreach and engagement is, how we have tried to do both in Port Orford, and some of the associated highs and lows.
2018 team member Dylan presenting at the Port Orford community presentation. Source: T. Calvanese.
I think almost everyone in the scientific community would agree that outreach and engagement are important and that we should strive to interact frequently with the public to be transparent and build public trust, as well as to enable mutual learning. However, in my opinion, most scientists rarely put in the work needed to actually reach out to, and engage with, the community. Outreach and engagement have become buzzwords that are often thrown around, and with some hand-waving, can create the illusion that scientists are doing solid outreach and engagement work. For some, the words are probably even used interchangeably, which isn’t correct as they mean two different things.
Outreach and engagement should be thought of as occurring on two different ends of a spectrum. Outreach occurs in a one-way direction. Examples of outreach are public seminars delivered by a scientist (like Hatfield’s monthly Science on Tap) or fairs where the public is invited to come and talk to different scientific entities at their respective booths (like Hatfield’s annual Marine Science Day). Outreach is a way for scientists to disseminate their research to the public and often do not warrant the umbrella term engagement, as these “conversations” are not two-way. Engagement is collaborative and refers to intentional interactions where both sides (public and scientist) share and receive. It goes beyond a scientist telling the public about what they have been doing, but also requires the scientist to listen, absorb, and implement what the views from the ‘other side’ are.
2015 team tracking a whale on Graveyard Point above the port of Port Orford. Source: F. Sullivan.
Now that I have (hopefully) clarified the distinction between the two terms, I am going to shift the focus to specifically talk about the Port Orford project. Before I do, I would like to emphasize that I do not think our outreach and engagement is the be-all and end-all. There is definitely room for improvement and growth, but I do believe that we actively work hard to do both and to center these aspects within the project, rather than doing it as an afterthought to tick a box.
In talking about outreach and engagement, I have been using the words ‘public’ and ‘community’. I think these words conjure an image of a big group of people, an entire town, county, state or even nation. While this can be the case, it can also refer to smaller groups of people, even individuals. The outreach we conduct for the Port Orford project certainly occurs at the town-level. At the end of every field season, we give a community presentation where the field team and Leigh present new findings and give a recount of the field season. In the past, various teams have also given talks at the Humbug Mountain Campground and at Redfish Rocks Community Team events. These events, especially the community presentation, have been packed to the brim every year, which shows the community’s interest for the gray whales and our research. In fact, Tom Calvanese, the OSU Port Orford Field Station manager, has shared with me that now in early summer, Port Orford residents ask him when the ‘whale team’ is returning. I believe that our project has perhaps shifted the perception the local community has of scientists a little bit. Although in our first year or two of the project we may have been viewed as nosy outsiders, I feel that now we are almost honorary members within the community.
A packed room at the 2017 Port Orford community presentation. Photo: GEMM Lab.
Our outreach is not just isolated to one or two public talks per field season though. We have been close collaborators with South Coast Tours (SCT), an adventure tour company headed by Dave Lacey, since the start of the project. During the summer, SCT has almost daily kayak and fishing tours (this year, boat tours too!) out of Port Orford. The paddle routes of SCT and our kayak team will typically intersect in Tichenor’s Cove around mid-morning. When this happens, we form a little kayak fleet with the tour and research kayaks and our kayak team gives a short, informal talk about our research. We often pass around samples of zooplankton we just collected and answer questions that many of the paddlers have. These casual interactions are a highlight to the guests on SCT’s tours (Dave’s words, not mine) and they also provide an opportunity for the project’s interns to practice their science communication skills in a ‘low-stakes’ setting.
The nature of our engagement is more at the individual-level. Since the project’s conception in 2015, the team has been composed of some combination of 4-5 students, be it high school, undergraduate or graduate students. Aside from Florence Sullivan and myself as the GEMM Lab graduate student project leads, in total, we have had 16 students participate in the program, of which 4 were high school students (two from Port Orford’s Pacific High School and two from Astoria High School), 11 OSU and Lawrence University undergraduates, and 1 Duke University graduate student. This year we will be adding 3 more to the total tally (1 Pacific High School student, 1 OSU undergrad, and 1 graduate student from the Vrije Universiteit Brussel in Belgium). I am the first to admit that our yearly (and total) numbers of ‘impacted’ students is small. Limitations of funding and also general logistics of coordinating a large group of interns to participate in field work prevent us from having a larger cohort participate in the field season every summer. However, the impact on each of these students is huge.
The 2019 team with Dave Lacey who instructed our kayak paddle & safety course. Photo: L. Hildebrand.
If I had to pick one word to describe the 6-week Port Orford field season, it would be ‘intense’. The word is perfect because it can simultaneously describe something positive and negative, and the Port Orford field season definitely has elements of both. Both as a team and as individuals we experience incredible high points (an example being last year when we saw Port Orford’s favorite whale ‘Buttons’ breach multiple times on several different days), but we also have pretty low points (I’m thinking of a day in 2018 when two of my interns tried incredibly hard to get our GoPro stick dislodged from a rocky crevice for over 1-hour before radioing me to tell me they couldn’t retrieve it). These highs and lows occur on top of the team’s slowly depleting levels of energy as the field season goes on; with every day we get up at 5:30 am and we get a little more exhausted. The work requires a lot of brain power, a lot of muscle, and a lot of teamwork. Like I said, it’s intense and that’s coming from someone who had several years of marine mammal field work experience before running this project for the first time in 2018. The majority of the interns who have participated in our project have had no marine mammal field experience, some have had no field experience at all. It’s double, if not triple, intense for the interns!
I ask a lot of my interns. I am aware of that. It has been a steep learning curve for me since I took on the project in 2018. I’ve had to adjust my expectations and remember not to measure the performance of my interns against my own. I can always give 110% during the field season, even when I’m exhausted, because the stakes are high for me. After all, the data that is being collected feeds straight into my thesis. However, it took me a while to realize that the stakes, and therefore the motivation, aren’t the same for my interns as they are for me. And so, expecting them to perform at the same level I am, is unfair. I believe I have grown a lot since running that first field season. I have taken the feedback from interns to heart and tried to make adjustments accordingly. While those adjustments were hard because it ultimately meant making compromises that affected the amount of data collected, I recognize and respect the need to make those adjustments. I am incredibly grateful to all of the interns, including the ones that participated before my leadership of the project, who really gave it their all to collect the data that I now get to dig into and draw conclusions from.
2016 interns Kelli and Catherine paddling to a kayak sampling station. Photo: F. Sullivan.
But, as I said before, engagement is not one-sided, and I am not the only one who benefits from having interns participate in the project. The interns themselves learn a wealth of skills that are valuable for the future. Some of these skills are very STEM (Science, Technology, Engineering & Mathematics) specific (e.g. identifying zooplankton with a microscope, tracking whales with a theodolite), but a lot of them are transferrable to non-STEM futures (e.g. attention to detail and concentration required for identifying zooplankton, team work, effective communication). Our reach may be small with this project but the impact that participating in our internship has on each intern is a big one. Three of our four high school interns have gone on to start college. One plans to major in Marine Studies (in part a result of participating in this internship) while another decided to go to college to study Biology because of this internship. Several of the undergraduate students that participated in the 2015, 2016, 2017 & 2018 field seasons have gone on to start Master’s degrees at graduate schools around the country (3 of which have already graduated from their programs). A 2015 intern now teaches middle school in Washington and a 2016 intern is working with Oceans Initiative on their southern resident killer whale project this summer. Leigh, Florence and I have written many letters of recommendations for our interns, and these letters were not written out of duty, but out of conviction.
I love working closely with students and watching them grow. For the last two years, my proudest moment has always been watching my interns present our research at the annual community presentation we give at the end of the field season in Port Orford. No matter the amount of lows and struggles I experienced throughout the season, I watch my interns and my face almost hurts because of the huge smile on my face. The interns truly undergo a transformation where at the start of the season they are shy or feel inadequate and awkward when talking to the public about gray whales and the methods we employ to study them. But on that final day, there is so much confidence and eloquence with which the interns talk about their internship, that they are oftentimes even comfortable enough to crack jokes and share personal stories with the audience. As I said before, engagement of this nature is hard to measure and put a number on. Our statistic (engaging with 16 students) makes it sound like a small impact, but when you dig into what these engagements have meant for each student, the impact is enormous.
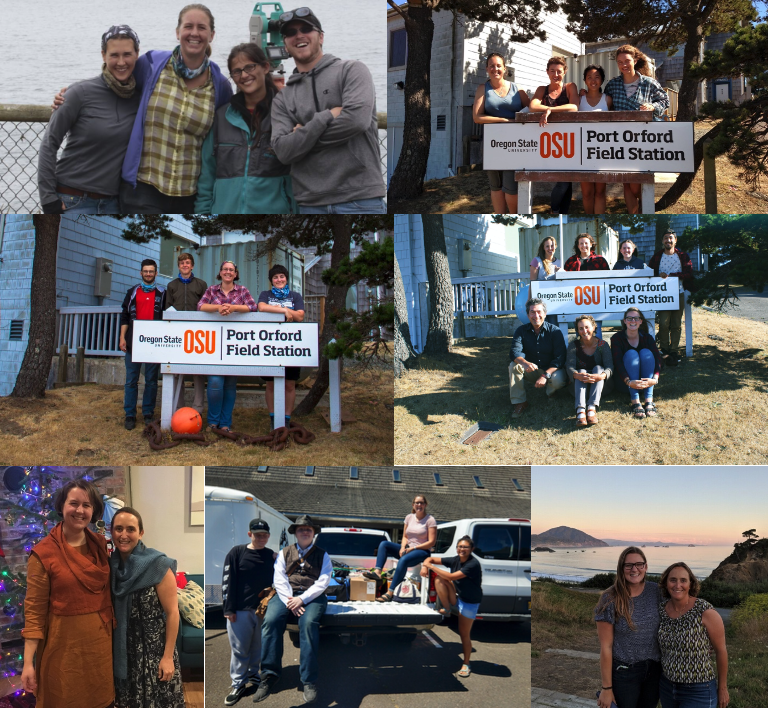
All of the past PO gray whale ecology teams, from left to right: 2015 (Sarah, Florence, Cricket, Justin), 2016 (Florence, Kelli, Catherine, Cathryn), 2017 (Nathan, Quince, Florence, Morgan), 2018 (Haley, Robyn, Hayleigh, Dylan, Lisa), and 2019 (Anthony, Donovan, Lisa, Mia). Bottom left: Florence and Leigh; bottom right: Lisa and Leigh.
I treasure my 6 weeks in Port Orford. Even though they are intense and there are new challenges every year, they bring me a lot of happiness. And it’s only in part because I get to see gray whales and kayak on an (almost) daily basis. A large part is because of the bonds I have formed and continue to cultivate with Port Orford locals, the leaps and bounds I know the interns will make, and the fact that the gray whales, completely unknowingly, bring together a small group of students and a community every year.
If you feel like taking a trip down memory lane, below are the links of the blogs written by previous PO interns:
Every two years, an international community of scientists, managers, policy-makers, educators, and students gather to share the most current research and most pressing conservation issues facing marine mammals. This year, the World Marine Mammal Conference will take place in Barcelona, Spain from December 7-12, and the whole GEMM Lab will make their way across the Atlantic to present their latest work. The meeting is an international gathering of scientists ranging from longtime researchers who have shaped the field throughout the course of their careers to students who are just beginning to carve out a niche of their own. This year’s conference has 2,500 registered attendees from 95 different countries, 1,960 abstract submissions, and 700 accepted oral and speed talks and 1,200 posters. Needless to say, it is an incredible platform for learning, networking, and putting our work in the context of research taking place around the globe.
This will be
my third time at this conference. I attended in San Francisco in 2015 as a
wide-eyed undergraduate and met with Leigh, who I hoped would soon become my
graduate advisor. I also presented my Masters research at the conference in
Halifax in 2017. This time around, I will be presenting findings from the first
two chapters of my PhD. Looking ahead to the Barcelona 2019 meeting and having
some sense of what to expect, I feel butterflies rising in my stomach—a perfect
mixture of the nerves that come with putting your hard work out in the world,
eagerness to learn and absorb new information, and excitement to reconnect with
friends and colleagues from around the world. In short, I can’t wait!
For those of
you reading this blog that are unable to attend, I’d like to share an overview of
what the GEMM Lab will be presenting at the conference. If you will be in
Barcelona, we warmly invite you to the following posters, speed talks, and oral
presentations! In order of appearance:
Lisa Hildebrand, MS Student
What do Oregon gray whales like to eat? Do individual whales have individual foraging habits? To learn more visit Lisa Hildebrand’s poster “Investigating potential gray whale individual foraging specializations within the Pacific Coast Feeding Group”. (Poster presentation,Session: Foraging Ecology – Group A, Time: Monday, 1:30-3:00pm)
Todd Chandler, Faculty Research Assistant
Did you know it is possible to measure the mechanics of how
a blue whale feeds using a drone? The GEMM Lab’s all-star drone pilot Todd Chandler will present a poster titled
“More than snacks: An analysis of drone observed blue whale surface lunge feeding
linked with prey data”. (Poster
presentation,Session: Foraging
Ecology – Group A, Time: Monday, 1:30-3:00pm)
Clara Bird, MS Student
The GEMM Lab’s newest student Clara Bird will present a poster on work she conducted with the Marine Robotics and Remote Sensing lab at Duke University using new technologies and approaches to investigate scarring patterns on humpbacks. Her poster is titled “A comparison of percent dorsal scar cover between populations of humpback whales (Megaptera novaeangliae) off California and the Western Antarctic Peninsula”. (Poster presentation,Session: New Technology – Group B, Time: Tuesday, 8:30-9:45am)
Dr. Leigh Torres, Principal Investigator
GEMM Lab PI Leigh Torres will
synthesize some exciting new analyses from the GEMM Lab’s gray whale physiology
and ecology research off the Oregon Coast. Is it stressful to feed in a noisy
coastal environment? Leigh will discuss the latest findings in her talk, “Sounds
of stress: Evaluating the relationships between variable soundscapes and gray
whale stress hormones”. (Oral
presentation,Session: Physiology,
Time: Tuesday, 11:30-11:45am)
Leila Lemos, PhD Student
Carrying on with exciting new findings about Oregon gray
whales, Leila Lemos will
present a speed talk titled “Stressed and slim or relaxed and chubby? A
simultaneous assessment of gray whale body condition and hormone variability”,
in which she will summarize three years of analysis of how gray whale health can
be quantified, and how physiology is influenced by ocean conditions. (Speed talk,Session: Physiology, Time: Tuesday, 11:55am-12:m)
Dawn Barlow, PhD Student
Can we predict where blue whales will be using our understanding
of their environment and prey? Can this knowledge be used for effective
conservation? I (Dawn Barlow) will
give a presentation titled “Cloudy with a chance of whales: Forecasting blue
whale occurrence based on tiered, bottom-up models to mitigate industrial impacts”,
which will share our latest findings on how functional ecological relationships
can be modeled in changing ocean conditions. (Oral presentation,Session: Habitat
and Distribution I, Time: Wednesday, 10:15-10:30am)
Dr. Solene Derville, Post-Doctoral Scholar
The GEMM Lab’s most recent graduate Solene Dervillewill present work she has conducted in New Caledonia regarding humpback whale diving and movement patterns around breeding grounds. Her speed talk is titled “Whales of the deep: Horizontal and vertical movements shed light on humpback whale use of critical pelagic habitats in the western South Pacific” (Speed talk,Session: Behavioral Ecology II, Time: Wednesday, 11:35-11:40am)
Dominique Kone, MS Student
Can sea otters make a comeback in Oregon after a long
absence? Dom Kone takes
a comprehensive look at how Oregon coast habitat could support a reintroduced
sea otter population in his speed talk, “An evaluation of the ecological needs
and effects of a potential sea otter reintroduction to Oregon, USA”. (Speed talk,Session: Conservation II, Time: Wednesday, 2:45-2:50pm)
Alexa Kownacki, PhD Student
Alexa Kownacki will share her latest findings on dolphin distribution relative to static and dynamic oceanographic variables in her speed talk titled “The biogeography of common bottlenose dolphins (T. truncatus) of the southwestern USA and Mexico”. (Speed talk,Session: Habitat and Distribution II, Time: Wednesday, 3:35-3:40pm)
Other members of the Marine Mammal Mnstitute who will present their work include: Scott Baker, Debbie Steel, Angie Sremba, Karen Lohman, Daniel Palacios, Bruce Mate, Ladd Irvine, and Robert Pitman. For anyone planning to attend, we look forward to seeing you there! For those who wish to stay tuned from home, keep your eye on the GEMM Lab twitter page for our updates during the conference and follow the conference hashtag #WMMC19, and look forward to future blog posts recapping the experience.
Dr. Leigh Torres, Geospatial Ecology of Marine Megafauna Lab, Marine Mammal Institute, Oregon State University
The GEMM Lab is always active – running field projects, leading outreach events, giving seminars, hosting conferences, analyzing data, mentoring young scientists, oh the list goes on! (Yes, I am a proud lab PI). And, recently we have had a flurry of scientific papers either published or accepted for publication that I want to highlight. These are all great pieces of work that demonstrate our quality work, poignant and applied science, and strong collaborations. For each paper listed below I provide a short explanation of the study and implications. (Those names underlined are GEMM Lab members, and I provided a weblink where available.)
Sullivan, F.A. & Torres, L.G.Assessment of vessel disturbance to gray whales to inform sustainable ecotourism. The Journal of Wildlife Management, doi:10.1002/jwmg.21462.
This project integrated research and outreach regarding gray whale behavioral response to vessels. We simultaneously tracked whales and vessels, and data analysis showed significant differences in gray whale activity budgets when vessels were nearby. Working with stakeholders, we translated these results into community-developed vessel operation guidelines and an informational brochure to help mitigate impacts on whales.
Hann, C., Stelle, L., Szabo, A. & Torres, L. (2018) Obstacles and Opportunities of Using a Mobile App for Marine Mammal Research. ISPRS International Journal of Geo-Information, 7, 169. http://www.mdpi.com/2220-9964/7/5/169
This study demonstrates the strengths (fast and cheap data collection) and weaknesses (spatially biased data) of marine mammal data collected using the mobile app Whale mAPP. We emphasize the need for increased citizen science participation to overcome obstacles, which will enable this data collection method to achieve its great potential.
Barlow, D.R., Torres, L.G., Hodge, K., Steel, D., Baker, C.S., Chandler, T.E., Bott, N., Constantine, R., Double, M.C., Gill, P.C., Glasgow, D., Hamner, R.M., Lilley, C., Ogle, M., Olson, P.A., Peters, C., Stockin, K.A., Tessaglia-Hymes, C.T. & Klinck, H. (in press) Documentation of a New Zealand blue whale population based on multiple lines of evidence. Endangered Species Research. https://doi.org/10.3354/esr00891.
This study used genetics, acoustics, and photo-id to document a new population of blue whales around New Zealand that is genetically isolated, has high year-round residence, and shows limited connectivity to other blue whale populations. This discovery has important implication for population management, especially in the South Taranaki Bight region of New Zealand where the whales forage among industrial activity.
Burnett, J.D., Lemos, L., Barlow, D.R., Wing, M.G., Chandler, T.E. & Torres, L.G. (in press) Estimating morphometric attributes of baleen whales with photogrammetry from small UAS: A case study with blue and gray whales. Marine Mammal Science.
Here we developed methods to measure whale body morphometrics using images captured via Unmanned Aerial Systems (UAS; ‘drones’). The paper presents three freely available analysis programs and a protocol to help the community standardize methods, assess and minimize error, and compare data between studies.
Holdman, A.K., Haxel, J.H., Klinck, H. & Torres, L.G. (in press) Acoustic monitoring reveals the times and tides of harbor porpoise distribution off central Oregon, USA. Marine Mammal Science.
Right off the Newport, Oregon harbor entrance we listened for harbor porpoises at two locations using hydrophones. We found that porpoise presence at the shallow rocky reef site corresponds with the ebb tidal phase, while harbor porpoise presence at the deeper site with sandy bottom was associated with night-time foraging. It appears that harbor porpoise change their spatial and temporal patterns of habitat use to increase their foraging efficiency.
Derville, S., Torres, L.G., Iovan, C. & Garrigue, C. (in press) Finding the right fit: Comparative cetacean distribution models using multiple data sources. Diversity and Distributions.
Species distribution models (SDM) are used widely to understand the drivers of cetacean distribution patterns, and to predict their space-use patterns too. Using humpback whale sighting datasets in New Caledonia, this study explores the performance of different SDM algorithms (GAM, BRT, MAXENT, GLM, SVM) and methods of modeling presence-only data. We highlight the importance of controlling for model overfitting and thorough model validation.
Bishop, A.M., Brown, C., Rehberg, M., Torres, L.G. & Horning, M. (in press) Juvenile Steller sea lion (Eumetopias jubatus) utilization distributions in the Gulf of Alaska. Movement Ecology.
This study examines the distribution patterns of juvenile Steller sea lions in the Gulf of Alaska to gain a better understanding of the habitat needs of this vulnerable demographic group within a threatened population. Utilization distributions were derived for 84 tagged sea lions, which showed sex, seasonal and spatial differences. This information will support the development of a species recovery plan.
This comic seemed appropriate here. Thanks for everyone’s hard work!
By Alexa Kownacki, Ph.D. Student, OSU Department of Fisheries and Wildlife, Geospatial Ecology of Marine Megafauna Lab
I love maps. I love charts. As a random bit of trivia, there is a difference between a map and a chart. A map is a visual representation of land that may include details like topology, whereas a chart refers to nautical information such as water depth, shoreline, tides, and obstructions.
Map of San Diego, CA, USA. (Source: San Diego Metropolitan Transit System)
Chart of San Diego, CA, USA. (Source: NOAA)
I have an intense affinity for visually displaying information. As a child, my dad traveled constantly, from Barrow, Alaska to Istanbul, Turkey. Immediately upon his return, I would grab our standing globe from the dining room and our stack of atlases from the coffee table. I would sit at the kitchen table, enthralled at the stories of his travels. Yet, a story was only great when I could picture it for myself. (I should remind you, this was the early 1990s, GoogleMaps wasn’t a thing.) Our kitchen table transformed into a scene from Master and Commander—except, instead of nautical charts and compasses, we had an atlas the size of an overgrown toddler and salt and pepper shakers to pinpoint locations. I now had the world at my fingertips. My dad would show me the paths he took from our home to his various destinations and tell me about the topography, the demographics, the population, the terrain type—all attribute features that could be included in common-day geographic information systems (GIS).
Uncle Brian showing Alexa where they were on a map of Maui, Hawaii, USA. (Photo: Susan K. circa 1995)
As I got older, the kitchen table slowly began to resemble what I imagine the set from Master and Commander actually looked like; nautical charts, tide tables, and wind predictions were piled high and the salt and pepper shakers were replaced with pencil marks indicating potential routes for us to travel via sailboat. The two of us were in our element. Surrounded by visual and graphical representations of geographic and spatial information: maps. To put my map-attraction this in even more context, this is a scientist who grew up playing “Take-Off”, a board game that was “designed to teach geography” and involved flying your fleet of planes across a Mercator projection-style mapboard. Now, it’s no wonder that I’m a graduate student in a lab that focuses on the geospatial aspects of ecology.
A precocious 3-year-old Alexa, sitting with the airplane pilot asking him a long list of travel-related questions (and taking his captain’s hat). Photo: Susan K.
So why and how did geospatial ecology became a field—and a predominant one at that? It wasn’t that one day a lightbulb went off and a statistician decided to draw out the results. It was a progression, built upon for thousands of years. There are maps dating back to 2300 B.C. on Babylonian clay tablets (The British Museum), and yet, some of the maps we make today require highly sophisticated technology. Geospatial analysis is dynamic. It’s evolving. Today I’m using ArcGIS software to interpolate mass amounts of publicly-available sea surface temperature satellite data from 1981-2015, which I will overlay with a layer of bottlenose dolphin sightings during the same time period for comparison. Tomorrow, there might be a new version of software that allows me to animate these data. Heck, it might already exist and I’m not aware of it. This growth is the beauty of this field. Geospatial ecology is made for us cartophiles (map-lovers) who study the interdependency of biological systems where location and distance between things matters.
Alexa’s grandmother showing Alexa (a very young cartographer) how to color in the lines. Source: Susan K. circa 1994
In a broader context, geospatial ecology communicates our science to all of you. If I posted a bunch of statistical outputs in text or even table form, your eyes might glaze over…and so might mine. But, if I displayed that same underlying data and results on a beautiful map with color-coded symbology, a legend, a compass rose, and a scale bar, you might have this great “ah-ha!” moment. That is my goal. That is what geospatial ecology is to me. It’s a way to SHOW my science, rather than TELL it.
Would you like to see this over and over again…?
A VERY small glimpse into the enormous amount of data that went into this map. This screenshot gave me one point of temperature data for a single location for a single day…Source: Alexa K.
Or see this once…?
Map made in ArcGIS of Coastal common bottlenose dolphin sightings between 1981-1989 with a layer of average sea surface temperatures interpolated across those same years. A picture really is worth a thousand words…or at least a thousand data points…Source: Alexa K.
For many, maps are visually easy to interpret, allowing quick message communication. Yet, there are many different learning styles. From my personal story, I think it’s relatively obvious that I’m, at least partially, a visual learner. When I was in primary school, I would read the directions thoroughly, but only truly absorb the material once the teacher showed me an example. Set up an experiment? Sure, I’ll read the lab report, but I’m going to refer to the diagrams of the set-up constantly. To this day, I always ask for an example. Teach me a new game? Let’s play the first round and then I’ll pick it up. It’s how I learned to sail. My dad described every part of the sailboat in detail and all I heard was words. Then, my dad showed me how to sail, and it came naturally. It’s only as an adult that I know what “that blue line thingy” is called. Geospatial ecology is how I SEE my research. It makes sense to me. And, hopefully, it makes sense to some of you!
Alexa’s dad teaching her how to sail. (Source: Susan K. circa 2000)
Alexa’s first solo sailboat race in Coronado, San Diego, CA. Notice: Alexa’s dad pushing the bow off the dock and the look on Alexa’s face. (Source: Susan K. circa 2000)
Alexa mapping data using ArcGIS in the Oregon State University Library. (Source: Alexa K circa a few minutes prior to posting).
I strongly believe a meaningful career allows you to highlight your passions and personal strengths. For me, that means photography, all things nautical, the great outdoors, wildlife conservation, and maps/charts. If I converted that into an equation, I think this is a likely result:
This lab was my solution all along. As part of my research on common bottlenose dolphins, I work on a small inflatable boat off the coast of California (nautical ✅, outdoors ✅), photograph their dorsal fin (photography ✅), and communicate my data using informative maps that will hopefully bring positive change to the marine environment (maps/charts ✅, wildlife conservation✅). Geospatial ecology allows me to participate in research that I deeply enjoy and hopefully, will make the world a little bit of a better place. Oh, and make maps.
Alexa in the field, putting all those years of sailing and chart-reading to use! (Source: Leila L.)
By Alexa Kownacki, Ph.D. Student, OSU Department of Fisheries and Wildlife, Geospatial Ecology of Marine Megafauna Lab
How do you create the perfect chemical formula for social media in science? (Photo Source: The Royal Society of Victoria)
There’s a never-ending debate about how active we, as scientists, should be on social media. Which social media platforms are best for communicating our science? When it comes to posting, how much is too much? Should we post a few, critical items that are highly pertinent, or push out everything that’s even closely related to our focus? Personally, my deep-rooted question revolves around privacy. What aspects of my life (and thereby my science), do I keep to myself and what do I share? I asked that exact question at a workshop last year, and I have some main takeaways.
At last year’s Southern California Marine Mammal Workshop, there was a very informative session about the role of media in science. More specifically, there was a talk on “Social Media and Communications Hot Topics” by Susan Poulton, the Chief Digital Officer of the Franklin Institute science museum in Philadelphia. She emphasized how trust factors into our media connections and networks. What was once communicated in person or on paper, has given way to this idea of virtual connections. We all have our own “bubbles”. Susan defined “bubbles” as the people who we trust. We have different classifications of bubbles: the immediate bubble that consists of our friends, family, and close colleagues, the more distant bubble that has your friends of friends and distant colleagues, and the enigma bubble that has people you find based on computer algorithms that the computer thinks you’ll find relative. Susan brought up the point that many of us stay within our immediate bubble; even though we may discuss all of the groundbreaking science with our friends and coworkers, we never burst that bubble and expand the reaches of our science into the enigma bubble. I frequently fall into this category both intentionally and unintentionally.
Coworkers from NOAA’s Southwest Fisheries Science Center attending the Southern California Marine Mammal Workshop 2017. Pictured from left to right: Alexa, Michelle, Holly, and Keiko. (Photo source: Michelle Robbins.)
Many of us want to be advocates for our science. Education and outreach are crucial for communicating our message. We know this. But, can we keep what little personal life we have outside of science, private? The short of the long of it: No. Alisa Schulman-Janiger, another scientist and educator on the panel, reinforced this when she stated that she keeps a large majority of her social media posts as “public” to reach more people. Queue me being shocked. I have a decent social media presence. I have a private Facebook account, but public Twitter and LinkedIn accounts that I use only for science/academics/professional stuff, public Instagram, YouTube, and Flickr accounts that are travel and science-related, as well as a public blog that is a personal look at my life as a scientist who loves to travel. I tell you this because I am still incredibly skeptical about privacy; I keep my Facebook page about as private as possible without it being hidden. Giving up that last bit of my precious, immediate bubble and making it for the world to see feels invasive. But, I’m motivated to make sure my science reaches people who I don’t know. Giving science a personal story is what captures people; it’s why we read those articles in our Facebook feeds, and click on the interesting articles while scrolling through Twitter. Because of this, I’ve begun making more, not all, of my Facebook posts public. I’m more active on Twitter. I’m writing weekly blog posts again (we’ll see how long I can keep that up for). I’m trying to find the right balance that will keep my immediate bubble still private enough for my peace of mind and public enough that I am presenting my science to networks outside of my own—pushing through to the enigma bubble. Bubbles differ for each of us and we have to find our own balance. By playing to the flexibility of our bubbles, we can expand the horizons of our research.
Alexa at an Education/Outreach event, responding to a young student asking, “Why didn’t you bring this seal when it was alive?” (Photo source: Lori Lowder).
This topic was recently broached while attending my first official GEMM Lab meeting. Leigh brought up social media and how we, as a lab, and as individuals, should make an effort to shine light on all the amazing science that we’re a part of. We, as a lab, are trying to be more present. Therefore, in addition to these AMAZING weekly blog posts varying from highly technical to extremely colloquial, the lab will be posting more on Twitter. And that comes to the origin of this week’s blog post’s title. Leigh said that we should be “Twitterific” and I can’t help but feel that adjective perfectly suits our current pursuit. Here’s to being Twitterific!
With all that being said, be sure to follow us on: Twitter, YouTube, and here (don’t forget to follow us by entering your email address on the lefthand side of the page), of course.