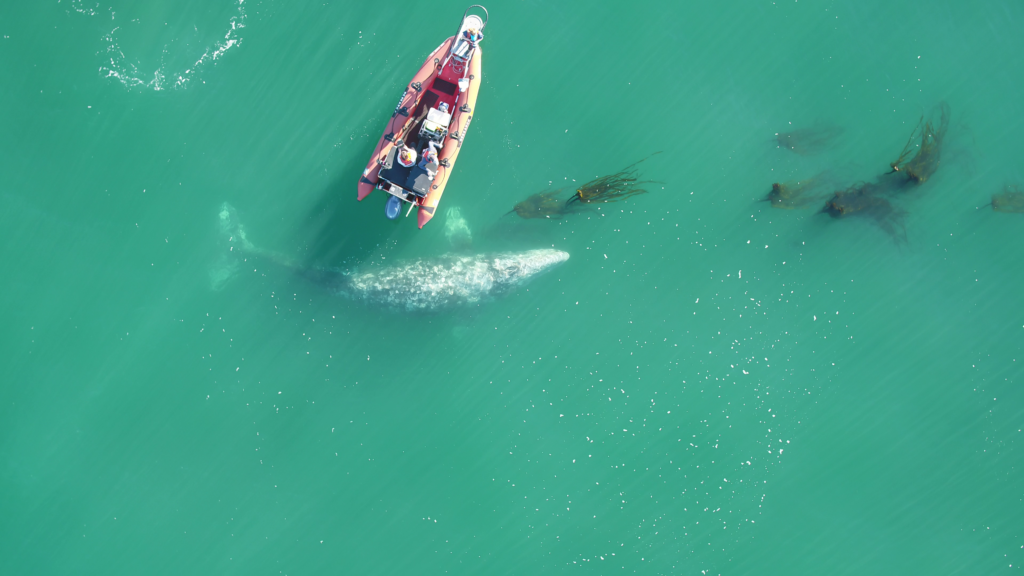
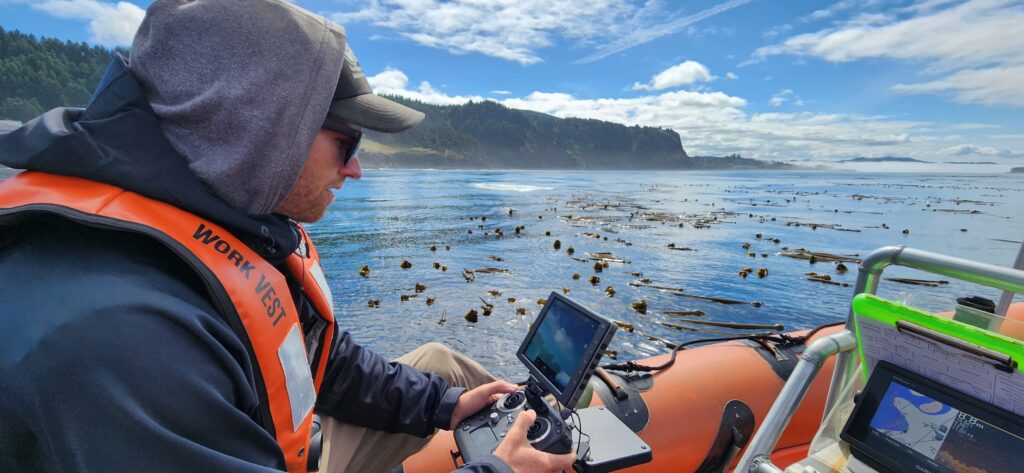
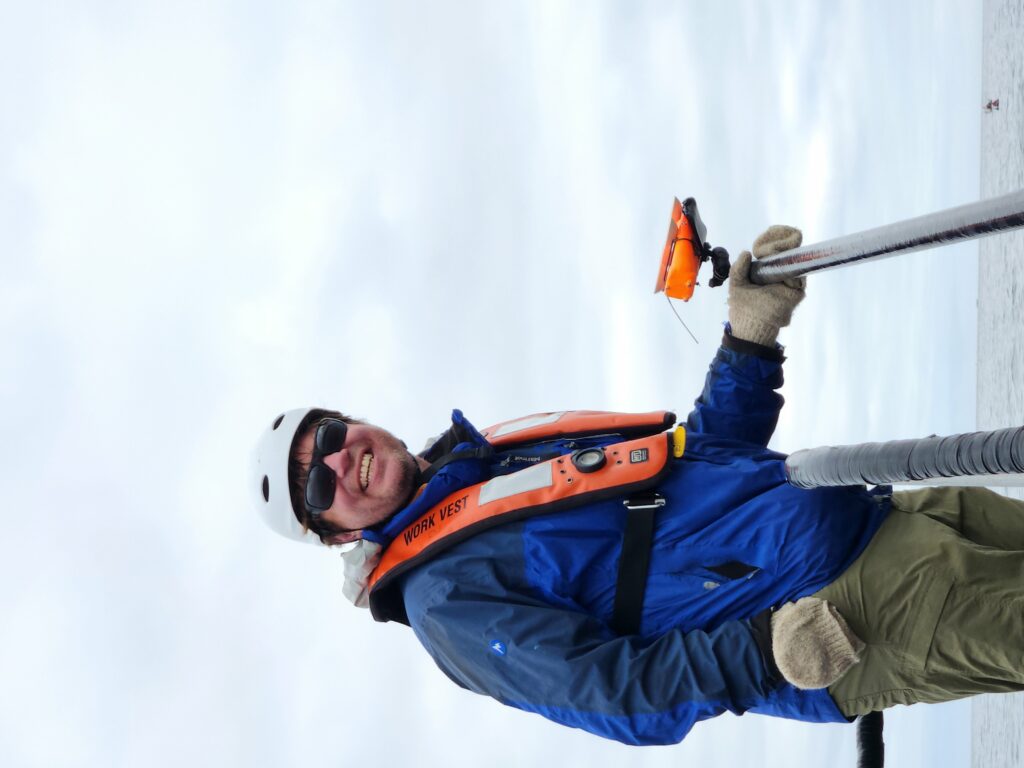
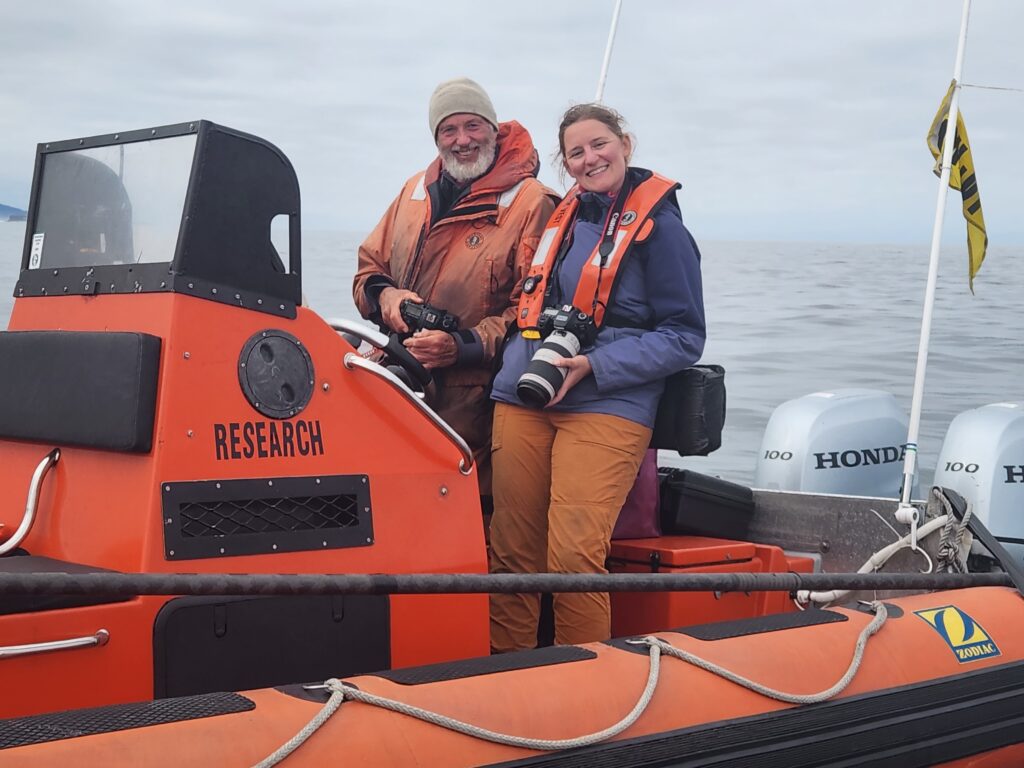
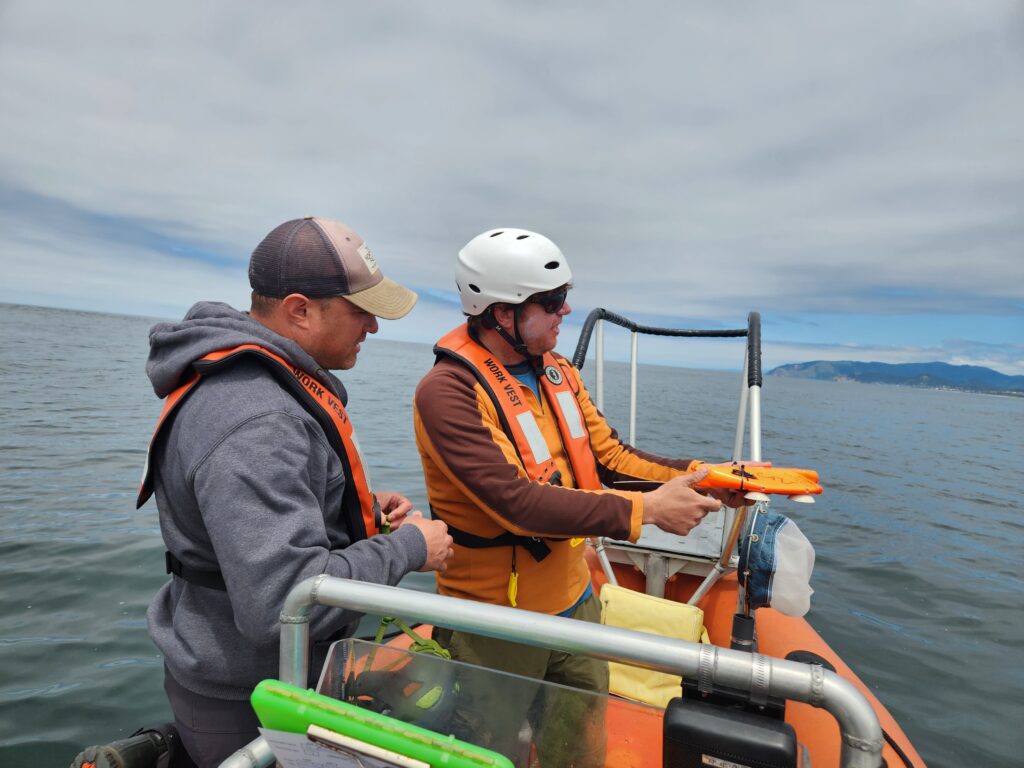
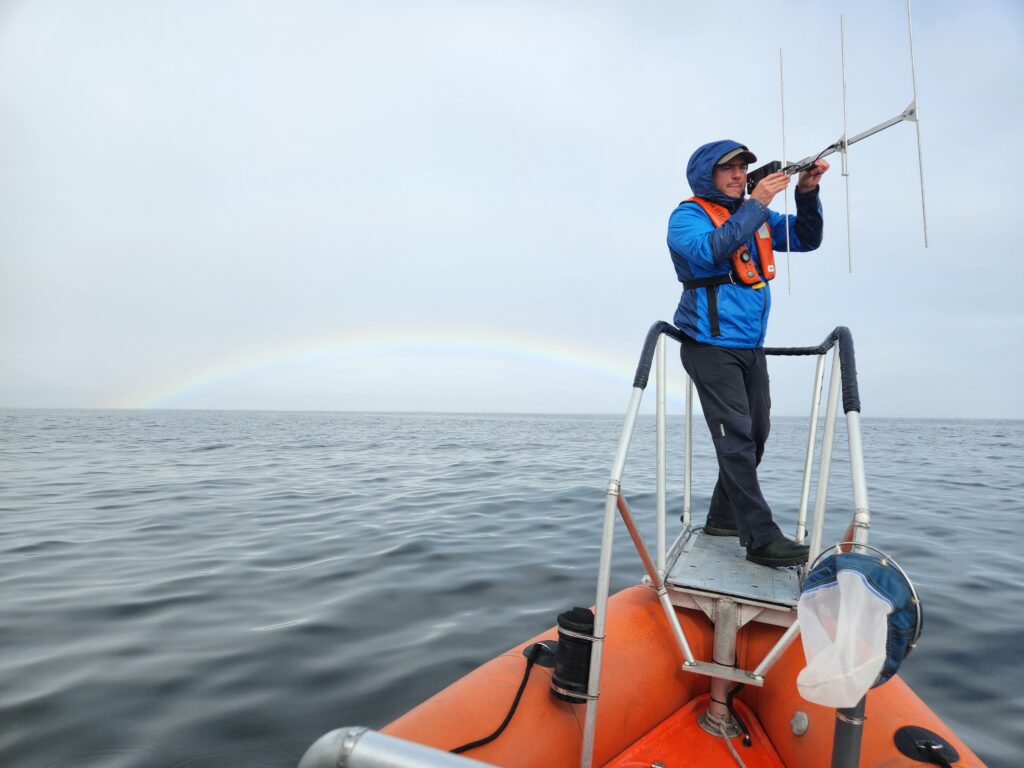
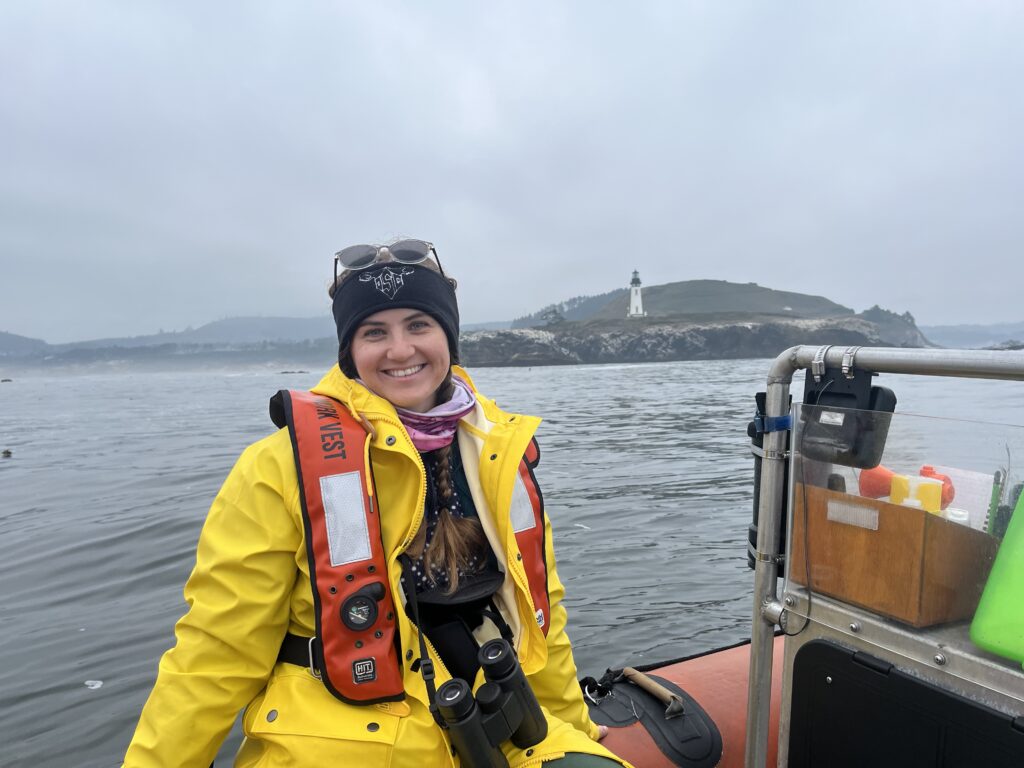
A MOSAIC of species, datasets, tools, and collaborators

By Dr. Dawn Barlow, Postdoctoral Scholar, OSU Department of Fisheries, Wildlife, and Conservation Sciences, Geospatial Ecology of Marine Megafauna Lab

Imagine you are 50 nautical miles from shore, perched on the observation platform of a research vessel. The ocean is blue, calm, and seems—for all intents and purposes—empty. No birds fly overhead, nothing disturbs the rolling swells except the occasional whitecap from a light breeze. The view through your binoculars is excellent, and in the distance, you spot a disturbance at the surface of the water. As the ship gets closer, you see splashing, and a flurry of activity emerges as a large group of dolphins leap and dive, likely chasing a school of fish. They swim along with the ship, riding the bow-wave in a brief break from their activity. Birds circle in the air above them and float on the water around them. Together with your team of observers, you rush to record the species, the number of animals, their distance to the ship, and their behavior. The research vessel carries along its pre-determined trackline, and the feeding frenzy of birds and dolphins fades off behind you as quickly as it came. You return to scanning the blue water.

Craig Hayslip and Dawn Barlow scan for marine mammals from the crow’s nest (elevated observation platform) of the R/V Pacific Storm.

The marine environment is highly dynamic, and resources in the ocean are notoriously patchy. One of our main objectives in marine ecology is to understand what drives these ephemeral hotspots of species diversity and biological activity. This objective is particularly important now as the oceans warm and shift. In the context of rapid global climate change, there is a push to establish alternatives to fossil fuels that can support society’s energy needs while minimizing the carbon emissions that are a root cause of climate change. One emergent option is offshore wind, which has become a hot topic on the West Coast of the United States in recent years. The technology has the potential to supply a clean energy source, but the infrastructure could have environmental and societal impacts of its own, depending on where it is placed, how it is implemented, and when it is operational.

Northern right whale dolphins leap into the air. Photo by Craig Hayslip.

Any development in the marine environment, including alternative energy such as offshore wind, should be undertaken using the best available scientific knowledge of the ecosystem where it will be implemented. The Marine Mammal Institute’s collaborative project, Marine Offshore Species Assessments to Inform Clean energy (MOSAIC), was designed for just this reason. As the name “MOSAIC” implies, it is all about using different tools to compile different datasets to establish crucial baseline information on where marine mammals and seabirds are distributed in Oregon and Northern California, a region of interest for wind energy development.

A MOSAIC of species

The waters of Oregon and Northern California are rich with life. Numerous cetaceans are found here, from the largest species to ever live, the blue whale, to one of the smallest cetaceans, the harbor porpoise, with many species filling in the size range in between: fin whales, humpback whales, sperm whales, killer whales, Risso’s dolphins, Pacific white-sided dolphins, northern right whale dolphins, and Dall’s porpoises, to name a few. Seabirds likewise rely on these productive waters, from the large, graceful albatrosses that feature in maritime legends, to charismatic tufted puffins, to the little Leach’s storm petrels that could fit in the palm of your hand yet cover vast distances at sea. From our data collection efforts so far, we have already documented 16 cetacean species and 64 seabird species.

A Laysan albatross glides over the water’s surface. Photo by Will Kennerley.

A MOSAIC of data and tools

Schematic of the different components of the MOSAIC project. Graphic created by Solene Derville.

Through the four-year MOSAIC project, we are undertaking two years of visual surveys and passive acoustic monitoring from Cape Mendocino to the mouth of the Columbia River on the border of Oregon and Washington and seaward to the continental slope. Six comprehensive surveys for cetaceans and seabirds are being conducted aboard the R/V Pacific Storm following a carefully chosen trackline to cover a variety of habitats, including areas of interest to wind energy developers.

These dedicated surveys are complemented by additional surveys conducted aboard NOAA research vessels during collaborative expeditions in the Northern California Current, and ongoing aerial surveys in partnership with the United States Coast Guard through the GEMM Lab’s OPAL project. Three bottom-mounted hydrophones were deployed in August 2022, and are recording cetacean vocalizations and the ambient soundscape, and these recordings will be complemented by acoustic data that is being collected continuously by the Oceans Observing Initiative. In addition to these methods to collect broad-scale species distribution information, concurrent efforts are being conducted via small boats to collect individual identification photographs of baleen whales and tissue biopsy samples for genetic analysis. Building on the legacy of satellite tracking here at the Marine Mammal Institute, the MOSAIC project is breathing new life into tag data from large whales to assess movement patterns over many years and determine the amount of time spent within our study area.

A curious fin whale approaches the R/V Pacific Storm during one of the visual surveys. Photo by Craig Hayslip.
Survey tracklines extending between the Columbia River and Cape Mendocino, designed for the MOSAIC visual surveys aboard the R/V Pacific Storm.

The resulting species occurrence data from visual surveys and acoustic monitoring will be integrated to develop Species Distribution Models for the many different species in our study region. Identification photographs of individual baleen whales, DNA profiles from whale biopsy samples, and data from satellite-tagged whales will provide detailed insight into whale population structure, behavior, and site fidelity (i.e., how long they typically stay in a given area), which will add important context to the distribution data we collect through the visual surveys and acoustic monitoring. The models will be implemented to produce maps of predicted species occurrence patterns, describing when and where we expect different cetaceans and seabirds to be under different environmental conditions.

With five visual surveys down, the MOSAIC team is gearing up for one final survey this month. The hydrophones will be retrieved this summer. Then, with data in-hand, the team will dive deep into analysis.

A MOSAIC of collaborators

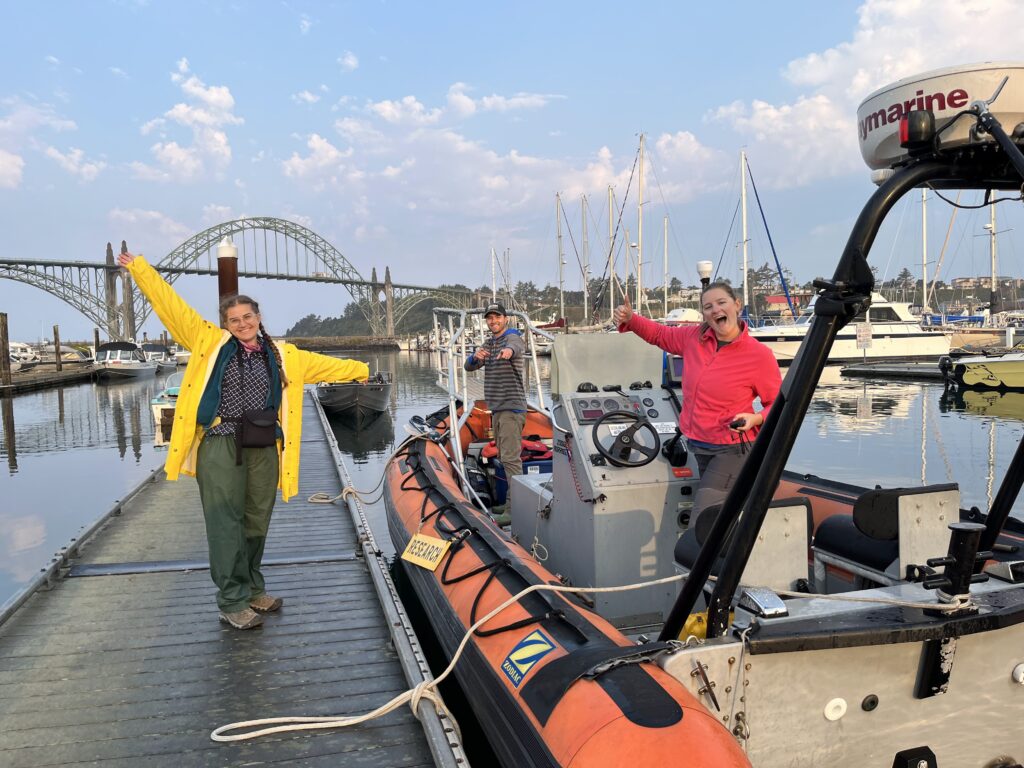
The MOSAIC-4 team waves from the crow’s nest (observation platform) of the R/V Pacific Storm. Photo by Craig Hayslip.

The collaborative MOSAIC team brings together a diverse set of tools. The depth of expertise here at the Marine Mammal Institute spans a broad range of disciplines, well-positioned to provide robust scientific knowledge needed to inform alternative energy development in Oregon and Northern California waters.  

I have had the pleasure of participating in three of the six surveys aboard the R/V Pacific Storm, including leading one as Chief Scientist, and have collected visual survey data aboard NOAA Ship Bell M. Shimada and from United States Coast Guard helicopters over the years that will be incorporated in the MOSAIC of datasets for the project. This ecosystem is one that I feel deeply connected to from time spent in the field. Now, I am thrilled to dive into the analysis, and will lead the modeling of the visual survey data and the integration of the different components to produce species distribution maps for cetaceans and seabirds our study region.

This project is funded by the United States Department of Energy. The Principal Investigator is the Institute’s Director Dr. Lisa Ballance, and Co-Principal Investigators include Scott Baker, Barbara Lagerquist, Rachael Orben, Daniel Palacios, Kate Stafford, and Leigh Torres of the Marine Mammal Institute; John Calambokidis of the Cascadia Research Collective; and Elizabeth Becker of ManTech International Corp. For more information, please visit the project website, and stay tuned for updates as we enter the analysis phase.

Did you enjoy this blog? Want to learn more about marine life, research, and conservation? Subscribe to our blog and get a weekly alert when we make a new post! Just add your name into the subscribe box below!

Loading

An ‘X’travaganza! Introducing the Marine Mammal Institute’s Center of Drone Excellence (CODEX)

Dr. KC Bierlich, Postdoctoral Scholar, OSU Department of Fisheries, Wildlife, & Conservation Sciences, Geospatial Ecology of Marine Megafauna Lab

Drones are becoming more and more prevalent in marine mammal research, particularly for non-invasively obtaining morphological measurements of cetaceans via photogrammetry to identify important health metrics (see this and this previous blog). For example, the GEMM Lab uses drones for the GRANITE Project to study Pacific Coast Feeding Group (PCFG) gray whales and we have found that PCFG whales are skinnier and morphologically shorter with smaller skulls and flukes compared to the larger Eastern North Pacific (ENP) population. The GEMM Lab has also used drones to document variation in body condition across years and within a season, to diagnose pregnancy, and even measure blowholes.

While drone-based photogrammetry can provide major insight into cetacean ecology, several drone systems and protocols are used across the scientific community in these efforts, and no consistent method or centralized framework is established for quantifying and incorporating measurement uncertainty associated with these different drones. This lack of standardization restricts comparability across datasets, thus hindering our ability to effectively monitor populations and understand the drivers of variation (e.g., pollution, climate change, injury, noise).

We are excited to announce the Marine Mammal Institute’s (MMI) Center of Drone Excellence (CODEX), which focuses on developing analytical methods for using drones to non-invasively monitor marine mammal populations. CODEX is led by GEMM Lab member’s KC Bierlich, Leigh Torres, and Clara Bird and consists of other team members within and outside OSU. We draw from many years of trials, errors, headaches, and effort working with drones to study cetacean ecology in a variety of habitats and conditions on many different species.

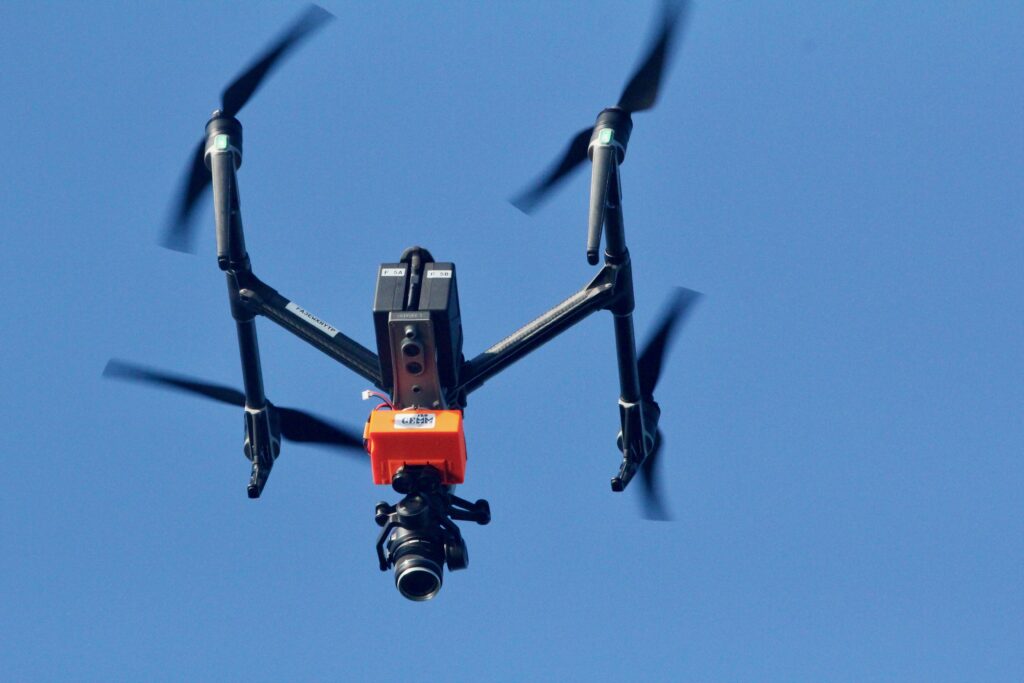
Already CODEX has developed several open-source hardware and software tools. We developed, produced, and published LidarBoX (Bierlich et al., 2023), which is a 3D printed enclosure for a LiDAR altimeter system that can be easily attached and swapped between commercially available drones (i.e., DJI Inspire, DJI Mavic, and DJI Phantom) (Figure 1). Having a LidarBoX installed helps researchers obtain altitude readings with greater accuracy, yielding morphological measurements with less uncertainty. Since we developed LidarBoX, we have received over 35 orders to build this unit for other labs in national and international universities.

Figure 1. A ‘LidarBoX’ attached to a DJI Inspire 2. The LidarBoX is a 3D printed enclosure containing a LiDAR altimeter to help obtain more accurate altitude readings.

Additionally, CODEX recently released MorphoMetriX version 2 (v2), an easy-to-use photogrammetry software that provides users with the flexibility to obtain custom morphological measurements of megafauna in imagery with no knowledge of any scripting language (Torres and Bierlich, 2020). CollatriX is a user-friendly software for collating multiple MorphoMetriX outputs into a single dataframe and linking important metadata to photogrammetric measurements, such as altitude measured with a LidarBoX (Bird and Bierlich, 2020). CollatriX also automatically calculates several body condition metrics based on measurements from MorphoMetriX v2. CollatriX v2 is currently in beta-testing and scheduled to be released late Spring 2024. 

Figure 2. An example of a Pygmy blue whale imported into MorphoMetriX v2, open-source photogrammetry software. 

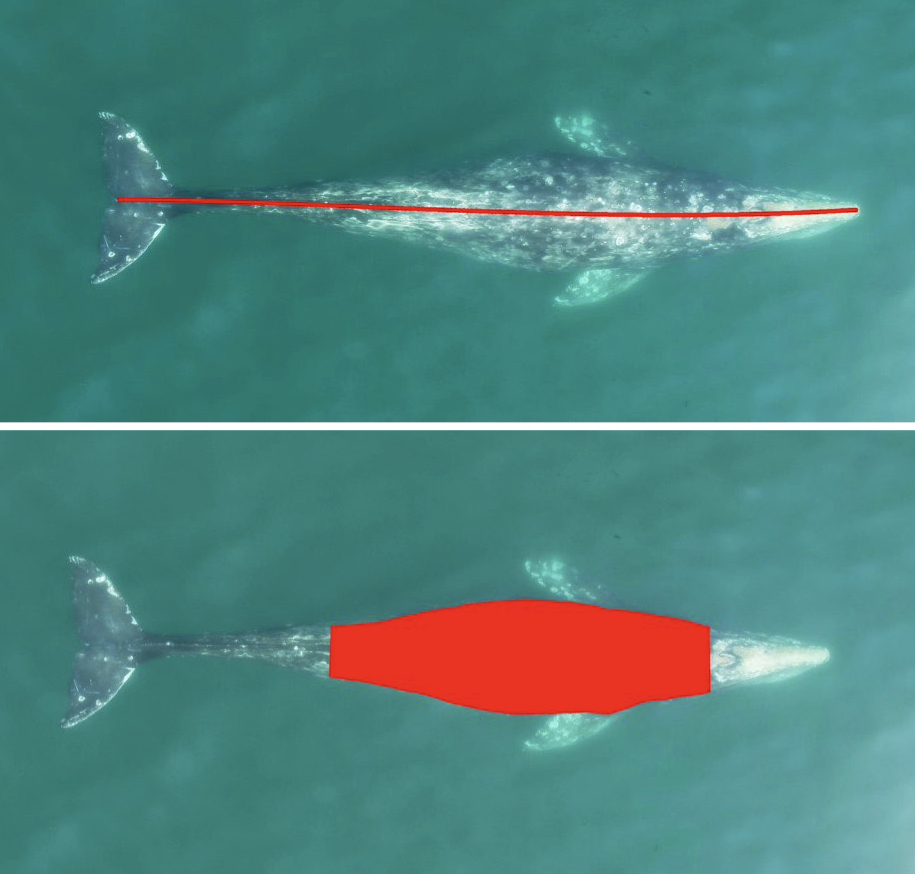
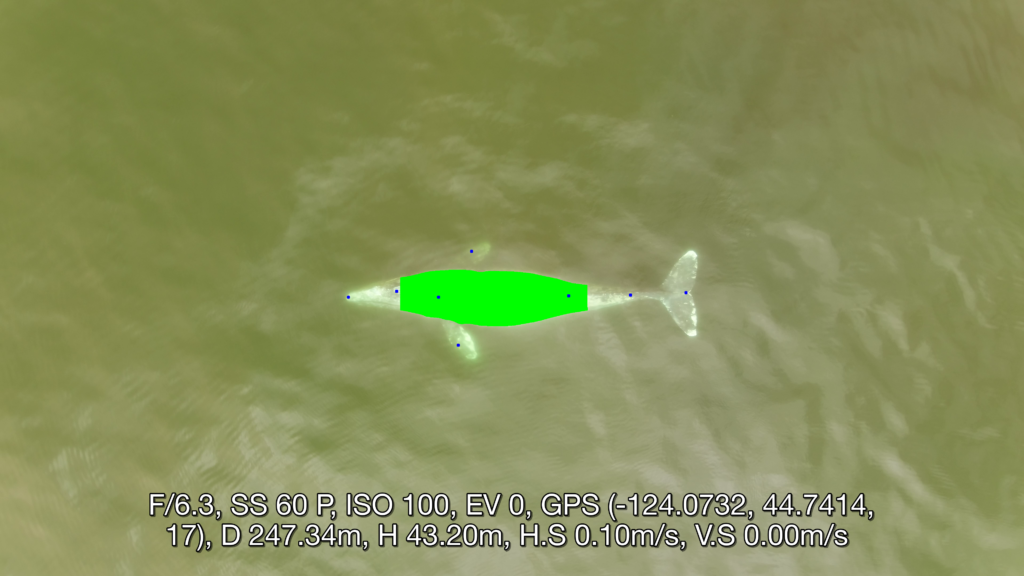
CODEX also recently developed two automated tools to help speed up the laborious manual processing of drone videos for obtaining morphological measurements (Bierlich & Karki et al., in revision). DeteX is a graphical user interface (GUI) that uses a deep learning model for automated detection of cetaceans in drone-based videos. Researchers can input their drone-based videos and DeteX will output frames containing whales at the surface. Users can then select which frames they want to use for measuring individual whales and then input these selected frames into XtraX, which is a GUI that uses a deep learning model to automatically extract body length and body condition measurements of cetaceans (Figure 4). We found automated measurements from XtraX to be similar (within 5%) of manual measurements. Importantly, using DeteX and XtraX takes about 10% of the time it would take to manually process the same videos, demonstrating how these tools greatly speed up obtaining key morphological data while maintaining accuracy, which is critical for effectively monitoring population health.

Figure 3. An example of an automated body length (top) and body condition (bottom) measurement of a gray whale using XtraX (Bierlich & Karki et al., in revision).

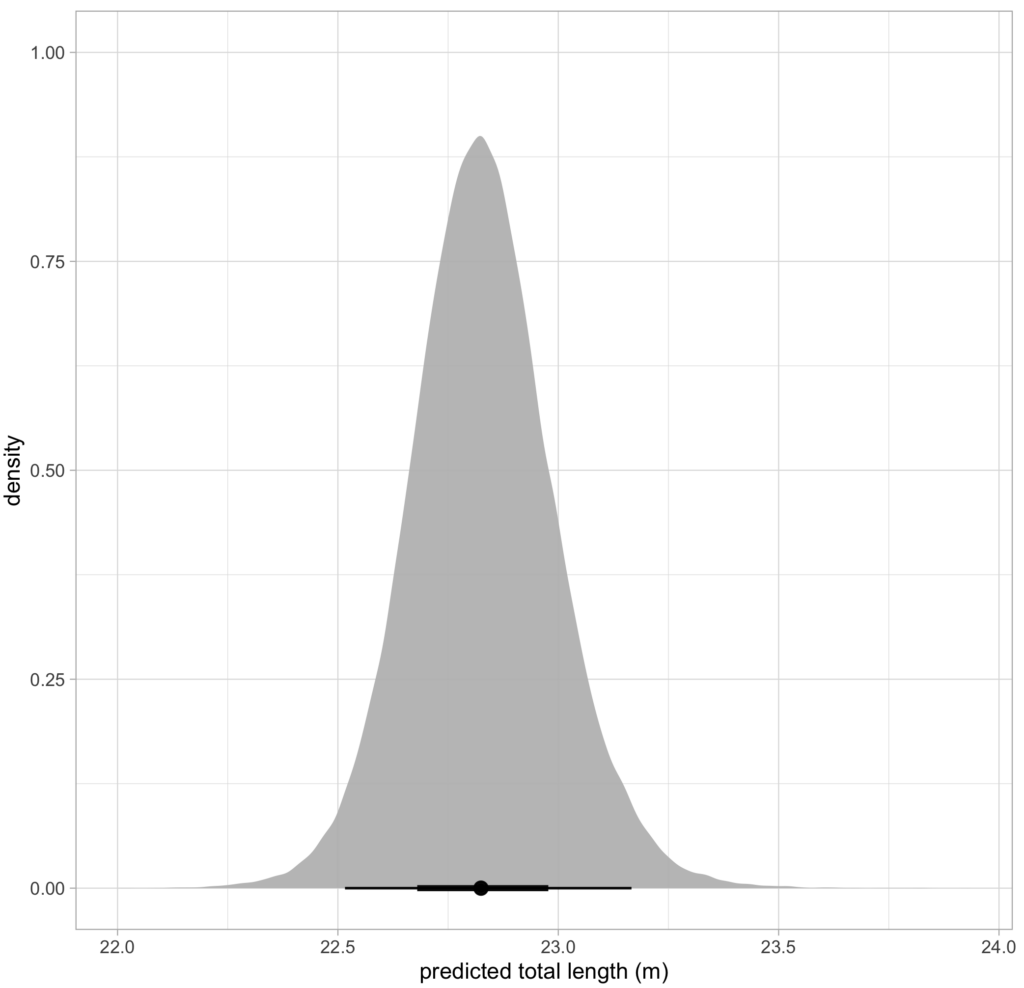
CODEX is also in the process of developing Xcertainty, an R package that uses a Bayesian statistical model to quantify and incorporate uncertainty associated with measurements from different drones (see this blog). Xcertainty is based on the Bayesian statistical model developed by Bierlich et al., (2021b; 2021a), which has been utilized by many studies with several different drones to compare body condition and body morphology across individuals and populations  (Bierlich et al., 2022; Torres et al., 2022; Barlow et al., 2023). Rather than a single point-estimate of a length measurement for an individual, Xcertainty produces a distribution of length measurements for an individual so that the length of a whale can be described by the mean of this distribution, and its uncertainty as the the variance or an interval around the mean (Figure 4). These outputs ensure measurements are robust and comparable across different drones because they provide a measure of the uncertainty around each measurement. For instance, a measurement with more uncertainty will have a wider distribution. The uncertainty associated with each measurement can be incorporated into analyses, which is key when detecting important differences or changes in individuals or populations, such as changes in body condition (blog).

Figure 4. An example of a posterior predictive distribution for total length of an individual blue whale produced by the ‘Xcertainty’ R package. The black bars represent the uncertainty around the mean value (the black dot) – the longer black bars represent the 95% highest posterior density (HPD) interval, and the shorter black bars represent the 65% HPD interval. 

CODEX has integrated all these lessons learned, open-source tools, and analytical approaches into a single framework of suggested best practices to help researchers enhance the quality, speed, and accuracy of obtaining important morphological measurements to manage vulnerable populations. These tools and frameworks are designed to be accommodating and accessible to researchers on various budgets and to facilitate cross-lab collaborations. CODEX plans to host workshops to educate and train researchers using drones on how to apply these tools within this framework within their own research practices. Potential future directions for CODEX include developing a system for using drones to drop suction-cup tags on whales and to collect thermal imagery of whales for health assessments. Stay up to date with all the CODEX ‘X’travaganza here: https://mmi.oregonstate.edu/centers-excellence/codex.  

Huge shout out to Suzie Winquist for designing the artwork for CODEX!

References

Barlow, D.R., Bierlich, K.C., Oestreich, W.K., Chiang, G., Durban, J.W., Goldbogen, J.A., Johnston, D.W., Leslie, M.S., Moore, M.J., Ryan, J.P. and Torres, L.G., 2023. Shaped by Their Environment: Variation in Blue Whale Morphology across Three Productive Coastal Ecosystems. Integrative Organismal Biology, [online] 5(1). https://doi.org/10.1093/iob/obad039.

Bierlich, K., Karki, S., Bird, C.N., Fern, A. and Torres, L.G., n.d. Automated body length and condition measurements of whales from drone videos for rapid assessment of population health. Marine Mammal Science.

Bierlich, K.C., Hewitt, J., Bird, C.N., Schick, R.S., Friedlaender, A., Torres, L.G., Dale, J., Goldbogen, J., Read, A.J., Calambokidis, J. and Johnston, D.W., 2021a. Comparing Uncertainty Associated With 1-, 2-, and 3D Aerial Photogrammetry-Based Body Condition Measurements of Baleen Whales. Frontiers in Marine Science, 8. https://doi.org/10.3389/fmars.2021.749943.

Bierlich, K.C., Hewitt, J., Schick, R.S., Pallin, L., Dale, J., Friedlaender, A.S., Christiansen, F., Sprogis, K.R., Dawn, A.H., Bird, C.N., Larsen, G.D., Nichols, R., Shero, M.R., Goldbogen, J., Read, A.J. and Johnston, D.W., 2022. Seasonal gain in body condition of foraging humpback whales along the Western Antarctic Peninsula. Frontiers in Marine Science, 9(1036860), pp.1–16. https://doi.org/10.3389/fmars.2022.1036860.

Bierlich, K.C., Schick, R.S., Hewitt, J., Dale, J., Goldbogen, J.A., Friedlaender, A.S. and Johnston, D.W., 2021b. Bayesian approach for predicting photogrammetric uncertainty in morphometric measurements derived from drones. Marine Ecology Progress Series, 673, pp.193–210. https://doi.org/10.3354/meps13814.

Bird, C. and Bierlich, K.C., 2020. CollatriX: A GUI to collate MorphoMetriX outputs. Journal of Open Source Software, 5(51), pp.2323–2328. https://doi.org/10.21105/joss.02328.

Torres, L.G., Bird, C.N., Rodríguez-González, F., Christiansen, F., Bejder, L., Lemos, L., Urban R, J., Swartz, S., Willoughby, A., Hewitt, J. and Bierlich, K.C., 2022. Range-Wide Comparison of Gray Whale Body Condition Reveals Contrasting Sub-Population Health Characteristics and Vulnerability to Environmental Change. Frontiers in Marine Science, 9(April), pp.1–13. https://doi.org/10.3389/fmars.2022.867258.

Torres, W. and Bierlich, K.C., 2020. MorphoMetriX: a photogrammetric measurement GUI for morphometric analysis of megafauna. Journal of Open Source Software, 5(45), pp.1825–1826. https://doi.org/10.21105/joss.01825.

Who, where, when: Estimating individual space use patterns of PCFG gray whales

By Lisa Hildebrand, PhD candidate, OSU Department of Fisheries, Wildlife, & Conservation Sciences, Geospatial Ecology of Marine Megafauna Lab

Understanding how baleen whales are affected by human activity is a central goal for many research projects in the GEMM Lab. The overarching goal of the GRANITE (Gray whale Response to Ambient Noise Informed by Technology and Ecology) project is to quantify baleen whale physiological response to different stressors (e.g., boat presence and noise) and model the subsequent impacts of these stressors on the population. We will achieve this goal by implementing our long-term, replicate dataset of Pacific Coast Feeding Group (PCFG) gray whales into a framework called population consequences of disturbance (PCoD). I will not go into the details of PCoD in this blog (but I wrote a post a few years ago that you can revisit). Instead, I will explain the approach I am taking to assess where and when individual whales spend time in our study area, which will form an essential component of PCoD and be one of the chapters of my PhD dissertation.

Individuals in a population are unlikely to be exposed to a stressor in a uniform way because they make decisions differently based on intrinsic (e.g., sex, age, reproductive status) and extrinsic (e.g., environment, prey, predators) factors (Erlinge & Sandell 1986). For example, a foraging female gray whale who is still nursing a calf will need to consider factors that are different to ones that an adult single male might need to consider when choosing a location to feed. These differences in decision-making exist across the whole population, which makes it important to understand where individuals are spending time and how they overlap with stressors in space and time before trying to quantify the impacts of stressors on the population as a whole (Pirotta et al. 2018). I am currently working on an analysis that will determine an individual’s exposure to a number of stressors based on their space use patterns. 

We can monitor space use patterns of individuals in a population through time using spatial capture-recapture techniques. As the name implies, a spatial capture-recapture technique involves capturing an individual in a marked location during a sampling period, releasing it back into the population, and then (hopefully) re-capturing it during another sampling period in the future, at either the same or a different location. With enough repeat sampling events, the method should build spatial capture histories of individuals through time to better understand an individual’s space use patterns (Borchers & Efford 2008). While the use of the word capture implies that the animal is being physically caught, this is not necessarily the case. Individuals can be “captured” in a number of non-invasive ways, including by being photographed, which is how we “capture” individual PCFG gray whales. These capture-recapture methods were first pioneered in terrestrial systems, where camera traps (i.e., cameras that take photos or videos when a motion sensor is triggered) are set up in a systematic grid across a study area (Figure 1; Royle et al. 2009, Gray 2018). Placing the cameras in a grid system ensures that there is an equal distribution of cameras throughout the study area, which means that an animal theoretically has a uniform chance of being captured. However, because we know that individuals within a population make space use decisions differently, we assume that individuals will distribute themselves differently across a landscape, which will manifest as individuals having different centers of their spatial activity. The probability of capturing an individual is highest when a camera trap is at that individual’s activity center, and the cameras furthest away from the individual’s activity center will have the lowest probability of capturing that individual (Efford 2004). By using this principle of probability, the data generated from spatial capture-recapture field methods can be modelled to estimate the activity centers and ranges for all individuals in a population. The overlap of an individual’s activity center and range can then be compared to the spatiotemporal distribution of stressors that an individual may be exposed to, allowing us to determine whether and how an individual has been exposed to each stressor. 

Figure 1. Example of camera trap grid in a study area. Figure taken from Gray (2018).

While capture-recapture methods were first developed in terrestrial systems, they have been adapted for application to marine populations, which is what I am doing for our GRANITE dataset of PCFG gray whales. Together with a team of committee members and GRANITE collaborators, I am developing a Bayesian spatial capture-recapture model to estimate individual space use patterns. In order to mimic the camera trap grid system, we have divided our central Oregon coast study area into latitudinal bins that are approximately 1 km long. Unfortunately, we do not have motion sensor activated cameras that automatically take photographs of gray whales in each of these latitudinal bins. Instead, we have eight years of boat-based survey effort with whale encounters where we collect photographs of many individual whales. However, as you now know, being able to calculate the probability of detection is important for estimating an individual’s activity center and range. Therefore, we calculated our spatial survey effort per latitudinal bin in each study year to account for our probability of detecting whales (i.e., the area of ocean in km2 that we surveyed). Next, we tallied up the number of times we observed every individual PCFG whale in each of those latitudinal bins per year, thus creating individual spatial capture histories for the population. Finally, using just those two data sets (the individual whale capture histories and our survey effort), we can build models to test a number of different hypotheses about individual gray whale space use patterns. There are many hypotheses that I want to test (and therefore many models that I need to run), with increasing complexity, but I will explain one here.

Over eight years of field work for the GRANITE project, consisting of over 40,000 km2 of ocean surveyed with 2,169 sightings of gray whales, our observations lead us to hypothesize that there are two broad space use strategies that whales use to optimize how they find enough prey to meet their energetic needs. For the moment, we are calling these strategies ‘home-body’ and ‘roamer’. As the name implies, a home-body is an individual that stays in a relatively small area and searches for food in this area consistently through time. A roamer, on the other hand, is an individual that travels and searches over a greater spatial area to find good pockets of food and does not generally tend to stay in just one place. In other words, we except a home-body to have a consistent activity center through time and a small activity range, while a roamer will have a much larger activity range and its activity center may vary more throughout the years (Figure 2). 

Figure 2. Schematic representing one of the hypotheses we will be testing with our Bayesian spatial capture-recapture models. The schematic shows the activity centers (the circles) and activity ranges (vertical lines attached to the circles) of two individuals (green and orange) across three years in our central Oregon study area. The green individual represents our hypothesized idea of a home-body, whereas the orange individuals represents our idea of a roamer.

While this hypothesis sounds straightforward, there are a lot of decisions that I need to make in the Bayesian modeling process that can ultimately impact the results. For example, do all home-bodies in a population have the same size activity range or can the size vary between different home-bodies? If it can vary, by how much can it vary? These same questions apply for the roamers too. I have a long list of questions just like these, which means a lot of decision-making on my part, and that long list of hypotheses I previously mentioned. Luckily, I have a fantastic team made up of Leigh, committee members, and GRANITE collaborators that are guiding me through this process. In just a few more months, I hope to reveal how PCFG individuals distribute themselves in space and time throughout our central Oregon study area, and hence describe their exposure to different stressors. Stay tuned! 

Did you enjoy this blog? Want to learn more about marine life, research, and conservation? Subscribe to our blog and get a weekly message when we post a new blog. Just add your name and email into the subscribe box below.

Loading

References

Borchers DL, Efford MG (2008) Spatially explicit maximum likelihood methods for capture-recapture studies. Biometrics 64:377-385.

Efford M (2004) Density estimation in live-trapping studies. Oikos 106:598-610.

Erlinge S, Sandell M (1986) Seasonal changes in the social organization of male stoats, Mustela erminea: An effect of shifts between two decisive resources. Oikos 47:57-62.

Gray TNE (2018) Monitoring tropical forest ungulates using camera-trap data. Journal of Zoology 305:173-179.

Pirotta E, Booth CG, Costa DP, Fleishman E, Kraus SD, and others (2018) Understanding the population consequences of disturbance. Ecology and Evolution 8(19):9934–9946.Royle J, Nichols J, Karanth KU, Gopalaswamy AM (2009) A hierarchical model for estimating density in camera-trap studies. Journal of Applied Ecology 46:118-127.

How big, how blue, how beautiful! Studying the impacts of climate change on big, (and beautiful) blue whales

Dr. KC Bierlich, Postdoctoral Scholar, OSU Department of Fisheries, Wildlife, & Conservation Sciences, Geospatial Ecology of Marine Megafauna Lab

The SAPPHIRE Project is in full swing, as we spend our days aboard the R/V Star Keys searching for krill and blue whales (Figure 1) in the South Taranaki Bight (STB) region of Aotearoa New Zealand. We are investigating how changing ocean conditions impact krill availability and quality, and how this in turn impacts blue whale behavior, health, and reproduction. Understanding the link between changing environmental conditions on prey species and predators is key to understanding the larger implications of climate change on ocean food webs and each populations’ resiliency. 

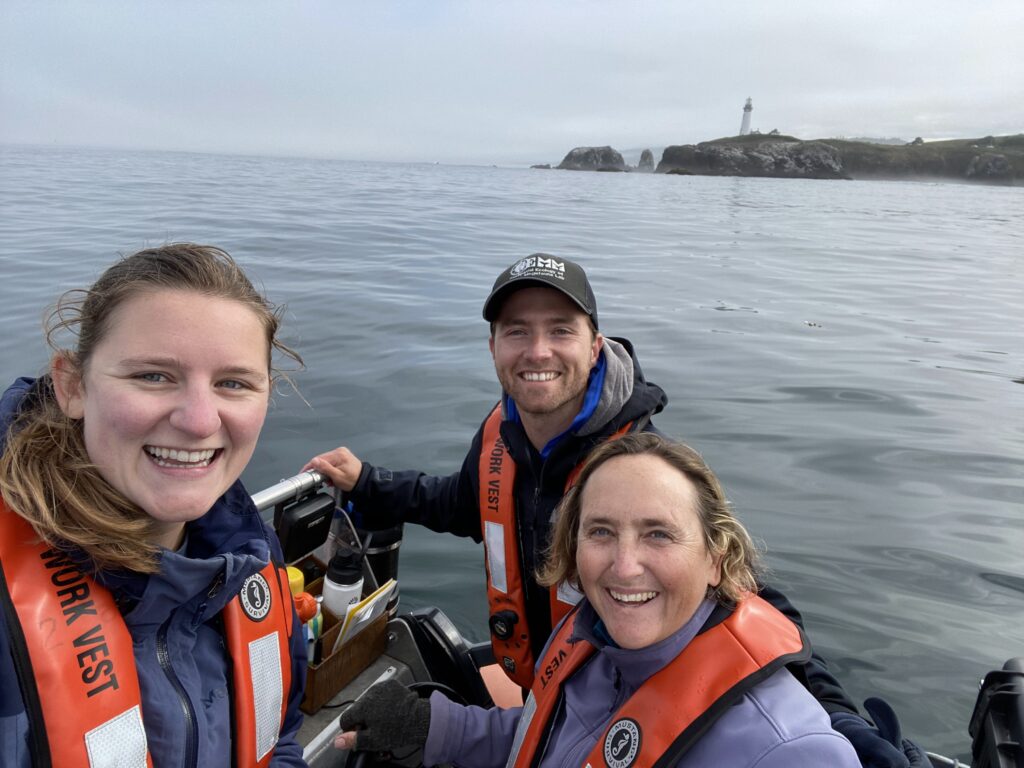
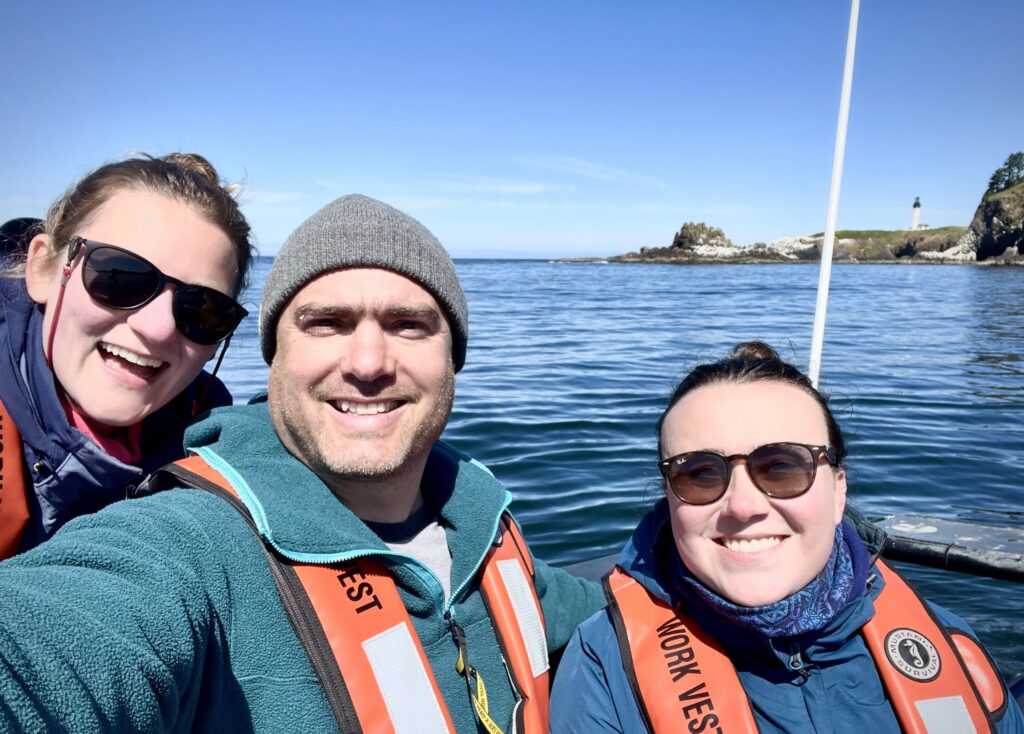
Figure 1. The SAPPHIRE team searching for blue whales. Top left) KC Bierlich, top right) Dawn Barlow, bottom left) Dawn Barlow, Kim Bernard (left to right), bottom right) KC Bierlich, Dawn Barlow, Leigh Torres, Mike Ogle (left to right).  

One of the many components of the SAPPHIRE Project is to understand how foraging success of blue whales is influenced by environmental variation (see this recent blog written by Dr. Dawn Barlow introducing each component of the project). When you cannot go to a grocery store or restaurant any time you are hungry, you must rely on stored energy from previous feeds to fuel energy needs. Body condition reflects an individual’s stored energy in the body as a result of feeding and thus represents the foraging success of an individual, which can then affect its potential for reproductive output and the individual’s overall health (see this previous blog). As discussed in a previous blog, drones serve as a valuable tool for obtaining morphological measurements of whales to estimate their body condition. We are using drones to collect aerial imagery of pygmy blue whales to obtain body condition measurements late in the foraging season between years 2024 and 2026 of the SAPPHIRE Project (Figure 2). We are quantifying body condition as Body Area Index (BAI), which is a relative measure standardized by the total length of the whale and well suited for comparing individuals and populations (Figure 3). 

The GEMM Lab recently published an article led by Dr. Dawn Barlow where we investigated the differences in BAI between three blue whale populations: Eastern North Pacific blue whales feeding in Monterey Bay, California; Chilean blue whales feeding in the Corcovado Gulf; and New Zealand Pygmy blue whales feeding in the STB (Barlow et al., 2023). These three populations are interesting to compare since blue whales that feed in Monterey Bay and Corcovado Gulf migrate to and from these seasonally productive feeding grounds, while the Pygmy blue whales stay in Aotearoa New Zealand year-round. Interestingly, the Pygmy blue whales had higher BAI (were fatter) compared to the other two regions despite relatively lower productivity in their foraging grounds. This difference in body condition may be due to different life history strategies where the non-migratory Pygmy blue whales may be able to feed as opportunities arrive, while the migratory strategies of the Eastern North Pacific and Chilean blue whales require good timing to access high abundant prey. Another interesting and unexpected result from our blue whale comparison was that Pygmy blue whales are not so “pygmy”; they are actually the same size as Eastern North Pacific and Chilean blue whales, with an average size around 22 m. Our findings from this blue whale comparison leads us to more questions about how environmental conditions that vary from year to year influence body condition and reproduction of these “not so pygmy” blue whales. 

Figure 2. An aerial image of a Pygmy blue whale in the South Taranaki Bight region of Aotearoa New Zealand collected during the SAPPHIRE 2024 field season using a DJI Inspire 2 drone. 
Figure 3. A drone image of a Pygmy blue whale and the length and body width measurements used to estimate Body Area Index (BAI), represented by the shaded blue region. Width measurements will also be used to help identify pregnant individuals.

The GEMM Lab has been studying this population of Pygmy blue whales in the STB since 2013 and found that years designated as a marine heatwave resulted with a reduction in blue whale feeding activity. Interestingly, breeding activity is also reduced during marine heatwaves in the following season when compared to the breeding season following a more productive, typical foraging season. These findings indicate that fluctuations in the environment, such as marine heatwaves, may affect not only foraging success, but also reproduction in Pygmy blue whales. 

To help us better understand reproductive patterns across years, we will use body width measurements from drone images paired with hormone concentrations collected from fecal and biopsy samples to identify pregnant individuals. Progesterone is a hormone secreted in the ovaries of mammals during the estrous cycle and gestation, making it the predominant hormone responsible for sustaining pregnancy. Recently, the GEMM Lab’s Dr. Alejandro Fernandez-Ajo wrote a blog discussing his publication identifying pregnant individual gray whales using drone-based body width measurements and progesterone concentrations from fecal samples (Fernandez et al., 2023). While individuals that were pregnant had higher levels of progesterone compared to when they were not pregnant, the body width at 50% of the body length served as a more reliable method for detecting pregnancy in gray whales. We will use similar methods to help identify pregnancy in Pygmy blue whales for the SAPPHIRE Project where will we examine body width measurement paired with progesterone concentrations collected from fecal and biopsy samples to identify pregnant individuals. We hope our work will help to better understand how climate change will influence Pygmy blue whale body condition and reproduction, and thus the overall health and resiliency of the population. Stay tuned! 

References

Barlow, D. R., Bierlich, K. C., Oestreich, W. K., Chiang, G., Durban, J. W., Goldbogen, J. A., Johnston, D. W., Leslie, M. S., Moore, M. J., Ryan, J. P., & Torres, L. G. (2023). Shaped by Their Environment: Variation in Blue Whale Morphology across Three Productive Coastal Ecosystems. Integrative Organismal Biology, 5(1). https://doi.org/10.1093/iob/obad039

Fernandez Ajó, A., Pirotta, E., Bierlich, K. C., Hildebrand, L., Bird, C. N., Hunt, K. E., Buck, C. L., New, L., Dillon, D., & Torres, L. G. (2023). Assessment of a non-invasive approach to pregnancy diagnosis in gray whales through drone-based photogrammetry and faecal hormone analysis. Royal Society Open Science10(7), 230452. https://doi.org/10.1098/rsos.230452

Migrating back east

By: Kate Colson, MSc Oceans and Fisheries, University of British Columbia, Institute for the Oceans and Fisheries, Marine Mammal Research Unit

With the changing of the season, gray whales are starting their southbound migration that will end in the lagoons off the Baja California Mexico. The migration of the gray whale is the longest migration of any mammal—the round trip totals ~10,000 miles (Pike, 1962)! 

Map of the migration route taken by gray whales along the west coast of North America. (Image credit: Angle, Asplund, and Ostrander, 2017 https://www.slocoe.org/resources/parent-and-public-resources/what-is-a-california-gray-whale/california-gray-whale-migration/)

Like these gray whales, I am also undertaking my own “migration” as I leave Newport to start my post-Master’s journey. However, my migration will be a little shorter than the gray whale’s journey—only ~3,000 miles—as I head back to the east coast. As I talked about in my previous blog, I have finished my thesis studying the energetics of gray whale foraging behaviors and I attended my commencement ceremony at the University of British Columbia last Wednesday. As my time with the GEMM Lab comes to a close, I want to take some time to reflect on my time in Newport. 

Me in my graduation regalia (right) and my co-supervisor Andrew Trites holding the university mace (left) after my commencement ceremony at the University of British Columbia rose garden. 

Many depictions of scientists show them working in isolation but in my time with the GEMM Lab I got to fully experience the collaborative nature of science. My thesis was a part of the GEMM Lab’s Gray whale Response to Ambient Noise Informed by Technology and Ecology (GRANITE) project and I worked closely with the GRANITE team to help achieve the project’s research goals. The GRANITE team has annual meetings where team members give updates on their contributions to the project and flush out ideas in a series of very busy days. I found these collaborative meetings very helpful to ensure that I was keeping the big picture of the gray whale study system in mind while working with the energetics data I explored for my thesis. The collaborative nature of the GRANITE project provided the opportunity to learn from people that have a different skill set from my own and expose me to many different types of analysis. 

GRANITE team members hard at work thinking about gray whales and their physiological response to noise. 

This summer I also was able to participate in outreach with the partnership of the Oregon State University Marine Mammal Institute and the Eugene Exploding Whales (the alternate identity of the Eugene Emeralds) minor league baseball team to promote the Oregon Gray Whale License plates. It was exciting to talk to baseball fans about marine mammals and be able to demonstrate that the Gray Whale License plate sales are truly making a difference for the gray whales off the Oregon coast. In fact, the minimally invasive suction cup tags used in to collect the data I analyzed in my thesis were funded by the OSU Gray Whale License plate fund!

Photo of the GEMM Lab promoting Oregon Gray Whale License plates at the Eugene Exploding Whales baseball game. If you haven’t already, be sure to “Put a whale on your tail!” to help support marine mammal research off the Oregon Coast. 

Outside of the amazing science opportunities, I have thoroughly enjoyed the privilege of exploring Newport and the Oregon coast. I was lucky enough to find lots of agates and enjoyed consistently spotting gray whale blows on my many beach walks. I experienced so many breathtaking views from hikes (God’s thumb was my personal favorite). I got to attend an Oregon State Beavers football game where we crushed Stanford! And most of all, I am so thankful for all the friends I’ve made in my time here. These warm memories, and the knowledge that I can always come back, will help make it a little easier to start my migration away from Newport. 

Me and my friends outside of Reser Stadium for the Oregon State Beavers football game vs Stanford this season. Go Beavs!!!
Me and my friends celebrating after my defense. 

Did you enjoy this blog? Want to learn more about marine life, research, and
conservation? Subscribe to our blog and get a weekly message when we post a new
blog. Just add your name and email into the subscribe box below

Loading

References

Pike, G. C. (1962). Migration and feeding of the gray whale (Eschrichtius gibbosus). Journal of the Fisheries Research Board of Canada19(5), 815–838. https://doi.org/10.1139/f62-051

A smaller sized gray whale: recent publication finds PCFG whales are smaller than ENP whales

Dr. KC Bierlich, Postdoctoral Scholar, OSU Department of Fisheries, Wildlife, & Conservation Sciences, Geospatial Ecology of Marine Megafauna (GEMM) Lab

A recent blog post by GEMM Lab’s PhD Candidate Clara Bird gave a recap of our 8th consecutive GRANITEfield season this year. In her blog, Clara highlighted that we saw 71 individual gray whales this season, 61 of which we have seen in previous years and identified as belonging to the Pacific Coast Feeding Group (PCFG). With an estimated population size of around 212 individuals, this means that we saw almost 1/3 of the PCFG population this season alone. Since the GEMM Lab first started collecting data on PCFG gray whales in 2016, we have collected drone imagery on over 120 individuals, which is over half the PCFG population. This dataset provides incredible opportunity to get to know these individuals and observe them from year to year as they grow and mature through different life history stages, such as producing a calf. A question our research team has been interested in is what makes a PCFG whale different from an Eastern North Pacific (ENP) gray whale, which has a population size around 16,000 individuals and feed predominantly in the Arctic during the summer months? For this blog, I will highlight findings from our recent publication in Biology Letters (Bierlich et al., 2023) comparing the morphology (body length, skull, and fluke size) between PCFG and ENP populations. 

Body size and shape reflect how an animal functions in their environment and can provide details on an individual’s current health, reproductive status, and energetic requirements. Understanding how animals grow is a key component for monitoring the health of populations and their vulnerability to climate change and other stressors in their environment.  As such, collecting accurate morphological measurements of individuals is essential to model growth and infer their health. Collecting such morphological measurements of whales is challenging, as you cannot ask a whale to hold still while you prepare the tape measure, but as discussed in a previous blog, drones provide a non-invasive method to collect body size measurements of whales. Photogrammetry is a non-invasive technique used to obtain morphological measurements of animals from photographs. The GEMM Lab uses drone-based photogrammetry to obtain morphological measurements of PCFG gray whales, such as their body length, skull length (as snout-to-blowhole), and fluke span (see Figure 1). 

Figure 1. Morphological measurements obtained via photogrammetry of a Pacific Coast Feeding Group (PCFG) gray whale. These measurements were used to compare to individuals from the Eastern North Pacific (ENP) population. 

As mentioned in this previous blog, we use photo-identification to identify unique individual gray whales based on markings on their body. This method is helpful for linking all the data we are collecting (morphology, hormones, behavior, new scarring and skin conditions, etc.) to each individual whale. An individual’s sightings history can also be used to estimate their age, either as a ‘minimum age’ based on the date of first sighting or a ‘known age’ if the individual was seen as a calf. By combining the length measurements from drone-based photogrammetry and age estimates from photo-identification history, we can construct length-at-age growth models to examine how PCFG gray whales grow. While no study has previously examined length-at-age growth models specifically for PCFG gray whales, another study constructed growth curves for ENP gray whales using body length and age estimates obtained from whaling, strandings, and aerial photogrammetry (Agbayani et al., 2020). For our study, we utilized these datasets and compared length-at-age growth, snout-to-blowhole length, and fluke span between PCFG and ENP whales. We used Bayesian statistics to account and incorporate the various levels of uncertainty associated with data collected (i.e., measurements from whaling vs. drone, ‘minimum age’ vs. ‘known age’). 

We found that while both populations grow at similar rates, PCFG gray whales reach smaller adult lengths than ENP. This difference was more extreme for females, where PCFG females were ~1 m (~3 ft) shorter than ENP females and PCFG males were ~0.5 m (1.5 ft) shorter than ENP males (Figure 2, Figure 3). We also found that ENP males and females have slightly larger skulls and flukes than PCFG male and females, respectively. Our results suggest PCFG whales are shaped differently than ENP whales (Figure 3)! These results are also interesting in light of our previous published study that found PCFG whales are skinnier than ENP whales (see this previous blog post). 

Figure 2. Growth curves (von Bertalanffy–Putter) for length-at-age comparing male and female ENP and PCFG gray whales (shading represents 95% highest posterior density intervals). Points represent mean length and median age. Vertical bars represent photogrammetric uncertainty. Dashed horizontal lines represent uncertainty in age estimates.

Figure 3. Schematic highlighting the differences in body size between Pacific Coast Feeding Group (PCFG) and Eastern North Pacific (ENP) gray whales. 

Our results raise some interesting questions regarding why PCFG are smaller: Is this difference in size and shape normal for this population and are they healthy? Or is this difference a sign that they are stressed, unhealthy and/or not getting enough to eat? Larger individuals are typically found at higher latitudes (this pattern is called Bergmann’s Rule), which could explain why ENP whales are larger since they feed in the Arctic. Yet many species, including fish, birds, reptiles, and mammals, have experienced reductions in body size due to changes in habitat and anthropogenic stressors (Gardner et al., 2011). The PCFG range is within closer proximity to major population centers compared to the ENP foraging grounds in the Arctic, which could plausibly cause increased stress levels, leading to decreased growth. 

The smaller morphology of PCFG may also be related to the different foraging tactics they employ on different prey and habitat types than ENP whales. Animal morphology is linked to behavior and habitat (see this blogpost). ENP whales feeding in the Arctic generally forage on benthic amphipods, while PCFG whales switch between benthic, epibenthic and planktonic prey, but mostly target epibenthic mysids. Within the PCFG range, gray whales often forage in rocky kelp beds close to shore in shallow water depths (approx. 10 m) that are on average four times shallower than whales feeding in the Arctic. The prey in the PCFG range is also found to be of equal or higher caloric value than prey in the Arctic range (see this blog), which is interesting since PCFG were found to be skinnier.

It is also unclear when the PCFG formed? ENP and PCFG whales are genetically similar, but photo-identification history reveals that calves born into the PCFG usually return to forage in this PCFG range, suggesting matrilineal site fidelity that contributes to the population structure. PCFG whales were first documented off our Oregon Coast in the 1970s (Figure 4). Though, from examining old whaling records, there may have been PCFG gray whales foraging off the coasts of Northern California to British Columbia since the 1920s.

Figure 4. First reports of summer-resident gray whales along the Oregon coast, likely part of the Pacific Coast Feeding Group. Capital Journal, August 9, 1976, pg. 2.

Altogether, our finding led us to two hypotheses: 1) the PCFG range provides an ecological opportunity for smaller whales to feed on a different prey type in a shallow environment, or 2) the PCFG range is an ecological trap, where individuals gain less energy due to energetically costly feeding behaviors in complex habitat while potentially targeting lower density prey, causing them to be skinnier and have decreased growth. Key questions remain for our research team regarding potential consequences of the smaller sized PCFG whales, such as does the smaller body size equate to reduced resilience to environmental and anthropogenic stressors? Does smaller size effect fecundity and population fitness? Stay tuned as we learn more about this unique and fascinating smaller sized gray whale. 

References

Agbayani, S., Fortune, S. M. E., & Trites, A. W. (2020). Growth and development of North Pacific gray whales (Eschrichtius robustus). Journal of Mammalogy101(3), 742–754. https://doi.org/10.1093/jmammal/gyaa028

Bierlich, K. C., Kane, A., Hildebrand, L., Bird, C. N., Fernandez Ajo, A., Stewart, J. D., Hewitt, J., Hildebrand, I., Sumich, J., & Torres, L. G. (2023). Downsized: gray whales using an alternative foraging ground have smaller morphology. Biology Letters19(8). https://doi.org/10.1098/rsbl.2023.0043

Gardner, J. L., Peters, A., Kearney, M. R., Joseph, L., & Heinsohn, R. (2011). Declining body size: A third universal response to warming? Trends in Ecology and Evolution26(6), 285–291. https://doi.org/10.1016/j.tree.2011.03.005

The whales keep coming and we keep learning: a wrap up of the eighth GRANITE field season.

Clara Bird, PhD Candidate, OSU Department of Fisheries, Wildlife, and Conservation Sciences, Geospatial Ecology of Marine Megafauna Lab

As you may remember, last year’s field season was a remarkable summer for our team. We were pleasantly surprised to find an increased number of whales in our study area compared to previous years and were even more excited that many of them were old friends. As we started this field season, we were all curious to know if this year would be a repeat. And it’s my pleasure to report that this season was even better!

We started the season with an exciting day (6 known whales! see Lisa’s blog) and the excitement (and whales) just kept coming. This season we saw 71 individual whales across 215 sightings! Of those 71, 44 were whales we saw last year, and 10 were new to our catalog, meaning that we saw 17 whales this season that we had not seen in at least two years! There is something extra special about seeing a whale we have not seen in a while because it means that they are still alive, and the sighting gives us valuable data to continue studying health and survival. Another cool note is that 7 of our 12 new whales from last year came back this year, indicating recruitment to our study region.

Included in that group of 7 whales are the two calves from last year! Again, indicating good recruitment of new whales to our study area. We saw both Lunita and Manta (previously nick-named ‘Roly-poly’) throughout this season and we were always happy to see them back in our area and feeding on their own.

Drone image of Lunita from 2023
Drone image of Manta from 2023

We had an especially remarkable encounter with Lunita at the end of this season when we found this whale surface feeding on porcelain crab larvae (video 1)! This is a behavior that we rarely observe, and we’ve never seen a juvenile whale use this behavior before, inspiring questions around how Lunita knew how to perform this behavior.

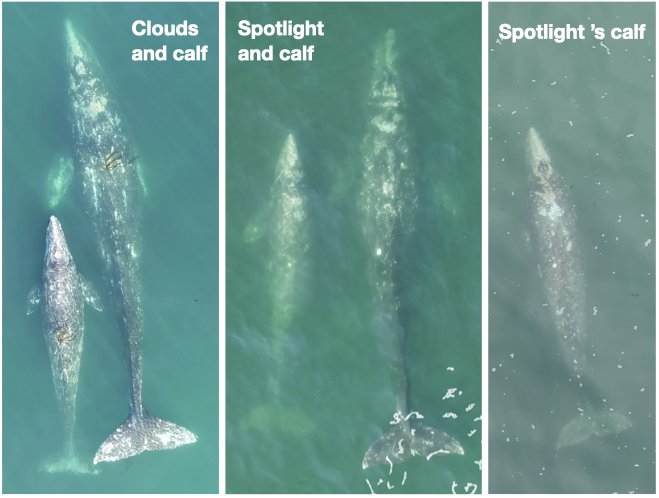
Not only did we resight our one-year-old friends, but we found two new calves born to well-known mature females (Clouds and Spotlight). We had previously documented Clouds with a calf (Cheetah) in 2016 so it was exciting to see her with a new calf and to meet Cheetah’s sibling! Cheetah has become one of our regulars so we’re curious to see if this new calf joins the regular crew as well. We’re also hoping that Spotlight’s calf will stick around; and we’re optimistic since we observed it feeding alone later in the season.

Collage of new calves from 2023! Left: Clouds and her calf, Center: Spotlight and her calf, Right: Spotlight’s calf independently foraging

Of course, 71 whales means heaps of data! We spent 226 hours on the water, conducted 132 drone flights (a record!), and collected 61 fecal samples! Those 132 flights were over 64 individual whales, with Casper and Pacman tying for “best whale to fly over” with 10 flights each. We collected 61 fecal samples from 26 individual whales with a three-way tie for “best pooper” between Hummingbird, Scarlett, and Zorro with 6 fecal samples each. And we continued to collect valuable prey and habitat data through 80 GoPro drops and 79 zooplankton net tows.

And if you were about to ask, “but what about tagging?!”, fear not! We continued our suction cup tagging effort with a successful window in July where we were joined by collaborators John Calambokidis from Cascadia Research Collective and Dave Cade from Hopkins Marine Station and deployed four suction-cup tags.

It’s hard to believe all the work we’ve accomplished in the past five months, and I continue to be honored and proud to be on this incredible team. But as this season has come to a close, I have found myself reflecting on something else. Learning. Over the past several years we have learned so much about not only these whales in our study system but about how to conduct field work. And while learning is continuous, this season in particular has felt like an exciting time for both. In the past year our group has published work showing that we can detect pregnancy in gray whales using fecal samples and drone imagery (Fernandez Ajó et al., 2023), that PCFG gray whales are shorter and smaller than ENP whales (Bierlich et al., 2023), and that gray whales are consuming high levels of microplastics (Torres et al., 2023). We also have several manuscripts in review focused on our behavior work from drones and tags. While this information does not directly affect our field work, it does mean that while we’re observing these whales live, we better understand what we’re observing and we can come up with more specific, in-depth questions based on this foundation of knowledge that we’re building. I have enjoyed seeing our questions evolve each year based on our increasing knowledge and I know that our collaborative, inquisitive chats on the boat will only continue inspiring more exciting research.

On top of our gray whale knowledge, we have also learned so much about field work. When I think back to the early days compared to now, there is a stark difference in our knowledge and our confidence. We do a lot on our little boat! And so many steps that we once relied on written lists to remember to do are now just engrained in our minds and bodies. From loading the boat, to setting up at the dock, to the go pro drops, fecal collections, drone operations, photo taking, and photo ID, our team has become quite the well-oiled machine. We were also given the opportunity to reflect on everything we’ve learned over the past years when it was our turn to train our new team member, Nat! Nat is a new PhD student in the GEMM lab who is joining team GRANITE. Teaching her all the ins and outs of our fieldwork really emphasized how much we ourselves have learned.

On a personal note, this was my third season as a drone pilot, and honestly, I was pleasantly surprised by my experience this season. Since I started piloting, I have experienced pretty intense nerves every time I’ve flown the drone. From stress dreams, to mild nausea, and an elevated heart rate, flying the drone was something that I didn’t necessarily look forward to. Don’t get me wrong – it’s incredibly valuable data and a privilege to watch the whales from a bird’s eye view in real time. But the responsibility of collecting good data, while keeping the drone and my team members safe was something that I felt viscerally. And while I gained confidence with every flight, the nerves were still as present as ever and I was starting to accept that I would never be totally comfortable as a pilot. Until this season, when the nerves finally cleared, and piloting became as innate as all the other field work components. While there are still some stressful moments, the nerves don’t come roaring back. I have finally gone through enough stressful situations to not be fazed by new ones. And while I am fully aware that this is just how learning works, I write this reflection as a reminder to myself and anyone going through the process of learning any new skill to push through that fear. Remember there can be a disconnect between the time when you know how to do something well, or well-enough, and the time when you feel comfortable doing it. I am just as proud of myself for persevering as I am of the team for collecting so much incredible data. And as I look ahead to my next scary challenge (finishing my PhD!), this is a feeling that I am trying to hold on to. 

Stay tuned for updates from team GRANITE!

Did you enjoy this blog? Want to learn more about marine life, research, and conservation? Subscribe to our blog and get a weekly alert when we make a new post! Just add your name into the subscribe box below!
Loading

References

Bierlich, K. C., Kane, A., Hildebrand, L., Bird, C. N., Fernandez Ajo, A., Stewart, J. D., Hewitt, J., Hildebrand, I., Sumich, J., & Torres, L. G. (2023). Downsized: Gray whales using an alternative foraging ground have smaller morphology. Biology Letters19(8), 20230043. https://doi.org/10.1098/rsbl.2023.0043

Fernandez Ajó, A., Pirotta, E., Bierlich, K. C., Hildebrand, L., Bird, C. N., Hunt, K. E., Buck, C. L., New, L., Dillon, D., & Torres, L. G. (2023). Assessment of a non-invasive approach to pregnancy diagnosis in gray whales through drone-based photogrammetry and faecal hormone analysis. Royal Society Open Science10(7), 230452. https://doi.org/10.1098/rsos.230452

Torres, L. G., Brander, S. M., Parker, J. I., Bloom, E. M., Norman, R., Van Brocklin, J. E., Lasdin, K. S., & Hildebrand, L. (2023). Zoop to poop: Assessment of microparticle loads in gray whale zooplankton prey and fecal matter reveal high daily consumption rates. Frontiers in Marine Science10. https://www.frontiersin.org/articles/10.3389/fmars.2023.1201078

Fantastic beasts and how to measure  them! 

Sagar Karki, Master’s student in the Computer Science Department at Oregon State University 

What beasts? Good question! We are talking about gray whales in this article but honestly we can tweak the system discussed in this blog a little and make it usable for other marine animals too.  

Understanding the morphology, such as body area and length, of wild animals and populations can provide important information on animal  behavior and health (check out postdoc Dr. KC Bierlich’s post on this topic). Since 2015, the GEMM Lab has been flying drones over whales to collect aerial imagery to allow for photogrammetric measurements to gain this important morphological data. This photogrammetry data has shed light on multiple important aspects of gray whale morphology, including the facts that the whales feeding off Oregon are skinnier [1] and shorter [2] than the gray whales that feed in the Arctic region.  But, these surprising conclusions overshadow the immense, time-consuming labor that takes place behind the scenes to move from aerial images to accurate measurements.  

To give you a sense of this laborious process, here is a quick run through of the methods: First the 10 to 15 minute videos must be carefully watched to select the perfect frames of a whale (flat and straight at the surface) for measurement. The selected frames from the drone imagery are then imported into MorphoMetriX, which is a custom software developed for photogrammetry measurement [1]. MorphoMetriX is an interactive application that allows an analyst to manually measure the length by clicking points along the centerline of the whale’s body. Based on this line, the whale is divided into a set of sections perpendicular to the centerline, these are used to then measure widths along the body. The analyst then clicks border points at the edge of the whale’s body to delineate the widths following the whale’s body curve. MorphoMetriX then generates a file containing the lengths and widths of the whale in pixels for each measured image. The length and widths of whales are converted from pixels to metric units using a software called CollatriX [4] and this software also calculates metrics of body condition from the length and width measurements. 

While MorphoMetriX [3] and CollatriX [4] are both excellent platforms to facilitate these photogrammetry measurements, each measurement takes time, a keen eye, and attention to detail. Plus, if you mess up one step, such as an incorrect length or width measurement, you have to start from the first step. This process is a bottleneck in the process of obtaining important morphology data on animals. Can we speed this process up and still obtain reliable data? 

What if we can apply automation using computer vision to extract the frames we need and automatically obtain measurements that are as accurate as humans can obtain? Sounds pretty nice, huh? This is where I come into the picture. I am a Master’s student in the Computer Science Department at OSU, so I lack a solid background in marine science, but bring to the table my skills as a computer programmer. For my master’s project, I have been working in the GEMM Lab for the past year to develop automated methods to obtain accurate photogrammetry measurements of whales.  

We are not the first group to attempt to use computers and AI to speed up and improve the identification and detection of whales and dolphins in imagery. Researchers have used deep learning networks to speed up the time-intensive and precise process of photo-identification of  individual whales and dolphins [5], allowing us to more quickly determine animal location, movements and abundance. Millions of satellite images of the earth’s surface are collected daily and scientists are attempting to utilize these images to  benefit marine life by studying patterns of species occurrence, including detection of gray whales in satellite images using deep learning [6]. There has also been success using computer vision to identify whale species and segment out the body area of the whales  from drone imagery [7]. This process involves extracting segmentation masks of the whale’s body followed by length extraction from the mask. All this previous research shows promise for the application of computer vision and AI to assist with animal research and conservation. As discussed earlier, the automation of image extraction and photogrammetric measurement  from drone videos will help researchers collect vital data more quickly so that decisions that impact  the health of whales can be more responsive and effective.For instance,  photogrammetry data extracted from drone images can diagnose pregnancy of the whales [8], thus automation of this information could speed up our ability to understand population trends. 

Computer vision and natural language processing fields are growing exponentially. There are new foundation models like ChatGPT that can do most of the natural language understanding and processing tasks. Foundational models are also emerging for computer vision tasks, such as “the segment anything model” from Meta. Using these foundation models along with other existing research work in computer vision, we have developed and deployed a system that automates the manual and computational tasks of MorphoMetriX and CollatriX systems.  

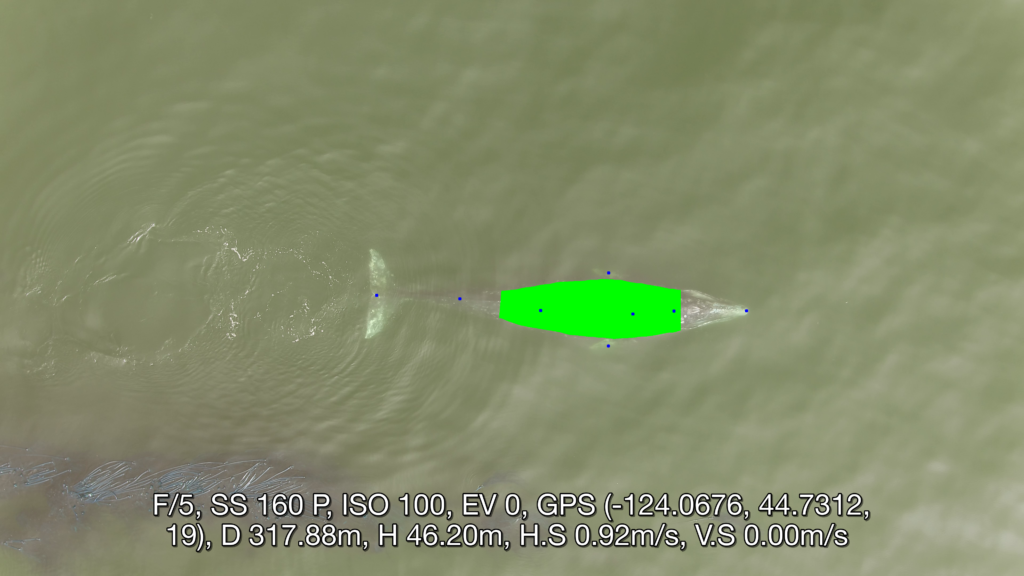
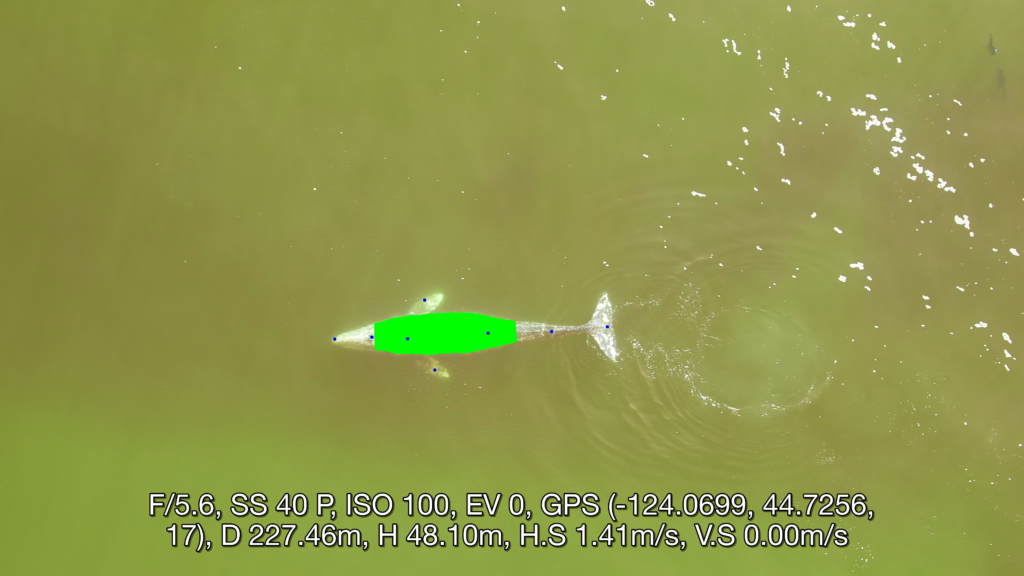
This system is currently in its testing and monitoring phase, but we are rapidly moving toward a publication to disseminate all the tools developed, so stay tuned for the research paper that will explain in detail the methodologies followed on data processing, model training and test results. The following images give a sneak peak of results. Each image  illustrates a frame from a drone video that was  identified and extracted through automation, followed by another automation process that identified important points along the whale’s body and curvature.  The user interface of the system aims to make the user experience intuitive and easy to follow. The deployment is carefully designed to run on different hardwares, with easy monitoring and update options using the latest open source frameworks. The user has to do just two things. First, select the videos for analysis. The system then generates potential frames for photogrammetric analysis (you don’t need to watch 15 mins of drone footage!). Second, the user selects the frame of choice for photogrammetric analysis and waits for the system to give you measurements. Simple! Our goal is for these softwares to be a massive time-saver while  still providing vital, accurate body measurements  to the researchers in record time. Furthermore, an advantage of this approach is that researchers can follow the methods in our to-be-soon-published research paper to make  a few adjustments enabling the software to measure other marine species, thus expanding the impact of this work to many other life forms.  

Did you enjoy this blog? Want to learn more about marine life, research, and conservation? Subscribe to our blog and get a weekly message when we post a new blog. Just add your name and email into the subscribe box below.

Loading

References 

  1. Torres LG, Bird CN, Rodríguez-González F, Christiansen F, Bejder L, Lemos L, Urban R J, Swartz S, Willoughby A, Hewitt J, Bierlich K (2022) Range-Wide Comparison of Gray Whale Body Condition Reveals Contrasting Sub-Population Health Characteristics and Vulnerability to Environmental Change. Front Mar Sci 910.3389/fmars.2022.867258 
  1. Bierlich KC, Kane A, Hildebrand L, Bird CN, Fernandez Ajo A, Stewart JD, Hewitt J, Hildebrand I, Sumich J, Torres LG (2023) Downsized: gray whales using an alternative foraging ground have smaller morphology. Biol Letters 19:20230043 doi:10.1098/rsbl.2023.0043 
  1. Torres et al., (2020). MorphoMetriX: a photogrammetric measurement GUI for morphometric analysis of megafauna. Journal of Open Source Software, 5(45), 1825, https://doi.org/10.21105/joss.01825 
  1. Bird et al., (2020). CollatriX: A GUI to collate MorphoMetriX outputs. Journal of Open Source Software, 5(51), 2328, https://doi.org/10.21105/joss.02328 
  1. Patton, P. T., Cheeseman, T., Abe, K., Yamaguchi, T., Reade, W., Southerland, K., Howard, A., Oleson, E. M., Allen, J. B., Ashe, E., Athayde, A., Baird, R. W., Basran, C., Cabrera, E., Calambokidis, J., Cardoso, J., Carroll, E. L., Cesario, A., Cheney, B. J. … Bejder, L. (2023). A deep learning approach to photo–identification demonstrates high performance on two dozen cetacean species. Methods in Ecology and Evolution, 00, 1–15. https://doi.org/10.1111/2041-210X.14167 
  1. Green, K.M., Virdee, M.K., Cubaynes, H.C., Aviles-Rivero, A.I., Fretwell, P.T., Gray, P.C., Johnston, D.W., Schönlieb, C.-B., Torres, L.G. and Jackson, J.A. (2023), Gray whale detection in satellite imagery using deep learning. Remote Sens Ecol Conserv. https://doi.org/10.1002/rse2.352 
  1. Gray, PC, Bierlich, KC, Mantell, SA, Friedlaender, AS, Goldbogen, JA, Johnston, DW. Drones and convolutional neural networks facilitate automated and accurate cetacean species identification and photogrammetry. Methods Ecol Evol. 2019; 10: 1490–1500. https://doi.org/10.1111/2041-210X.13246 
  1. Fernandez Ajó A, Pirotta E, Bierlich KC, Hildebrand L, Bird CN, Hunt KE, Buck CL, New L, Dillon D, Torres LG (2023) Assessment of a non-invasive approach to pregnancy diagnosis in gray whales through drone-based photogrammetry and faecal hormone analysis. Royal Society Open Science 10:230452 

A Journey From Microbiology to Macrobiology

Mariam Alsaid, University of California Berkeley, GEMM Lab REU Intern

My name is Mariam Alsaid and I am currently a 5th year undergraduate transfer student at the University of California, Berkeley. Growing up on the small island of Bahrain, I was always minutes away from the water and was enraptured by the creatures that lie beneath the surface. Despite my long-standing interest in marine science, I never had the opportunity to explore it until just a few months ago. My professional background up until this point was predominantly in soil microbiology through my work with Lawrence Berkeley National Laboratory, and I was anxious about how I would switch directions and finally be able to pursue my main passion. For this reason, I was thrilled by my acceptance into the OSU Hatfield Marine Science Center’s REU program this year, which led to my exciting collaboration with the GEMM Lab. It was kind of a silly transition to go from studying bacteria, one of the smallest organisms on earth, to whales, who are the largest.

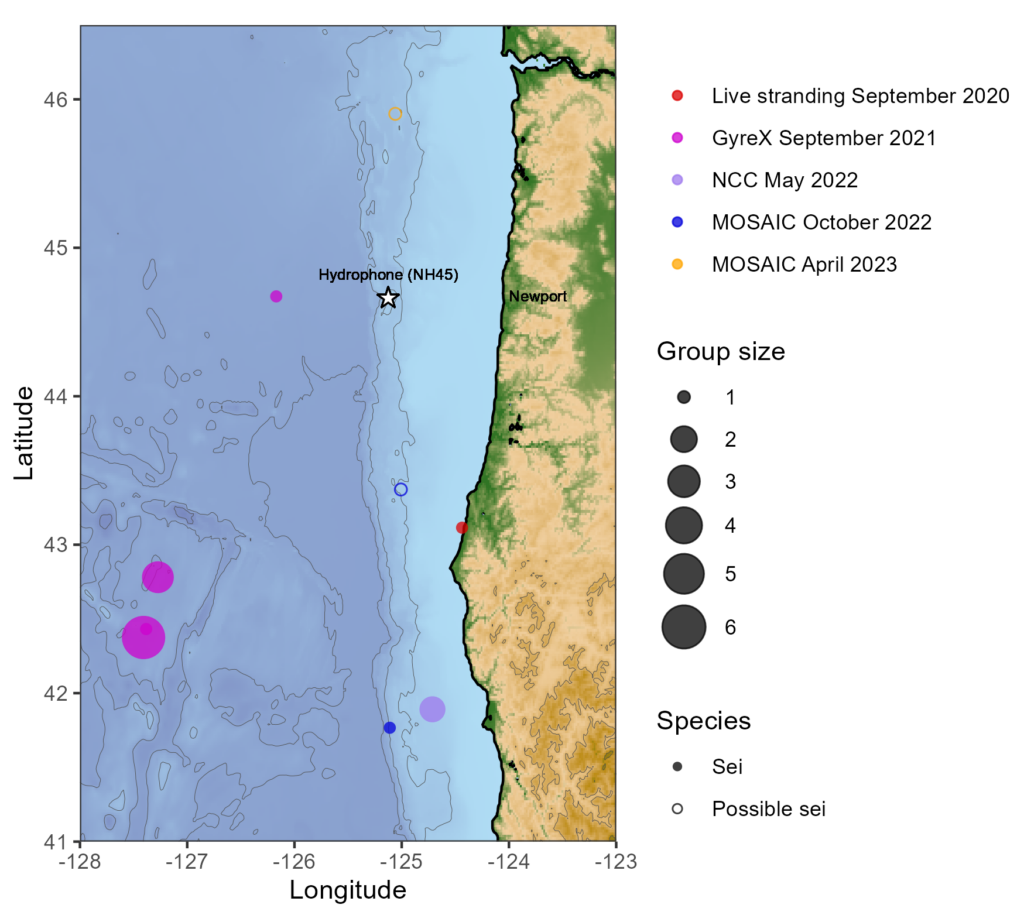
My project this summer focused on sei whale acoustic occurrence off the coast of Oregon. “What’s a sei whale?” is a question I heard a lot throughout the summer and is one that I had to Google myself several times before starting my internship. Believe it or not, sei whales are the third largest rorqual in the world but don’t get much publicity because of their small population sizes and secretive behavior. The commercial whaling industry of the 19th and 20th centuries did a number on sei whale populations globally, rendering them endangered. In consequence, little research has been conducted on their global range, habitat use, and behavior since the ban of commercial whaling in 1986 (Nieukirk et al. 2020). Additionally, sei whales are relatively challenging to study because of their physical similarities to the fin whale, and acoustic similarities to other rorqual vocalizations, most notably blue whale D-calls and fin whale 40 Hz calls. As of today, published literature indicates that sei whale acoustic presence in the Pacific Ocean is restricted to Antarctica, Chile, Hawaii, and possibly British Columbia, Canada (Mcdonald et al. 2005; Espanol-Jiminez et al. 2019; Rankin and Barlow, 2012; Burnham et al. 2019). The idea behind this research project was sparked by sparse visual sightings of sei whales by research cruises conducted by the Marine Mammal Institute (MMI) in recent years (Figure 1). This raised questions about if sei whales are really present in Oregon waters (and not just misidentified fin whales) and if so, how often?

Figure 1. Map of sei whale visual sightings off the coast of Oregon, colored by MMI Lab research cruise, and the location of the hydrophone at NH45 (white star).

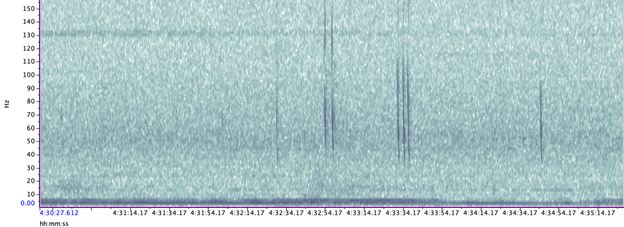
A hydrophone, which is a fancy piece of equipment that records continuous underwater sound, was deployed 45 miles offshore of Newport, OR between October of 2021 and December of 2022. My role this summer was to use this acoustic data to determine whether sei whales are hanging out in Oregon or not. Acoustic data was analyzed using the software Raven Pro, which allowed me to visualize sound in the form of spectrograms (Fig. 2). From there, my task was to select signals that could potentially be sei whale calls. It was a hurdle familiarizing myself with sei whale vocalizations while also keeping in mind that other species (e.g., blue and fin whales) may produce similar sounding (and looking in the spectrograms) calls. For this reason, I decided to establish confidence levels based on published sei whale acoustic research that would help me classify calls with less bias. Vocalizations produced by sei whales are characterized by low frequency, broadband, downsweeps. Sei whales can be acoustically distinguished from other whales because of their tendency to produce uniform groups of calls (typically in doublets and triplets) in a short timeframe. This key finding allowed me to navigate the acoustic data with more ease.

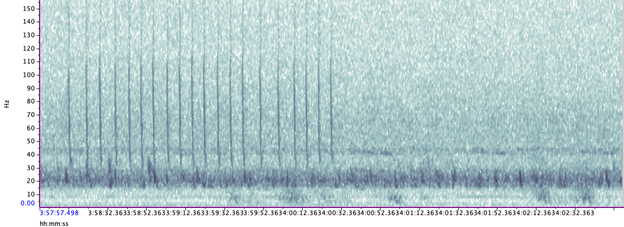
The majority of the summer was spent slowly scanning through the months of data at 5-minute increments. As you can imagine, excitement varied by day. Some days I would find insanely clear signals of blue, fin, and humpback whales and other days I would find nothing. The major discovery and the light at the end of the tunnel was the SEI WHALES!!! I detected numerous high quality sei whale calls throughout the study period with peaks in October and November (but a significantly higher peak in occurrence in 2022 versus 2021). I also encountered a unique vocalization type in fall of 2022, consisting of a very long series of repeated calls that we called “multiplet”, rather than doublets or triplets that is more typical of sei whales (Fig. 3). Lastly, I found no significant diel pattern in sei whale vocalization, indicating that these animals call at any hour of the day. More research needs to go into this project to better estimate sei whale occurrence and understand their behavior in Oregon but this preliminary work provides a great baseline into what sei whales sound like in this part of the world. In the future, the GEMM lab intends on implementing more hydrophone data and work on developing an automated detection system that would identify sei whale calls automatically.

Figure 2. Spectrogram of typical sei whale calls detected in acoustic data
Figure 3. Spectrogram of unique sei whale multiplet call type
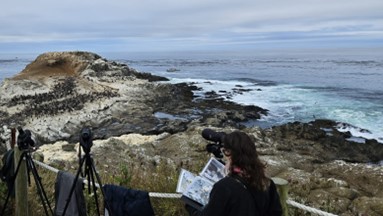
Figure 4. My first time conducting fieldwork! I spent a few mornings assisting Dr. Rachel Orben’s group in surveying murre and cormorant nests (thanks to my good friend Jacque McKay :))

My experience this summer was so formative for me. As someone who has been an aspiring marine biologist for so long, I am so grateful for my experience working with the GEMM Lab alongside incredible scientists who are equally passionate about studying the mysteries of the ocean. This experience has also piqued my interest in bioacoustics and I plan on searching for other opportunities to explore the field in the future. Aside from growing professionally, I learned that I am more capable of tackling and overcoming obstacles than I had thought. I was afraid of entering a field that I knew so little about and was worried about failing and not fitting in. My anxieties were overshadowed by the welcoming atmosphere at Hatfield and I could not have asked for better people to work with. As I was searching for sei whale calls this summer, I suppose that I was also unintentionally searching for my voice as a young scientist in a great, blue field.

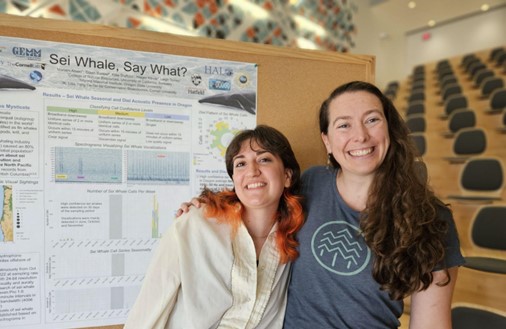
Figure 5. My mentor, Dr. Dawn Barlow, and I with my research poster at the Hatfield Marine Science Center Coastal Intern Symposium

Did you enjoy this blog? Want to learn more about marine life, research, and conservation? Subscribe to our blog and get a weekly alert when we make a new post! Just add your name into the subscribe box below!

Loading

References:

Nieukirk, S. L., Mellinger, D. K., Dziak, R. P., Matsumoto, H., & Klinck, H. (2020). Multi-year occurrence of sei whale calls in North Atlantic polar waters. The Journal of the Acoustical Society of America, 147(3), 1842–1850. https://doi.org/10.1121/10.0000931

McDonald, M. A., Calambokidis, J., Teranishi, A. M., & Hildebrand, J. A. (2001). The acoustic calls of blue whales off California with gender data. The Journal of the Acoustical Society of America, 109(4), 1728–1735. https://doi.org/10.1121/1.1353593

Español-Jiménez, S., Bahamonde, P. A., Chiang, G., & Häussermann, V. (2019). Discovering sounds in Patagonia: Characterizing sei whale (<i>Balaenoptera borealis</i>) downsweeps in the south-eastern Pacific Ocean. Ocean Science, 15(1), 75–82. https://doi.org/10.5194/os-15-75-2019

Rankin, S., & Barlow, J. (2007). VOCALIZATIONS OF THE SEI WHALE BALAENOPTERA BOREALIS OFF THE HAWAIIAN ISLANDS. Bioacoustics, 16(2), 137–145. https://doi.org/10.1080/09524622.2007.9753572

Burnham, R. E., Duffus, D. A., & Mouy, X. (2019). The presence of large whale species in Clayoquot Sound and its offshore waters. Continental Shelf Research, 177, 15–23. https://doi.org/10.1016/j.csr.2019.03.004

Exploring the Western Antarctic Peninsula  

By Abby Tomita, undergraduate student, OSU College of Earth, Ocean, and Atmospheric Sciences, research intern in the GEMM and Krill Seeker Labs

This February, during the winter term of my third year at Oregon State, I was presented with a once-in-a-lifetime opportunity. After spending the last year studying the zooplankton krill as part of Project OPAL, I was invited to spend the austral winter season doing research on Antarctic krill (Euphausia superba) under supervision of experts Dr. Kim Bernard and PhD student Rachel Kaplan. Additionally, we were lucky enough to participate in two research cruises along the Western Antarctic Peninsula (WAP). 

Figure 1. Sailing into the sunset on the RV Laurence M. Gould.

Unsurprisingly, it is no easy feat getting to the bottom of the world. After an incredibly thorough physical qualification process and two days of air travel from Portland, Oregon, we reached the lovely city of Punta Arenas, Chile. It was such a relief to arrive – but we were only halfway there. The next portion of our trip was the one that I was most anxious about, especially as someone who is prone to seasickness: crossing the Drake Passage. This stretch of the ocean, from the southernmost tip of South America to the Antarctic Peninsula, is notoriously treacherous as water in this area circulates the globe completely unobstructed by land masses. I soon learned the value of scopolamine patches and nausea bracelets, which helped me immensely through this five day journey. From Punta Arenas, we boarded the RV Laurence M. Gould, along with a seal research team from the University of North Carolina Wilmington. They were headed down south to look for crabeater seals to better understand not only their physiology, but also their role in the trophic ecology of the WAP. 

The Passage was rough, but not as terrible as I expected. The hype around it made me think I’d be faced with something as menacing as the giant wave from The Perfect Storm, and while the rocking and rolling of the ship was far from pleasant, my nausea aids, as well as the amazing people and vast selection of movies on board made it manageable. Despite being extremely nervous for the Passage, I was also very excited to celebrate my twenty-first birthday during it. It was a memorable, although untraditional birthday experience that was made all the more special by my friends on the ship who took the time to celebrate the day as best as we could. 

Figure 2. Taking in the sights of the Neumayer Channel with Kim!
The morning that we reached the Bransfield Strait was something truly unforgettable. Up until that point, I knew our destination was Antarctica, but I couldn’t really wrap my head around it because it was such a distant place and concept to me. I remember walking out onto the starboard side of the second level deck and seeing huge mountains out in the distance. For some reason, I had never considered how massively tall the mountains of the peninsula are, and just the fact that there were mountains down here at all. I joined the others at the bow, where we stood for hours in awe at the first land we had seen in days. Though many of the other scientists and crew members on board had been to this icy continent before, this was my first time, and I was in a state of disbelief. We’d finally made it and it sunk into me that I was in Antarctica, and that I would be here for the next five and half months.

After a day of hiding from strong winds in the Neumayer Channel, we were able to dock at Palmer Station (the smallest of the three US research bases in Antarctica) for our first port call, and seeing Palmer for the first time was just as exciting as seeing the continent. It looked so small at first, especially with the glacier and mountains looming behind it. Once the ship was tied up, orientation began. The station manager came onto the ship to give us an overview of what we could expect on station and the general Palmer etiquette. Next, we were given a tour of the facilities, from the lab spaces and aquarium room, up through the galley/dining area, past the hot tub and sauna, and into the lounge and bar in the GWR (Garage, Warehouse, and Recreation) building. I was surprised at how cozy the station was on the inside. In pictures, the buildings’ exteriors looked similar to the outside of a metal shipping container, but the inside was welcoming and warm. Those of us staying on station then sat through several hours of a more detailed orientation that somehow wore us out despite sitting in comfy recliner sofas the whole time. After sleeping on the rocking ship for about a week, I had some of the best sleep of my life that first night at Palmer Station.

Figure 3. Arriving at the Palmer Station pier in the first morning light.

Our first research cruise started a few days after arriving at Palmer, and just like that, we were off to explore the Southern Ocean. This leg of the trip took us south, down to Marguerite Bay and the region of Alexander Island, for ten days. The views were just spectacular everywhere we went, and it was so humbling to step out onto the deck to see gigantic mountains all around the ship. By day, us “krillers”, as our team is known, camped out on the bridge of the ship with the seal team, where we looked for sea ice floes with lounging crabeater seals. By night we conducted CTD casts, filtered water for chlorophyll, and deployed nets to catch our favorite tiny crustacean critters, along with any other zooplankton in our track. Unfortunately for both our group and the seal team, many areas that we visited were not frequented by krill or crabeater seals, though the seal team did successfully study and tag one seal over the course of the first cruise. 

Figure 4. Rachel (right) and I (left) filtering water for chlorophyll on the LMG. 

One of the highlights of this leg of the cruise was our Crossing Ceremony, as we’d crossed the Antarctic Circle (approximately 66.5ºS) shortly after leaving Palmer station. Myself and six others were crossing for the first time, so to earn our “Red Noses”, we had to pay tribute to King Neptune and his court. It would not be a Crossing Ceremony without at least some light pranking, so when they brought us out individually to the main deck, I knew something was coming our way.

Figure 5. Taking a celebratory picture with King Neptune’s court…with a surprise after.

The ten days flew by, and when we arrived back on station, we had less than a week to prepare for our next excursion on the LMG, which would be fifteen days. The time back at Palmer went quickly as we organized our lab space and entered data from the first cruise. The ship came back once more and we were off, this time heading north along the Peninsula to the Gerlache Strait. The sights were as breathtaking as ever, and I was excited to be back with my friends from the ship. 

Figure 6. Kim (left) and I (right) pour krill we caught into an XACTIC tank.

Our first day of transit was through the Lemaire Channel, one of the most stunning areas that we passed through (check out the photo gallery at the end of this post!). We spent the majority of the day on the bow and the deck of the bridge taking in the beautiful towering mountains on either side of the narrow channel and watching for penguins and humpbacks, of which there were many. This voyage segued into an extremely productive night of science for us where we caught thousands of krill that we were able to keep live in tanks on the ship, in preparation for later use for our experiments on station. Our first productive night of science was auspicious for the rest of the cruise as we caught and processed thousands more krill, and the seal team had a much more fruitful experience finding crabeater seals (they found/worked on 8 seals and named them all after fruits!). The highlight of this second cruise for me was getting to accompany the seal team onto an ice floe in the Lemaire Channel to assist them in their work on the crabeater, a female juvenile who they named Mango!

Figure 7. Watching Mango’s nose to calculate and record her breaths per minute (US NMSF Permit #25770).

Returning to Palmer for the final time on the LMG was just as exciting as arriving the first time, especially with the knowledge that we’d have one last night of celebration with our friends from the ship at the Cross Town Dinner – a night to celebrate the solstice with both the Palmer crew and LMG crew. Although the dinner and subsequent party were a blast, I felt a lingering sadness knowing that the majority of the people I spent almost two months with would be heading north, back to their respective homes while Kim, Rachel, and I stayed at Palmer for the next few months. The next day, after saying our goodbyes, the three of us stood on the Palmer pier with tears streaming down our faces, waving frantically at the ship to our friends on the deck. In spite of my sadness, I knew that the coming months would be a thrilling series of new experiences in one of the most magical and special places that I have ever had the pleasure of being in. 

Figure 8. The LMG departs Palmer Station for the last time this winter! 

Loading