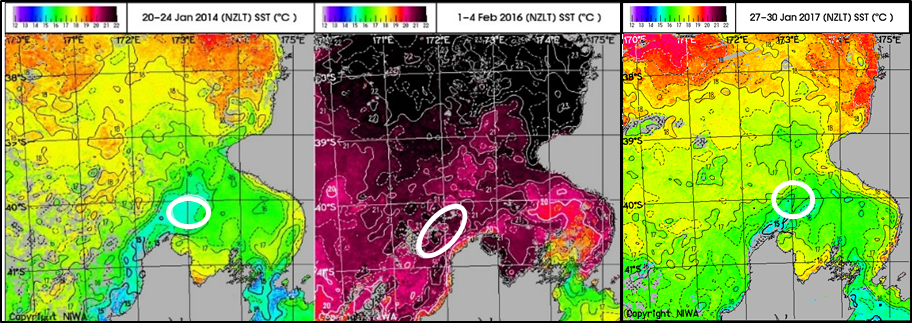
Sea surface temperature maps of the South Taranaki Bight region in each of our three study years. The white circles indicate where most blue whale sightings were made in each year. Note the very warm temperatures in 2016, and more westerly location of blue whale sightings.
