The Garden Ecology Lab is releasing a series of plant profiles of the top 10 Oregon native plants for pollinators, based on Aaron Anderson’s 2017-2019 field trials of 23 Oregon native plants. We will feature one plant per week for 10 weeks, this is week 5! Profiles will include photos, planting information, and will highlight common pollinators of each plant.
Special Traits: Moderately drought tolerant, deer and rabbit resistant
Light requirements: Prefers full sun, but tolerates some shade.
When to plant: Plant starts in the Spring, or sow seeds directly in the Fall.
Pollinator Facts
Canada goldenrod provides both nectar and pollen to its insect visitors.
In Aaron’s research, Canada goldenrod was found to be associated with a species of long horned bee, Melisoddes microstictus and bees from the genus Bombus (bumblebees).
Other common visitors to Canada goldenrod are Northern Checkerspot butterflies, Field Crescent butterflies, Wavy-Lined moths, and Common Grey moths.
Bumble bee visiting Canada Goldenrod. Photo by Signe Danler
*A Note on Taxonomy
Canada goldenrod is often treated as a complex, or group of species, under the scientific name Solidago canadensis. In western North America, the complex includes S. elongata, S. lepida, and S. altissima. Tall goldenrod, S. altissima, is not native to Oregon, so when we refer to Solidago canadensis in Oregon, this only includes S. lepida “Cascade Canada Goldenrod” and S. elongata “Western Goldenrod”.
Goldenrods (the genus Solidago) are known to be a very difficult plant to identify to species, because they have a great amount of variation in their morphology within even a single species. To avoid any concerns about what species you’re getting when sourcing goldenrod or other native plants, we highly recommend purchasing plants from a local native plant nursery or grower that sources their seeds within your region!
Canada Goldenrod’s Native Range in Oregon
Cascade Canada Goldenrod
Western Canada Goldenrod
Oregon is home to Solidago lepida "Cascade Canada Goldenrod" and Solidago elongata, "Western Canada Goldenrod". Both of these species are found throughout Oregon, though they were previously thought to be geographically distinct.

Maps and legend acquired from the Oregon Flora Project, with Imagery Sourced from Google.
Canada Goldenrod as a pollinator plant
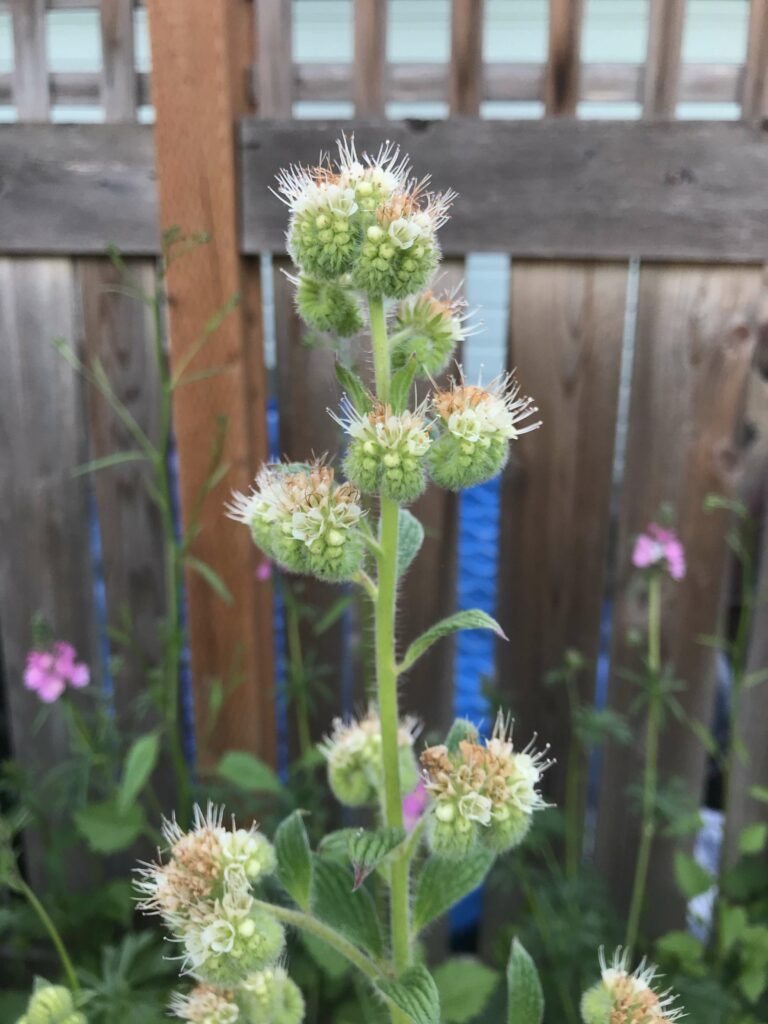
Canada goldenrod grows in prairies, meadows and riparian areas across Canada and the United States. Great for erosion control, hedgerows and pollinator gardens, Canada goldenrod will fill space with hardy foliage year round and present a showy display of golden flowers in the late summer. The pyramidal inflorescences are lined with tiny composite flowers that brim with nectar and pollen. Goldenrod supports many late season butterflies, moths, bees, beetles and some wasps.
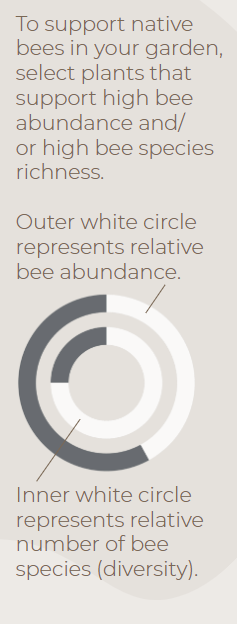
Goldenrod is a wonderful late-flowering plant for pollinators; it hosts a moderate abundance and a high diversity of insect visitors. During its peak bloom, you can often find numerous different insects foraging on goldenrod. We love combining goldenrod with Douglas aster for a beautiful late-season floral display of yellow and purple, though it also compliments shorter annual species as well.
Infographics developed by LeAnn Locher, Aaron Anderson, and Gail Langellotto.
Abundance and Diversity Calculations. Bee abundance was calculated using estimated marginal means of bee visitation to each of our study plants from 5-minute observations conducted from Aaron’s 2017-2019 field seasons. Estimated marginal means (EM Means) were assigned to categorical values and averaged across years to yield the following categories: 0% = Very Low =EM mean below 0.49; 25% = Low = EM mean of 0.50 to 0.99; 50% = Moderate = EM mean of 1 to 1.49; 75% = High = EM mean of 1.50 to 1.99; and 100% = Very high = EM mean above 2.0.
Bee diversity was based on the total sum of species collected on each of our study plants from 2017 to 2019. A Chao 2 Estimator was used to estimate total expected species richness for each plant; Chao 2 estimates were then used to create categorical values, as follows: 0% = Very Low = 9.99 or lower; 25% = Low = 10 to 14.99; 50% = Moderate = 15 to 19.99; 75% = High = 20 to 24.99; 100% = Very high = 25 or higher.
Did you know?
Although this goldenrod is often blamed for people’s late summer allergies, the culprit is in fact ragweed! Ragweed and goldenrod have different pollination styles: ragweed produces masses of airborne pollen in an attempt to reach other ragweed plants by wind. Since goldenrod has evolved with pollinators to carry its pollen in a targeted fashion, goldenrod produces less pollen, very little of which is airborne.
Canada goldenrod has additionally been used as a plant medicine in many cultures; it was used as a substitute for English tea during the American Revolution for its pain-relieving and diuretic effects. Goldenrod flowers are edible and make a colorful garnish that make a beautiful addition to garden salads.
Photos from the field
Photo by iNaturalist User craigmartin
Photo by iNaturalist User matthias55
Photo by iNaturalist User crwrcwamt
Photo by iNaturalist User suzannehale
Photo by Signe Danler
Photo by Signe Danler
Photo by Signe Danler
Photo by Signe Danler
Photo by Signe Danler
Tune in next week for the next edition of our Pollinator Plant PR Campaign.
The Garden Ecology Lab is releasing a series of plant profiles of the top 10 Oregon native plants for pollinators, based on Aaron Anderson’s 2017-2019 field trials of 23 Oregon native plants. We will feature one plant per week for 10 weeks, this is week 4! Profiles will include photos, planting information, and will highlight common pollinators of each plant.
Life Cycle: Biennial/ annual, typically grown as an annual in Oregon
Growth Habit: Upright, mounding
Bloom Duration: April – July
Hardiness Zone: 3-7
Special Traits: Shade tolerant, drought tolerant
Light requirements: Full sun to part shade
When to plant: Seeds should be sown in the fall, starts may be planted in the fall or spring after the last chance of frost.
Pollinator Facts
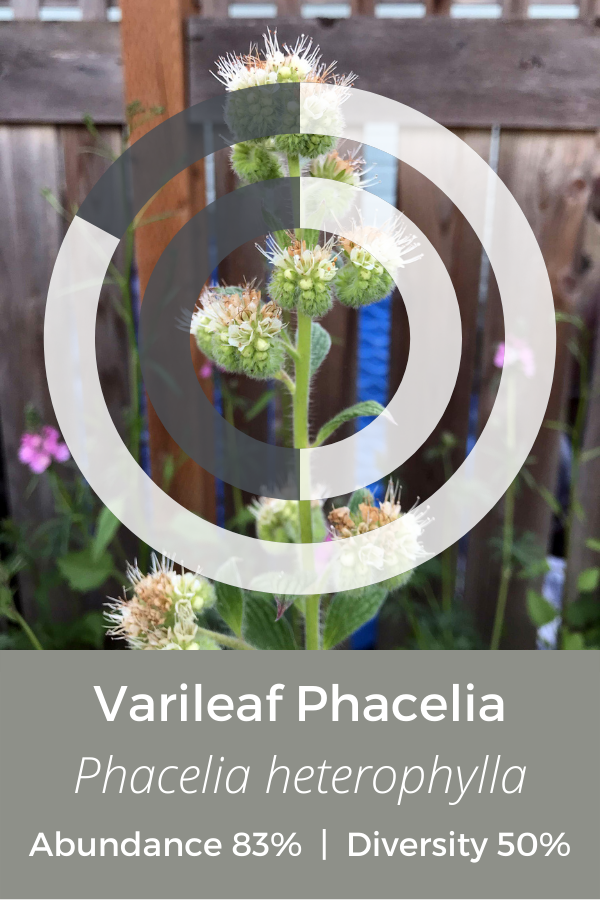
Varileaf Phacelia provides both nectar and pollen to its insect visitors.
Phacelia was found to be associated with five bee species in Aaron’s research: the obscure bumblebee (Bombus caliginosus), Edward’s long-horned bee (Eucera edwardsii), the fuzzy-horned bumblebee (Bombus mixtus), the confluent miner bee (Panurginus atriceps), and the yellow-faced bumblebee (Bombus vosnesenskii).
Phacelia is also a larval host for 4 moths: the Bilobed Looper Moth (Megalographa biloba), the Geranium Plume Moth (Amblyptilia pica), the Orange Tortrix Moth (Argyrotaenia franciscana) and Clepsis fucana1.
Photo by Aaron Anderson
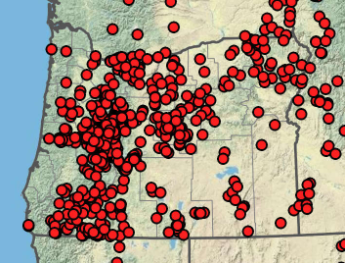
Varileaf Phacelia‘s Native Range in Oregon
Phacelia heterophylla is native to most of the Western United States – From Washington to California, east to Montana and south to New Mexico. It is additionally native to Canada, where it is currently considered “imperiled” by the IUCN red list2.
Varileaf Phacelia's native range covers nearly the entire state of Oregon! It's native habitat includes moist conifer forests, riparian areas, sagebrush, mountain brush, as well as in aspen and fir communities3.
Maps and legend acquired from the Oregon Flora Project, with Imagery Sourced from Google.
Varileaf Phacelia as a pollinator plant
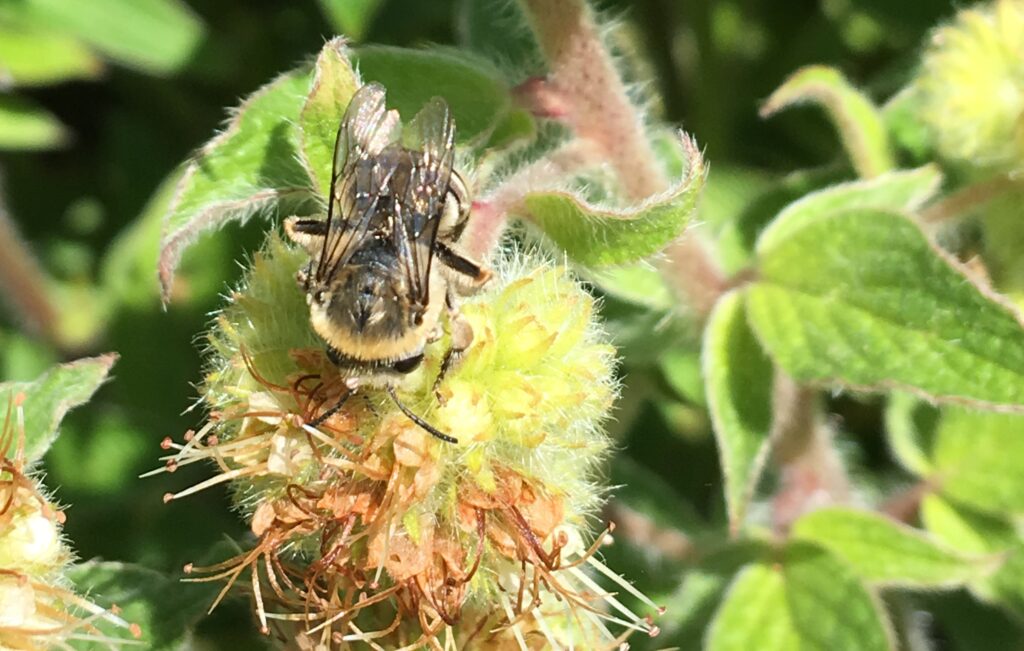
A female long-horned bee (Eucera sp.) searches for some leftover forage on a spent Phacelia heterophylla inflorescence. Photo by Aaron Anderson.
Varileaf Phacelia is the epitome of an underappreciated pollinator plant! This annual with petite white flowers attracts both an abundance and diversity of insect visitors. With stamen that stick out of the corolla, it heavily advertises its nutritious rewards, attracting plenty of busy bees. In fact, it commonly hosted 5 different bee species in Aaron’s field surveys, including three charismatic bumblebee species, one of which is currently listed as “vulnerable” on the IUCN Red List: Bombus caliginosus, the obscure bumblebee4.
Infographics developed by LeAnn Locher, Aaron Anderson, and Gail Langellotto.
Abundance and Diversity Calculations. Bee abundance was calculated using estimated marginal means of bee visitation to each of our study plants from 5-minute observations conducted from Aaron’s 2017-2019 field seasons. Estimated marginal means (EM Means) were assigned to categorical values and averaged across years to yield the following categories: 0% = Very Low =EM mean below 0.49; 25% = Low = EM mean of 0.50 to 0.99; 50% = Moderate = EM mean of 1 to 1.49; 75% = High = EM mean of 1.50 to 1.99; and 100% = Very high = EM mean above 2.0.
Bee diversity was based on the total sum of species collected on each of our study plants from 2017 to 2019. A Chao 2 Estimator was used to estimate total expected species richness for each plant; Chao 2 estimates were then used to create categorical values, as follows: 0% = Very Low = 9.99 or lower; 25% = Low = 10 to 14.99; 50% = Moderate = 15 to 19.99; 75% = High = 20 to 24.99; 100% = Very high = 25 or higher.
In a survey of gardeners conducted by Aaron and the Garden Ecology Lab, Phacelia heterophylla ranked last among 23 native plants scored for their aesthetic appeal. It may appear “weedy” to some gardeners, but as an annual, it could easily be interspersed with more attractive annual face flowers (such as California poppy, meadowfoam, farewell to spring, or baby blue eyes) to create a colorful and nutritious pollinator garden. Varileaf Phacelia is also a great native annual to include in dryland pollinator gardens, considering it is drought tolerant and able to grow in both nutrient poor and rocky soils.
Varileaf Phacelia also has the common name "Variegate Scorpionweed", and the pictures above can show you exactly why! It's flowers are borne on elongated stems which are tightly curled, similar to a fiddlehead from a fern! The flowers bloom from the base to the apex of the stem, and the "scorpion tail" slowly unravels as the blooms travel up the stem.
Photos from the field
Can you spot the yellow-faced bumblebee? Photo by Aaron Anderson
Photo by iNaturalist user Suzanne11
Varileaf Phacelia can occasionally have purple blooms (rare, specimen from Argentina). Photo by iNaturalist user Claudia Komesu
Photo by iNaturalist user Eric_Hough
Female long-horned bee (Eucera sp.) searching for forage! Photo by Aaron Anderson
Photo by Aaron Anderson
Photo by Aaron Anderson
Of all of the plants we highlight in this 10-week series, Varileaf Phacelia is the one plant that Gail regularly says is in great need of it's own public relations (PR) team. The goal of these plant profiles is to share information and photos of these plants that might convince readers to love this plant as much as we (and the bees) do!

Let us know which plants have caught your eye, or those that may still take some convincing, by leaving a comment below! 🐝
Tune in next week for the next edition of our Pollinator Plant PR Campaign.
Field season wrap up is underway in the butterfly bush plot, and there is so much to reflect on this year! The team has had a very productive summer, and as these bushes are better established and have reached their full spread and height, they have become more attractive to pollinators. As a reminder, the butterfly bush (Buddleja spp.) test plot consists of 34 butterfly bush cultivars of ranging fertility, habit, and breeding complexity. We have 6 -9 replicates of each individual cultivar, totaling 222 plants in the complete replicated block. The plot represents all the past and present (yes, we have some experimental cultivars) breeding that has been conducted to reduce fertility and hopefully invasiveness of Buddleja davidii. Much of that breeding centers around interspecific hybridization (breeding between 2 or more species in the same genus), so our plot represents hybridization of 7 different Buddleja species!
This summer we conducted pollinator observations the same as last year. This consisted of 5-minute timed counts at each location in full flower (we are calling full flower 50% or more of the buds or flowers on the individual plant are fully open) each week. During the timed count, we identify all visitors to morphology- which is simply differentiating between honeybees, bumblebees, butterflies, and other morphotypes. This presented new challenges this year because of the sheer mass some of our plants have reached! Though they were spaced 8 feet apart on all sides at planting, some have grown in together, making access an occasional issue. Many of the full-sized cultivars also reach well over my head, presenting more challenges in accurate counting. The team pushed through these difficulties, and by the end of the season we had counted 7,597 individual visitations on the plot. This is over 2,000 more than last year! You can view overall visitations by cultivar for both the 2020 and 2021 seasons below.
Though all the cultivars were most frequently visited by honeybee cultivars in 2020, three cultivars in 2021 were most frequently visited by bumblebees. Most notably the cultivar ‘Honeycomb’ attracted far and away more bumblebees than any other cultivar, and most of the visitors were male. Not only does ‘Honeycomb’ seem to be very attractive while sampling, it has an extremely long bloom season in comparison to the other cultivars in the study. It will bloom steadily from mid-June until the first deep frost of the season. Generally, there is an uptick in visitation across all the cultivars in 2021 as compared to 2020. Keep in mind the plants were substantially larger this season compared to last, meaning larger floral displays which are more attractive to pollinators.
‘Honeycomb’ in full bloom…on October 29th, 2021
In addition to pollinator observations, we collected nectar volume data for all 34 cultivars and attempted to collect pollen from a low and high fertility cultivar respectively. Tyler and Mallory were instrumental in getting nectar volume estimates collected, you can see them pictured below probing individual flowers with microcapillary tubes. Pollen collection turned out to be a very time-consuming process because there wasn’t a good alternative to good old hand collection. After about 80 hours of labor on the project, we were still a ways off of our mark, so we needed to reassess our methodology. More to report on that next year I’m sure.
Mallory probing a single flower for nectar with a microcapillary tube
Tyler measuring the column of liquid in a finished microcapillary tube.
Svea Bruslind and Jen Hayes also helped me take filtered photos of all my cultivars this season. You can read more about Svea’s excellent photography skills in her post ‘A Bee’s Eye View: UV photography and bee vision‘ but I’m sure the photographs she took of my cultivars in ‘Bee Vision’ will prove useful in understanding patterns of attraction out on the plot. Scroll through the pictures below to see examples of Svea’s work, in order of pollinator attraction in the 2021 field season.
‘Honeycomb’
‘Blue Chip’
‘Buzz Sky Blue’
‘Groovy Grape’
This time of year, focus returns to the relative fertility portion of my study. This means time in the greenhouse monitoring controlled crosses I made over the summer, sowing seeds from the field and counting respective seedlings. This robust dataset will allow us to calculate relative fecundity of all our cultivars in both male and female roles, important information in assessing invasive species legislation.
Our second field season studying pollinator visitation to Oregon native plants and native cultivars spanned from April to late September of 2021, although if Douglas Aster had any say in the matter, we would likely still be sampling. The densely blooming Symphyotrichum subspicatum continued to produce a smattering of new flowers through November of last year, and we predict it will do the same this year, too!
Our field crew this summer included Tyler, Svea, Mallory and I. Together, we sampled on 33 different dates across the growing season, allowing us to collect around 2000 physical pollinator specimens, and observe 6,225 unique interactions between pollinators and our study plants! This season we conducted floral trait measurements (including the dimensions of flowers), took multispectral photos, and additionally collected pollen from a subset of our study plants.
From left to right: Mallory vacuum-sampling off of Douglas Aster 'Sauvie Snow', Tyler shaking a farewell-to-spring flower to get pollen off of it, and Svea photographing Baby Blue Eyes 'Penny Black'.
This year, we introduced a third cultivar for California poppy (Eschscholzia californica ‘Purple Gleam’), yarrow (Achillea millefolium ‘Moonshine’), and farewell-to-spring (Clarkia amoena ‘Scarlet’). The new cultivars were established in the spring, which resulted in a late bloom for the annuals, so we expect to see them blooming during their typical period in 2022. The Achillea ‘Moonshine’ replaced Achillea ‘Salmon Beauty’ in being the most abundant yarrow cultivar; it began blooming almost immediately as it was planted into our field site and is still continuing to push out blooms through October alongside the Douglas Asters.
The plant groups in our study: the larger circles with orange text are the native plants, and the smaller circles and turquoise text are the cultivars. The top row contain the perennials yarrow, western red columbine, great camas, and Douglas aster. The bottom row shows the three annuals farewell-to-spring, California poppy, and baby blue eyes.
In addition to watching new plants bloom in the study garden, we had the opportunity to observe many incredible pollinators in the field this summer. We saw a hummingbird visit the Western Red Columbine, we tried to capture videos of leaf-cutter bees snipping little petal pieces off of farewell-to-spring, and at a neighboring plot we observed a male wool-carder bee section off an entire patch of Salvia for a female bee.
On the left: Farewell-to-spring 'Scarlet' with crescents cut out of the petals by leafcutter bees. Top right: A female wool-carder bee (Anthidium manicatum) collecting trichomes from Yarrow 'Calistoga'. Middle right: A leafcutter bee with a piece of petal from Farewell-to-spring 'Dwarf White'. Bottom right: A leaf cutter bee removing a piece of petal from Farewell-to-spring 'Aurora'.
We were also able to take a couple educational field trips this field season in order to learn about pollinator studies ongoing outside of Oak Creek. In June, we went up to the North Willamette Research and Extension Center in Aurora, OR to listen to three talks about pollinators at the Blueberry Field Day. We learned how to score the productivity of honeybee hives, how to properly don a the top of a bee suit, about blueberry’s best pollinators, and blueberry research projects at the University of Washington.
In August, we made a trip to Bend for a different kind of study… an artistic one! We travelled to the High Desert Museum in order to visit Jasna Guy and Lincoln Best’s exhibit “In Time’s Hum…”. Jasna is a brilliant artist inspired by pollinators, which translates into the subject of her pieces as well as her artistic media. Many of her pieces are made using encaustic (a method of painting using wax, bee’s wax in her case!), dipped directly into bee’s wax, or involve pollinators in some other format, including her color study of pollen, which attempts to replicate the colors of fresh pollen as well as the colors after bees have mixed them with nectar. In the center of exhibit were two cases filled with bees collected and identified by Linc, surrounding some of the dried plant specimens they forage on.
These field trips were a wonderful way to see what other pollinator work is happening in our broader community and to inspire future studies. It was especially exciting to see how Jasna and Linc combined art and science with their exhibit, which is something many of us in the Garden Ecology Lab are interested in.
1. Mallory, Svea, and Jen at the blueberry Field Day. 2. Svea, Jen, Mallory, and Tyler at the High Desert Museum. 3. A panorama of the "... In Time's Hum ... " exhibit. 4-5. Art on the outside of the exhibit. 6. A snapshot of two pollen samples from Jasna Guy's pollen color study.
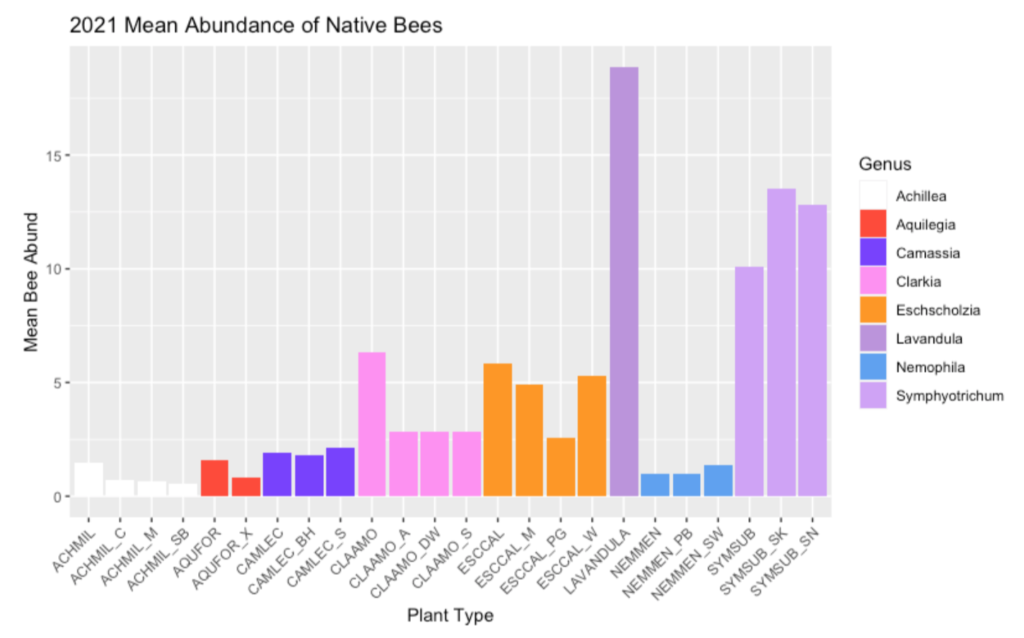
While we cannot make conclusions until we complete our final field season, we are excited to report some of the variation in visitation between native plants and native cultivars that we have observed in our first two field seasons. In the first field season, our observations of native bees foraging on the study plants revealed three plant groups to have variable amounts of visitation. Yarrow, farewell-to-spring, and California poppy all had at least one cultivar that received substantially less native bee visits than the native type. In our second year, all three of farewell-to-spring’s cultivars received less visitation than the native Clarkia amoena. Poppy had only one cultivar with less native bee activity than the native (Purple Gleam), and in the case of Douglas Aster, both of the cultivars actually had more visitation by native bees than the native.
Figure 1: Average Abundance of Foraging Native Bees during 5-Min Observations in 2021. Individual plants are color-coded by genus. The naming scheme combines the first three letters of the genus and specific epithet; cultivars are denoted by an underscore and a 1-2 letter code to identify them. For example, AQUFOR is the native Aquilegia formosa, and AQUFOR_XT is Aquilegia x ‘XeraTones’.
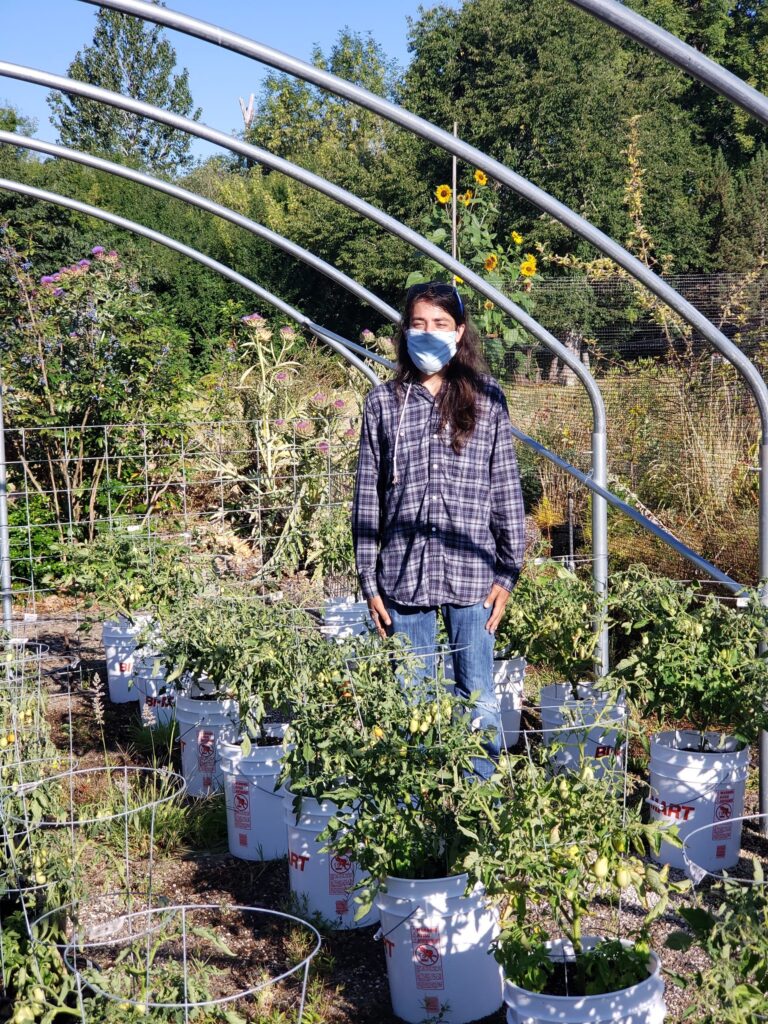
Today, Tyler successfully defended his undergraduate research thesis, entitled ‘Invest in Vegetables: A Cost and Benefit Analysis of Container Grown Roma Tomatoes (Solanum lycopersicum cv. ‘Roma’) and Italian Basil (Ocimum basilicum cv. ‘Italian’)‘.
Tyler Spofford, in the middle of his containerized garden research plot, in the summer of 2020.
His research was inspired by the rush to vegetable gardening, that many households made during the start of the COVID-19 pandemic. Research has shown that there are many benefits to vegetable gardening, including social, emotional, physical, and financial. However, those in rental housing, or otherwise without easy access to land, were largely locked out of accessing these benefits.
Although previous research has shown that in-ground and raised bed vegetable gardening can yield positive economic benefits, to date, no studies (that we know of) have quantified the financial costs and benefits of growing vegetables in containers. Tyler thus set up a system of 5-gallon and 3-gallon bucket gardens, planted with Roma tomatoes, or Roma tomatoes plus Italian basil. He kept careful track of the cost of materials, and the time he spent gardening. He also kept careful track of the harvest he pulled off of each container.
Over the course of his study, he successfully learned about and fought back Septoria leaf spot, and blossom end rot. We learned that Roma tomatoes, in particular, are susceptible to blossom end rot. On top of these horticultural plant problems, Tyler’s research was abruptly halted by the late summer wildfires of 2020, that made air quality unsafe for him and others to continue their work, outdoors.
Despite these challenges, he was able to glean enough data from his project, to share some interesting findings:
None of the containers netted a positive economic benefit, in the first year of gardening, largely because the cost of materials outweighed the financial benefits of the harvest.
If the project were continued into year two, he projects that he would have had a positive financial outcome for the tomatoes grown with basil, in the 5-gallon containers.
Across the course of the season, he only spent 30 minutes tending to each container. Because he had few garden maintenance tasks, the time invested in container gardens was minimal. This is an important finding, for folks who may shy away from gardening because of lack of time.
As expected, the 5-gallon containers yielded more than the 3-gallon tomatoes. The 3-gallon containers stunted plant growth too much, to recommend them as a viable container gardening system. [As a side note, we were given the 3-gallon containers, for free, which is why we included them in the study.]
The fair market value of Roma tomatoes was fairly low (~$1.00 per pound). Thus, the net economic benefit of growing Roma tomatoes was also low. Basil, on the other hand, was a high value specialty crop that helped to raise the overall economic value of crops harvested from the buckets.
If you are interested in seeing Tyler’s thesis defense presentation (~30 minutes), you can do so, at the link below.
Tyler will be graduating in a few days, with a degree in BioResource Research from OSU! He’s worked in our lab group for two years, and has been an absolute joy to learn and work with. We wish him the very best on the next adventures that await him.
In this post, I cover the 2009 paper, “Impact of native plants on bird and butterfly biodiversity in suburban landscapes,” by Karin Burghardt, et al.[i]
*************
This study was published shortly after the first edition of Doug Tallamy’s book, Bringing Nature Home: How Native Plants Sustain Wildlife in Our Gardens.[ii] After decades of studying host plant records of butterfly and moth species, Tallamy was convinced that native plants were critically important to wildlife conservation. About half of all insects are herbivores, and about 70 percent of all herbivores are specialists that are only capable of feeding on a narrow range of plants (see Schoonhoven et al. 2005, Chapter 2, pages 5-9). Specialist insects have developed, over time, the ability to feed on plants that have physical or chemical deterrents that keep generalist insects at bay. Although specialist insects can feed on plants that can be toxic to other insects, they can’t easily switch to feed on novel, non-native plants.
Burghardt and Tallamy’s Study of Native Plants and Caterpillars
Tallamy was Karin Burghardt’s master’s degree advisor and one of her co-authors on the 2009 paper. In their study, they selected six pairs of suburban gardens in central Pennsylvania. Gardens were paired by size and proximity. One garden in each pair featured the conventional landscaping for this region: large lawns, Asian shrubs, Asian understory trees, and native canopy trees. The other garden was landscaped with native ornamentals at each vegetative layer: grasses, shrubs, understory trees, and canopy trees.
They counted the number of caterpillars at 12 points within each garden. Since caterpillars are herbivores, and most insect herbivores are specialists that do best on native plants, they hypothesized that they would find more caterpillars in the native plant gardens. Indeed, this is what they found. Caterpillar abundance was four times greater, and caterpillar species diversity was three times greater, in the native gardens versus the conventional gardens. In addition, Burghardt found that native plant gardens harbored more birds. In fact, native plant gardens had 55 percent more birds and 73 percent more bird species, compared to conventional gardens!
This study demonstrated that gardeners’ choices matter and can clearly influence ecological food chains. Food chains are organized into what are known as trophic levels. Organisms on the same trophic level share the same ecological function and nutritional distance from the sun. Photosynthetic plants are on the first trophic level. Herbivores, or organisms that eat plants, are on the second trophic level. Organisms that eat herbivores, such as birds, are on the third trophic level.
Burghardt and Tallamy demonstrated that what you decide to plant in your garden not only determines the structure of the first trophic level but can also cascade up to affect the second and third trophic levels. As an entomologist, I was not surprised that gardeners’ plant selections could influence the second trophic level. However, I was blown away that these decisions could cascade up to strongly influence the third trophic level.
Garden Ecology Lab Studies of Native Plants and Bees
In the Oregon State University Garden Ecology Lab, we study relationships between native garden plants and native bees. To be honest, I did not expect that native bees would prefer native plants. Whereas the leaves and other vegetative parts of a plant include an array of chemical and physical defenses to protect the plant from insect herbivores, flowers have few such defenses. In fact, flowers function to attract pollinators to a plant.
Thus I was somewhat surprised when Ph.D. student, Aaron Anderson, found that most of the native plants in his study attracted more native bees and more species of native bees than his non-native comparison plants. For example, non-native lavender ‘Grosso’ attracted a large number of bees, but most of these bees were non-native honey bees. By and large, the native plants were better for bee abundance and bee diversity, compared to the non-native comparison plants. In particular, Globe Gilia, Farewell to Spring, Oregon Sunshine, Douglas Aster, and California Poppy were all particularly attractive to native, wild bees in Aaron’s study.
Why might native bees prefer native plants, when flowers don’t have the same chemical and physical deterrents that herbivores must contend with? One hypothesis is that the nectar and pollen in native plants might provide better nutrition to native bees. Another hypothesis is that pollinators are keenly tied into the visual display of native plants. Flower color, size, shape, and ultraviolet markings are all important signals that flowers use to attract the attention of various pollinators. If there are changes in any aspect of this visual display, pollinators may no longer recognize a flowering plant as a good source of pollen or nectar.
Another OSU Ph.D. student, Jen Hayes, is trying to understand why native plants seem to be preferred by native pollinators. As part of her Ph.D. work in the Garden Ecology Lab, Jen is collaborating with an OSU photography student, Svea Bruslind. Svea uses different filters to take photographs of native plants and native cultivars in visible light, ultraviolet light, and in “bee vision” light. We are just getting started on this study, but look forward to reporting our findings in the near future.
[i]Burghardt et al. 2009. Impact of native plants on bird and butterfly biodiversity in suburban landscapes. Conservation Biology 23:219–224.
[ii] Updated and expanded version published as Bringing Nature Home: How You Can Sustain Wildlife with Natives Plants.
My name is Mallory Mead, and I am new to the Garden Ecology Lab! I am an undergrad studying Horticulture and minoring in Entomology, and I started a few weeks ago as an assistant to Jen Hayes on her study of pollinator attraction to native plants and nativars.
I enrolled in Oregon State’s URSA Engage program, which gives undergrads a taste of research experience in the Winter and Spring of their first year, and joined a project studying how mason bees might be impacted by climate change with Dr. Jim Rivers of the department of Forest Ecosystems and Society. The study seeks to examine the effects of warming temperatures on mason bee behavior and the development of brood.
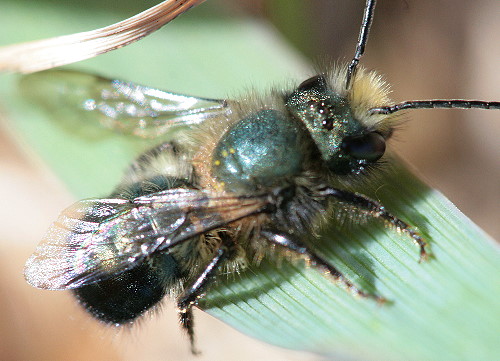
The Western US’s native species of mason bee, the Blue Orchard Bee (BOB) is known to be an excellent orchard pollinator. On many orchard crops they are more efficient at pollination than honey bees on a per individual basis, and so the commercial management of BOBs is being explored as honey bee colonies suffer management challenges and colony losses in recent years.
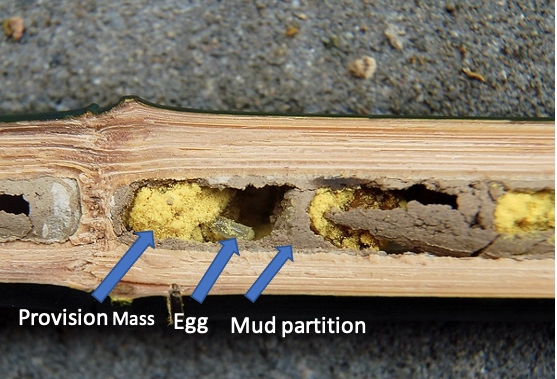
Mason bees have a short lifespan of 4 to 6 weeks. Emerging in the early spring, males die shortly after mating, while females build nests in holes in wood or reeds. They forage for pollen and nectar to form provision masses in which they lay their eggs. They also collect mud to form partitions between each provision mass and to cap the nest once it is full. Their offspring will feed on the provisions and metamorphose into cocooned adults to overwinter in their cells and emerge the following spring.
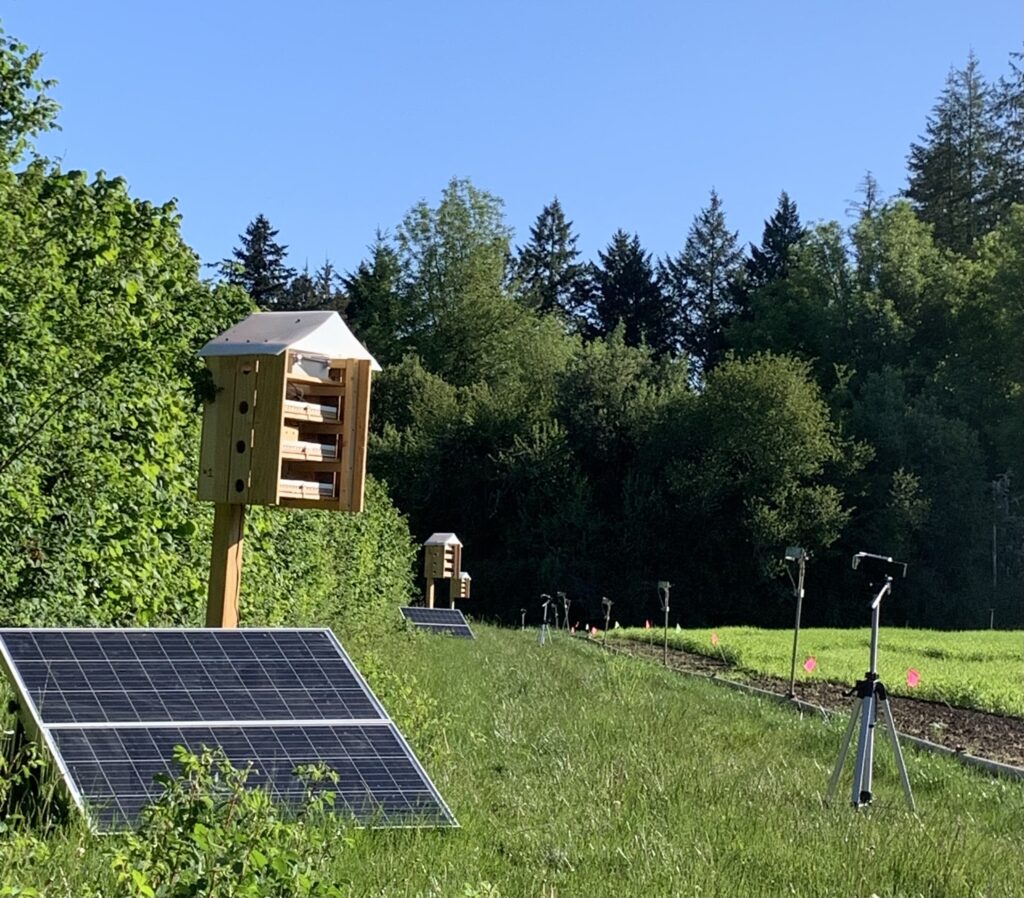
To ensure the bees had ample nutrient resources, the project was conducted next to the organic cherry orchard at OSU’s Lewis Brown Farm. Before the cherries bloomed, 6 nest structures were designed and constructed by Jim, Ron Spendal (a mason bee house conisuerrier) and Aaron Moore of Revolution Robotics.
Nest structures, solar panels, and camcorders at Lewis Brown Farm.
Each structure has 3 shelves with 16 nest holes each, lined with paper straws so that the nests can be easily removed and examined. The structures are solar powered, and each shelf is heated to a different increment above the ambient temperature i.e. + 0°C , + 2°C, + 4°C, + 6°C, + 8°C, + 10 °C, and + 12°C. These differentials represent many potential warming outcomes of climate change.
Nest Structure Number 2 with labelled component parts. A. The Electronics control box. B. Cocoon-release box. C. Shelves sandwiched by heating pads, and lined with paper nesting straws
Our Hypotheses
We predicted that female mason bees will select the warmer nests first, and that females will leave nests earlier in the morning to begin foraging because they will reach the critical internal temperature necessary for flight sooner.
If heated bees have a greater window of foraging time, then we predict they’ll be able to construct nests at a faster rate in the warmer nests.
With greater nest construction will come a greater production of offspring from the bees in the warmed nests.
But…
In terms of offspring quality, we predict that offspring of heated nests will emerge as weak individuals and mortality will be the highest for the heated brood.
…and we are pretty confident about this last prediction.
Insects are poikilothermic meaning their internal temperatures are determined by the environment. Past studies by researchers Bosch and Kemp have reported that mason bees who are overwintered at warm temperatures will “use up their metabolic reserves and are likely to die during the winter”. And a more recent study by researchers at the University of Arizona found that mason bees subjected to heating resulted in reduced body mass, fat content and high mortality of the mason bee offspring.
Data Collection
One of the latest male mason bees to emerge, surrounded by empty cocoons in the release box.
Our mason bees started hatching from cocoons in mid-April and began to colonize the nest structures. I captured video footage of the bees as they emerged in the morning to forage. If bees from heated nest sites emerge earlier, this will support our hypotheses that they reach their critical-for-flight temperature earlier, and get a leg-up on foraging compared to their neighbors.
I also conducted “nest checks” to track the rate of nest construction along with two other research assistants.
In the fall, the nest tubes will be extracted to examine the reproductive output, and in the following spring, offspring will be assessed for rates of mortality, offspring mass, and fat content.
Obstacles
Some of the challenges along the way have included dealing with insect pests. Spiders were easygoing inhabitants of the nest straws, for they only nested in empty straws, so we’d swap them out for a clean one. The earwigs were much more pervasive, and went for the already inhabited nests. As generalist foragers, the earwigs took advantage of provision balls of nectar and pollen that had not yet been sealed off by mud. Once I read that earwigs will indeed eat the mason bee eggs that are laid into the provision masses, I knew it was crucial to remove the earwigs from all nests, but these feisty creatures proved determined to stay. We ordered some tanglefoot, a sticky substance to trap the earwigs on their way up the structure post, and meanwhile I coaxed earwigs out with tiny pieces of grass. Jabbing them repeatedly would eventually provoke them to charge at the blade of grass and fall out from the straw.
Yellowjackets were another opportunistic nester. They’d sneak into the cocoon boxes to build nests, and always gave me a start when opening the tiny boxes. I removed their nests with an extended grabber tool and would destroy them in any way I could. I feel immensely lucky not to have been stung through this process.
The most terrifying surprise during the project was a fat snake that was living in the solar panel battery box. It popped out at me hissing while I conducted a routine check. Alas, I was too spooked to take on this unexpected visitor and let it leave on its own time.
Preliminary Findings & Observations
By mid-May, a pretty clear pattern was emerging. At each structure, the control shelf’s nests (+ 0 °C) were full and capped with mud, while the hottest shelves were almost completely empty. We will analyze nest check data to confirm that these patterns are not just arising by chance, but a study that was released this past April showed another species of mason bee in Poland following the same pattern of nest site preference and selection for cooler nest sites.
The mason bees’ unexpected behavior of avoiding the heated chambers may lead to trouble during the second part of the experiment because this means our sample size for heated offspring has become so tiny, but here it is important to note that this is mason bee project is a pilot study and so the data collected this year will simply influence more specific future research.
these preliminary findings make me think that mason bees have an ingrained sense to avoid warm nests, which might show mason bees’ adaptability in the face of climate change, that is, if they can manage to continue finding cool nests. People managing mason bees find that nests facing the morning sun are the most attractive to the bees, but I wonder how long it will be before temperatures rise and mason bees start avoiding these sunny nests.
Moving Forward
By the end of May, I’d only see a few the mason bees per visit, so the season was clearly coming to an end. I wrapped up data collection and am now spending the summer extracting data from the video footage, and checking up on the bees to ensure they are safe and sound until Fall inspections.
I am wishing the best to both the wild bees in our region and those in our study, as the temperatures skyrocket this week but with this summer’s heat wave, I don’t think we need to simulate climate change; it is right here before us. Even though it is practically inevitable that temperatures will rise to dangerous heights in my generation’s lifetime, there is so much life to be saved, and there is no time to waste.
“Blue Orchard Bee, Osmia lignaria” by SeabrookeLeckie.com is licensed under CC BY-NC-ND 2.0″
According to the staff at Oak Creek and many other gardeners and farmers I’ve had the opportunity to talk to, it appears that though 2020 was a difficult year for humans, it was truly a remarkable year for gophers and other rodents.
From left to right: wild type Great Camas, Camassia leichtlinii, the native cultivar ‘Sacajawea’, and the native cultivar ‘Caerulea Blue Heaven’.
Gophers & Camas
No matter how often a gopher was trapped and removed from Oak Creek last summer, the next week there would always be a mound of freshly turned soil on the grounds, indicating a new gopher had taken its place. While they seemed to enjoy popping up in some of the Organic Gardening Club’s beds, they had an extra fondness for my own experimental garden beds. Fresh gopher-turned soil was most commonly found in any plot growing our native Camassia leichtlinii (Great Camas) and the plots surrounding them.
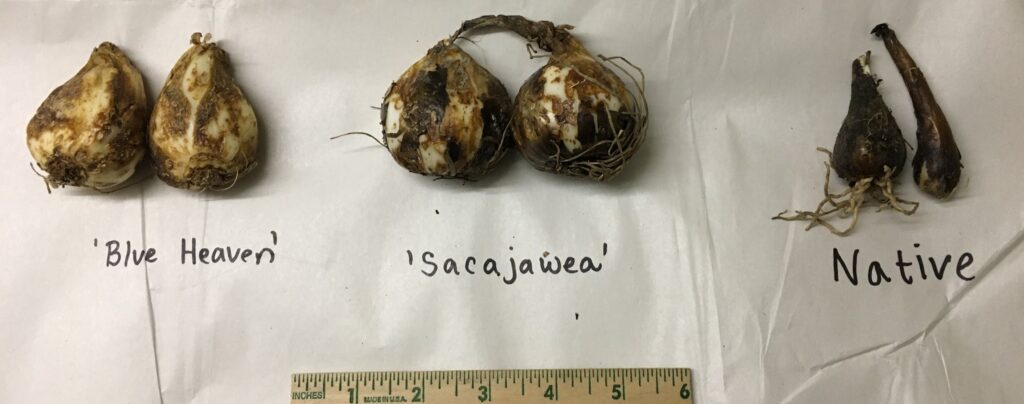
Bulb size comparisons for the three varieties included in our study.
We planted our 15 camas plots in the fall of 2019. Five plots were planted with the wild type camas species, Camassia leichtlinii (Great Camas). Five more were planted with the C. leichtlinii cultivar ‘Caerulea Blue Heaven’, and the final five were planted with C. leichtlinii ‘Sacajawea’. By the spring of 2020, the camas plots were relatively untouched, aside from some minor grazing by deer on a handful of plots. In April our three camas varieties began blooming in sequence (the native first, followed by ‘Blue Heaven’ and ‘Sacajawea’, respectively), and by mid June they had all gone to seed.
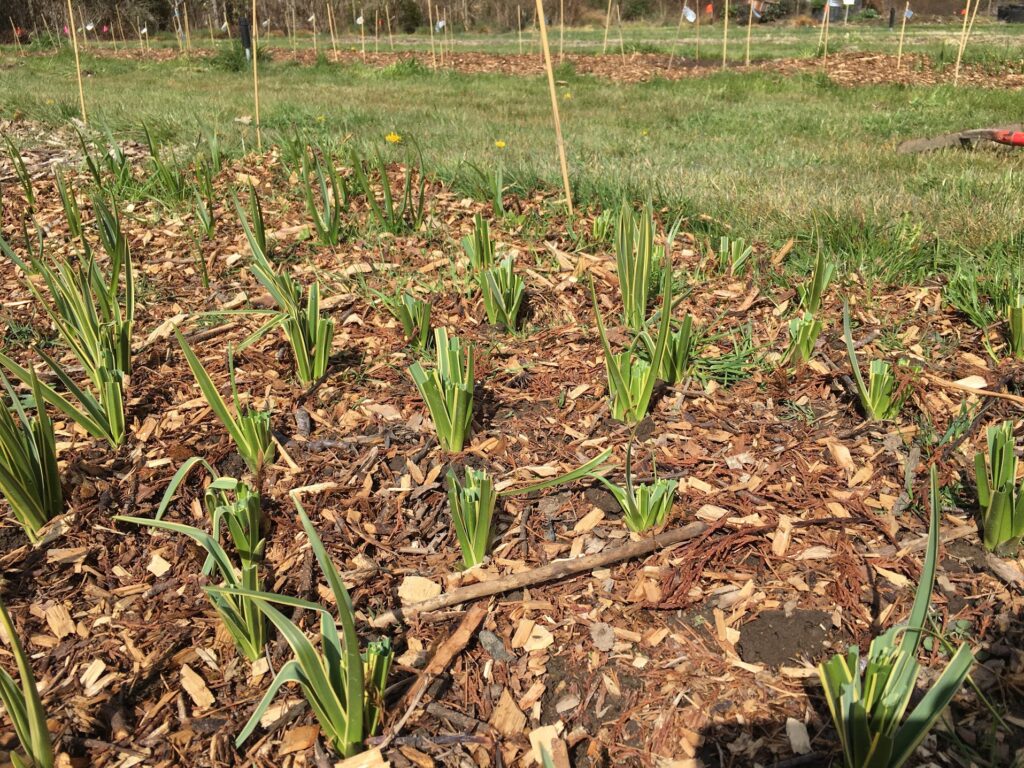
Deer browsing on early spring shoots of C. leichtlinii ‘Sacajawea’.
Though the gopher troubles seemed to really begin in June, there were signs of their activity that we did not heed. In spring of 2020 I was planting a Clarkia amoena cultivar plug. Upon removing some soil to make room for the plant, I found that the soil seemed to drop off into a massive hole beneath the plot I was planting. I shook some soil loose to fill the hole, planted my Clarkia, and moved on. Later in the season, a different Clarkia plant would be found dead, and upon its removal, another tunnel would be found beneath the top layer of soil.
By August, there had been so much gopher activity in our beds that I decided we needed to conduct a damage assessment. I asked Tyler to dig around in a Camas plot that seemed particularly ravaged by the gophers, to see if he could find any of the original 40 bulbs we had planted. His searching returned no bulbs.
Bulb Thieves
I immediately went through each of the 15 camas plots and rated them with a visual assessment of the gopher activity that we would use to determine how many bulbs likely remained in the plots. The levels we decided on were “low/no damage” “Low damage”, “Moderate Damage”, “High Damage” and “Extreme Damage”. Plots with no damage were expected to have all 40 original planted bulbs. On the other end of the spectrum, plots labeled “Extreme” were expected to have no remaining bulbs.
At the end of our field season, we dug out the bulbs from each of the camas plots so we could assess the actual damage, and so we could install fencing to keep all future gophers out. During the bulb dig, we recorded the total number of bulbs found in each plot. In the table below, I have shared the visual damage rating for each plot, the estimated number of bulbs expected to be in the plots, and the actual number of bulbs we found.
Rep #
Bulb Type
Visual Damage Rating
Estimated Remaining Bulbs
Actual Remaining Bulbs
1
Blue Heaven
Low-no
40
2
2
Blue Heaven
Low-no
40
66
3
Blue Heaven
High
10
53
4
Blue Heaven
High
10
66
5
Blue Heaven
High
10
5
Totals
110
192
1
Native
Extreme
0
0
2
Native
Low
40
8
3
Native
Extreme
0
8
4
Native
Extreme
0
30
5
Native
High
10
3
Totals
50
49
1
Sacajawea
High
10
0
2
Sacajawea
High
10
0
3
Sacajawea
Moderate
20
0
4
Sacajawea
Low-no
40
0
5
Sacajawea
Moderate
20
0
Totals
100
0
Table 1: Camas Plot Estimated and Observed Damage. Damage values are estimates of how many of the original 40 bulbs are likely to remain in each plot.
While our findings from this unexpected study of bulbs were unfortunate, they tell an interesting story. An important point to note is that many of the bulbs have divided since they were planted, which is why in a few cases we found more than the original 40 planted bulbs. Regardless, there is a clear preference for the native C. leichtlinii and native cultivar ‘Sacajawea’ bulbs over the ‘Blue Heaven’ cultivar. We also noticed that any bulbs that were planted more shallow than the recommended 2-3x the height of the bulb were missed by the gophers.
Finding the Gopher Stash
After the exploratory bulb digging, we excavated each of our camas plots to around 1 foot in depth to install fences to keep the gophers from returning to our plots. While digging out the excess soil, we would often find a bulb or two that weren’t located during the initial bulb removal (these numbers are not included in Table 1, as we did not record them). In one section where the three camas types were planted in a row, we excavated a huge section of the garden, and made an amazing discovery (extra Kudos to Tyler who did the bulk of the work on this section).
On one of the walls of the hole, we found a gopher food chamber with thick white roots sticking out of the bottom of it. We removed some soil from the entrance, and discovered a chamber filled with camas bulbs. We carefully removed them and found over 60 bulbs that had been stolen from our plots.
The 3excavated plots, the food chamber, and the pile of 66 bulbs removed from the burrow.
Some of the bulbs were clearly the wild type great camas, identified by their characteristic long neck. The others we suspect to be ‘Sacajawea’ bulbs, as the burrow was found in what used to be a ‘Sacajawea’ plot. Any unknown bulbs were brought to my home and planted in a planter box to be identified in the next couple of months. The ‘Sacajawea’ bulbs have variegated foliage, making them easy to pick out once their shoots appear above the soil. We won’t know if the remaining mystery bulbs are ‘Blue Heaven’ or large wild type bulbs until they bloom in the spring.
Moving Forward
On the left: Jen (me) building a gopher exclosure. On the right: Tyler finishing installing a gopher exclosure.
In November of 2020 we installed our fences, refilled the gaping holes with soil, and replanted all of the camas bulbs, including some supplemental purchased bulbs of each of the three varieties. The native Camas and ‘Blue Heaven’ were successfully replanted with 40 bulbs. We were only able to order enough ‘Sacajawea’ bulbs to achieve a density of 30 bulbs per plot, though they will receive additional geophytes if any of the mystery bulbs turn out to be variegated. The mystery bulbs have yet to push their shoots through the soil, but I will include an update on their identities when I have them.
Thank you to Tyler, Izzy, Max, and my fiancé Elliot for helping out in this laborious process. I absolutely would not have been able to safeguard the new camas plantings without your efforts and support in this process.
This past year presented challenge and change to the Garden Ecology Lab. COVID locked us out of the lab and out of the field for a period of time. We said goodbye to two lab members (Angelee graduated! Cliff decided to move on from graduate school), and said hello to new lab mates (Cara took over Cliff’s project; Gwynne started her post-doc; Tyler, Jay, and Max all joined the lab as undergraduate researchers and research assistants). In addition to COVID and personnel changes, I had orthopedic surgery that took me away from work for a little under a month.
But somehow, despite the challenges and changes, we managed to make progress on several research projects. Below, I present a partial reporting of the Garden Ecology Lab year in review for 2020. Besides each project heading is the name of the project lead(s).
1) Garden Bees of Portland (Gail & Isabella):Jason Gibbs’ group from the University of Manitoba provided final determinations for a particularly difficult group of bees to identify: the Lasioglossum sweat bees. In addition, Lincoln (Linc) Best provided determinations for garden bees collected in 2019. Isabella is entering in some of our last remaining specimens, and I am working through the database of over 2,700 collected specimens to ‘clean’ the data and double check data entry against specimens in hand. There are a few specimens that need to be re-examined by Linc, now that we have determinations from the University of Manitoba, the American Museum of Natural History (Sarah Kornbluth), and a graduate of Jim River’s lab (Gabe Foote).
Altogether, we collected between 76 and 84 species of bee across a combined acreage of 13.2 acres (sum total acreage of 25 gardens). The low end estimate conservatively assumes that each unique morphospecies (i.e. Sphecodes sp. 1 and Sphecodes sp. 2) are a single species, whereas the high end estimate assumes that each is a unique species. A few noteworthy specimens:
We collected one specimen of Pseudoanthidum nanum, which is a non-native species to our area, which seems to be establishing and spreading in Portland. Stefanie Steele from Portland State University is writing a note on this apparent introduction, and is using data associated with our single specimen in her paper.
We collected one specimen of Lasioglossum nr. cordleyi which might or might not be a new species. The notation nr. cordleyi means that this specimen looks similar to L. cordleyi, but that the morphology of this specimen is different enough than the normal ‘type’ for this species, that it catches your attention. Jason Gibbs’ group is retaining that specimen. Further study will be needed to determine if it is indeed a new species, or not.
Some of the species we collected (as well as their ecological characteristics) suggest that gardens might be healthy habitat for bees. For example, we collected 72 specimens of Panurginus atriceps, which is a ground-nesting, spring-flying bee. Previous studies of garden bee fauna found ground-nesting and spring-flying bees to be relatively rare. We found them to be surprisingly (but relatively) common in our collections. We also collected seven putative species and 23 specimens of Sphecodes bees. This type of bee is a social parasite that does not collect nectar or pollen or construct a nest for their brood. Instead, they take advantage of the hard work of other bee species, by laying their eggs in the nest of another female. Parasitic bees are often used as bioindicators of habitat health. They would not be present on a site, unless the site also supported their obligate hosts.
We collected two species of bee that are listed on the IUCN red list for threatened and endangered species: Bombus fervidus (18 specimens) and Bombus caliginosus (10 specimens). I am not yet sure if their presence in urban gardens suggests that these species are recovering, that these species might be urban-associates that would be expected to thrive in urban gardens, and/or if gardens might represent particularly good habitat for these species.
In 2021, I *hope* that I can complete gathering data for this study, so that I can begin to analyze data and write. I hope to make it out to every garden, one last time, to finalize garden maps that will be used to calculate the area allotted to ornamental plants, edible plants, hardscape, and unmanaged areas. Aaron has already mapped out the landscape surrounding each garden at radii of 500 and 1000 meters. Together, these data will be used to understand whether/how garden composition and the surrounding landscape interact to influence bee species richness.
OLYMPUS DIGITAL CAMERA
Gail collecting bees off of flowers, using an insect aspirator (left). A wildflower meadow in one of our largest gardens (center). Some of the over 2,000 specimens we collected, and Isabella pinned and labelled.
2) Native Plants and Pollinators (Aaron Anderson): In February, Aaron successfully defended his dissertation proposal and passed his oral examination, and thus advanced to Ph.D. candidacy!! Since that time, he has been busy sorting, identifying, and counting three years’ of insect samples from his 140 study plots, representing five replicates plots of 23 native plants, four ornamental plants, and a control ~ a task that he finished two weeks ago! His bees have been identified to species by Linc. Aaron has identified the thousands of other insects in his samples to the taxonomic level of family. He is working through analysis of his massive data set, and is simultaneously working on two manuscripts: one focused on just the bees and the other covering all other insects. We plan to turn the key points of these two chapters into an infographic that can be used by gardeners and green industry professionals, to select native plants that support an abundant and diverse assemblage of beneficial insects.
Aaron recently submitted the first paper from his dissertation for publication consideration, to the journal HortTechnology ~ and it was accepted, pending revisions! This paper reports on his survey of gardeners’ impressions of the aesthetic value of his study plants, and includes five specific recommendations for native wildflowers that Pacific Northwest nurseries might consider growing and marketing as pollinator plants (e.g. Gilia capitata, Clarkia amoena, Eschscholzia californica, Madia elegans, and Sidalcea asprella virgata). These plants all fell within the ‘sweet spot’ of being attractive to both pollinators and to gardeners.
Aaron’s plots at the NWREC station remain in place. Although we are through collecting data for Aaron’s study, I am applying for grant funding to study how plant traits ~ both the reward that plants offer pollinators and the displays that they use to attract pollinators ~ change with plant breeding for specific aesthetic traits, and whether/how these changes affect pollinator visitation. We also hope to study how highly attractive pollinator plants function in mixed plantings and in garden settings.
Aaron and Lucas measuring plots in year one (left); Douglas Aster, one of Aaron’s most attractive plants for bees (center); Oregon sunshine was less attractive to bees than we had expected.
3) Bees on Native Plants and Native Cultivars (Jen Hayes):
Jen successfully completed her first field season of research, which is a monumental accomplishment during this time of COVID restrictions on our work. In early 2020, Jen finalized her list of study plants, which included one native species and 1-2 hybrids or native cultivars. This, in and of itself, was a huge accomplishment. Although we started with a much broader list of potential study plants, so many native plants did not have native cultivars or appropriate hybrids available for sale.
Jen’s study plants, which include one native (top photo in each group) and 1-2 native cultivars or native hybrids.
Once Jen and her crew put the plants in the ground, a new set of challenges emerged. For example the native yarrow emerged with pink flowers, which was a clear signal that these plants were not true natives. In addition, the Sidalcea cultivars that Jen and her crew planted came up looking different than the Sidalcea native. This sent Jen on a journey to the OSU Herbarium, where she learned that the Willamette Valley’s native Sidalcea malviflora has been reclassified as Sidalcea asprella, and that the cultivars we purchased were hybrids of Sidalcea malviflora (native to SW Oregon and California). This all suggests a need to work with local nurseries and/or growers of native plants, to see whether or not there needs to be or can be standards for sale of native plants. Should native species and native cultivars be verified or share provenance? Should gardeners be asking for this information? I don’t know, but I think that they’re important questions to consider.
With one field season’s worth of data in hand, the native cultivars were more attractive to all bees (with overall patterns being driven by the abundance of the European honey bee) for all floral sets, except California poppy. When we excluded honey bees from the analysis, to look at (mostly) native bees, no clear pattern of visitation on native plants versus native cultivars emerged. Native California poppy was most attractive to native bees. But, native cultivars of Sidalcea were more attractive to native bees (keeping in mind that in 2020, our native cultivars were not cultivars of our regionally appropriate native plant). For all other plants, there was no difference. We look forward to collecting additional data in 2021 and 2022, to see if the lack of difference in bee visits to native plants versus native cultivars holds up. Particularly for the perennials, we are finding that bee visits change so much from year to year, as the plant becomes established.
Jen, pre-COVID times, discussing her research at the Urban Ecology Research Consortium conference (left). On every study plant, Jen takes data on corolla width and depth, as well as nectar tube length (center). Jen’s study site, with California poppy in the foreground, and a cultivar of California poppy towards the back (right).
4) Garden Microbes in Soil and on Skin (Dr. Gwynne Mhuireach): Dr. Mhuireach successfully recruited 40 gardeners to participate in this study: 20 from western Oregon and 20 from the high desert. She has received and processed all soil samples and all skin swab samples for PCR (genotyping), which will be used to infer the diversity and identity of the soil microbial community in garden soils and on gardeners’ skin. She has also received survey responses from all study participants, so that she can characterize gardeners’ crop types, time in the garden, and gardening practices (e.g. organic, conventional, or mixed).
Dr. Mhuireach then sent me the soil samples, so that I could process them for submission to OSU’s Soil Health Lab. The Soil Health Lab is currently performing the chemical and physical analyses on each soil sample, so that we can determine if there is any relationship between soil characteristics, gardening region (e.g. western Oregon or high desert), crop choices, management practices, and the microbes that can be found in garden soils and/or on gardeners’ skin. Gwynne just received the first data back from the PCR analyses ~ and we can’t wait to share some of the intriguing findings with you, after we’ve had some time to process and digest the data!
Because of COVID-19 lab closures, we are a bit behind where we had hoped to be at this point. We anticipate receiving all data from each service lab by the end of January or in early February. You can read more about Gwynne’s project, here.
**********
Beyond these four studies, Tyler started his BioResource Research project (costs and yield of container grown and intercropped tomotoes), and Isabella worked on her thesis (parasitoids in Portland area gardens). We also collaborated with OSU Computer Science students to turn a database of first frost / last freeze dates that Angelee compiled, into a web-based app (the app is still in beta-testing, but we hope to release it, soon!). I will detail those studies, in another post. But for now, I’m getting excited for the smell of carnitas that is filling the house, and that will go on top of the New Years’ nachos that will help us ring in 2021! I hope that you all have a very Happy New Year, and that 2021 brings health, and happiness, and joy to all.
This is the second is a series of articles that I am writing for the Hardy Plant Society of Oregon Quarterly Magazine. I extend my thanks to the HPSO editorial team for improvements to my narrative.
***************
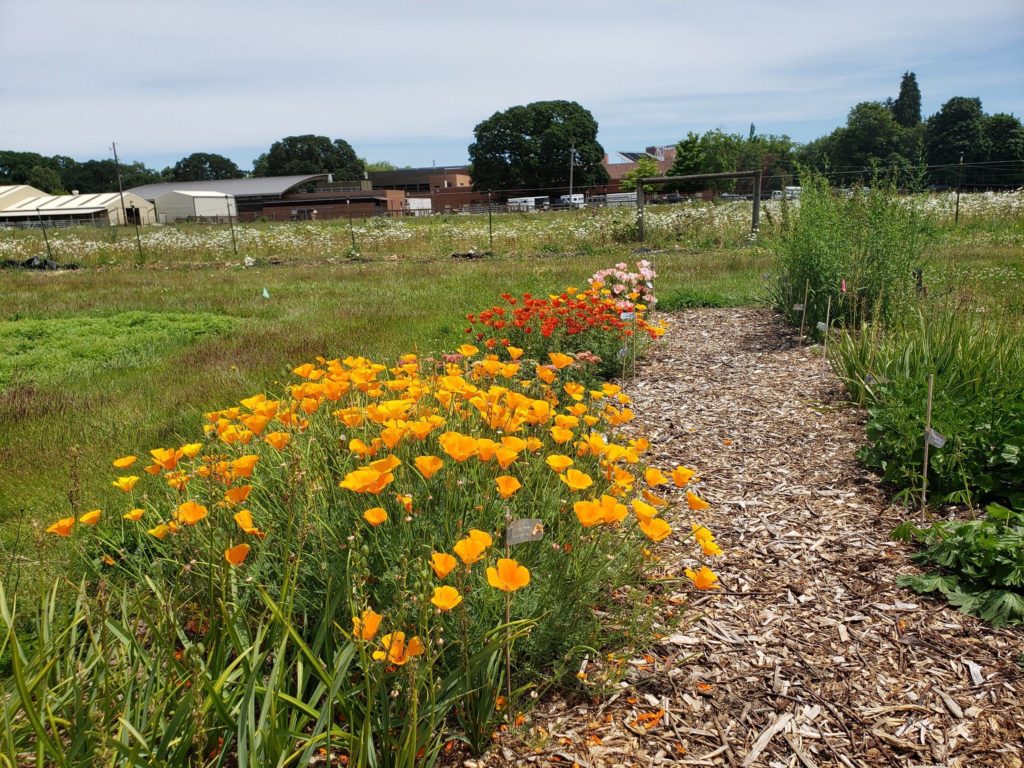
Humans benefit from the natural world in many ways. These benefits include the products (such as food, fiber, or timber) that we can harvest from nature, or the processes (such as pollination, biological control, or nutrient cycling) that make earth such a nice place to live. Whether people recognize the importance of these so-called “ecosystem services” to our health and well-being varies considerably as a function of education, past experiences with nature, and other socio-economic factors. In fact, some people find abundant ecosystem disservices in nature. For example, some people view natural areas as dangerous places that should be avoided.
A major focus of the Garden Ecology Lab research program is to discover which garden plants may help maximize the ecosystem services of pollination and biocontrol.
In an increasingly urbanized world, where many people lack meaningful interaction with the natural world, how can we help ensure that the importance of nature is recognized and valued? As Robert Michael Pyle wrote in his book The Thunder Tree: Lessons from an Urban Wildland (1998: Oregon State University Press), “What is the extinction of a condor to a child who has never seen a wren?”
One approach to helping society value the natural world is to put a dollar value on it, and that’s just what Robert Costanza and 12 colleagues did over the course of a five-day workshop hosted by the National Center for Ecological Analysis and Synthesis in 1996. A few months later, they published the second global accounting of the monetary value of the ecosystem goods and services of our planet1.
The authors found over 100 studies that valued one or more ecosystem services. They standardized the dollar value of each ecosystem service as the 1995 dollar value per hectare. They noted the location of each study and categorized the biome where the study occurred. They also generated novel estimates of the dollar value of various ecosystem services in various biomes by constructing what were essentially supply and demand curves. With these curves, they mathematically asked questions such as “How much more valuable would pollinators be, if they were endangered?” In this way, they were able to mathematically manipulate supply and demand curves and estimate what is known as the “marginal value” of each ecosystem service. In short, they used a lot of math. On a global map, they measured the area taken up by each biome. They multiplied the dollar value of each ecosystem service per unit area by the area taken up by each biome and developed a global map of sum-total value of ecosystem services.
The authors estimated that the value of the earth’s ecosystem services averaged $33 trillion dollars per year (1995 dollar value), which was 1.8 times the global gross national product. Nutrient cycling represented the highest valued ecosystem service, at $17 trillion per year. Coastal systems were identified as the most valuable biome, at $12 trillion per year.
Urban and suburban areas were included in the study. What struck me about this paper, however, was that the dollar value of ecosystem services of urban areas was not listed. Instead, the authors noted that ecosystem services in urban areas (like desert, rocks, tundra) “do not occur or are known to be negligible.”
When I read this paper as a young Ph.D. student in 1997, I was incensed. My family grew food and raised chickens and rabbits in the backyard of our Baltimore rowhouse (ecosystem service = food). As a child, I captured water striders, turtles, and tadpoles from urban streams (ecosystem service = habitat). As an undergraduate, I loved exploring the urban forests of Patapsco Valley State Park for exercise and stress management (ecosystem service = recreation). Did urban areas really deserve a zero? This paper made me want to study the ecosystem services of cities, just to prove the authors wrong!
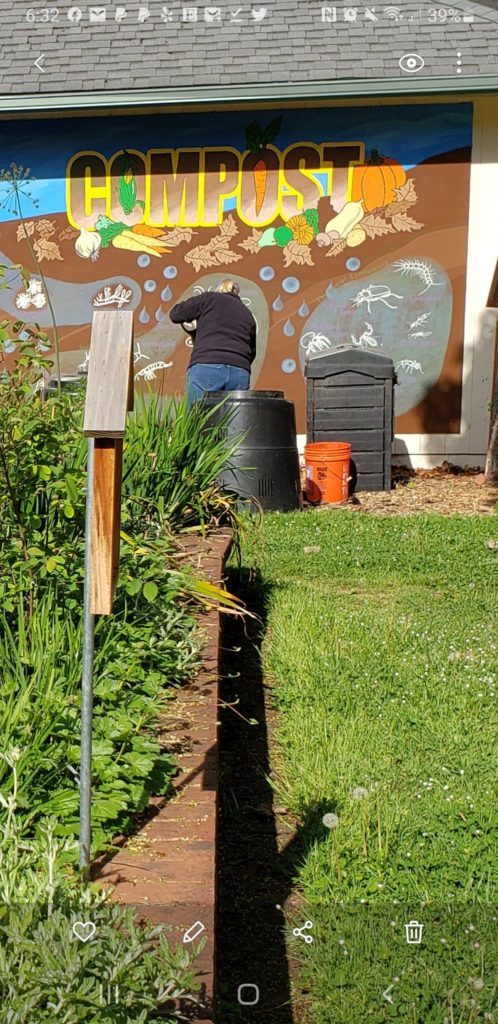
Composting is an example of the ecosystem service of waste treatment.
In 2002 I started to study the ecology of urban areas, as an assistant professor of biology at Fordham University in New York City. I collaborated with doctoral student Kevin Matteson to study the value of urban gardens as wildlife habitat and pollinator conservatories. We found that 18 small gardens dotting one of the most urbanized landscapes on earth were used by a diversity of insects, including 24 species of butterfly and 54 species of bee. At this same time, others were also documenting the ecosystem services of urban areas. For example, The New School’s Timon McPhearson estimated that raised bed gardens in New York City annually helped to retain and manage 12 million gallons of stormwater from flooding city streets. Karin Burghardt, as a University of Delaware undergraduate studying with Doug Tallamy, showed how plant choices can increase bird abundance and diversity in suburban gardens in Pennsylvania.
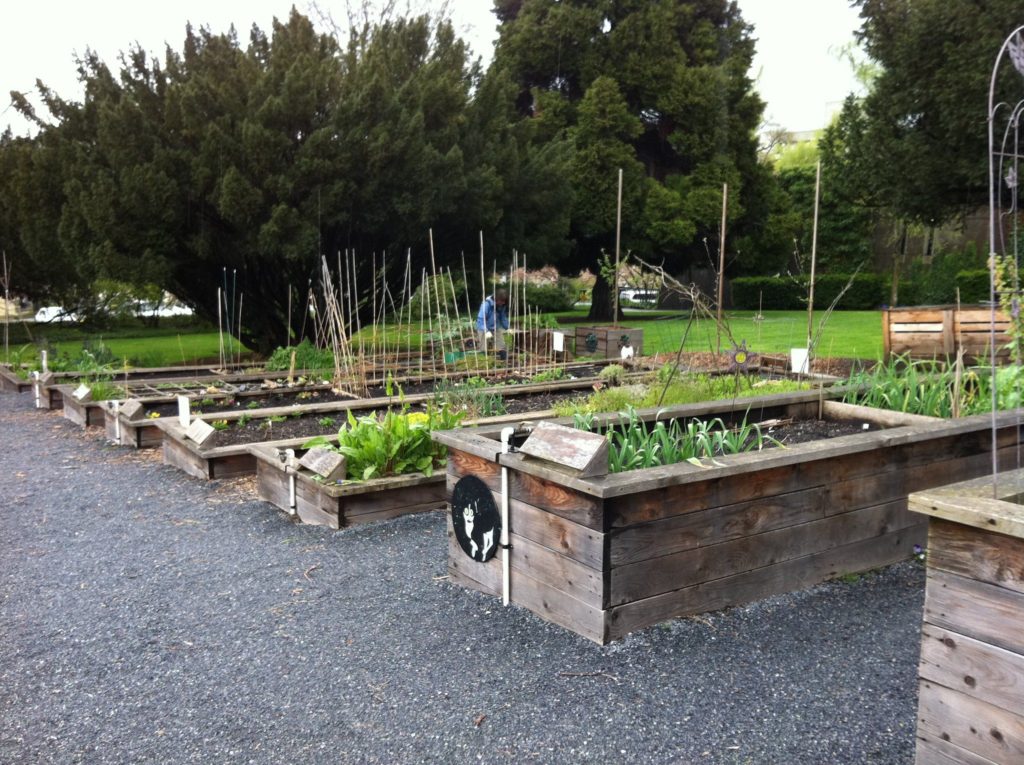
Raised beds in urban areas retain rainwater and reduce run-off and storm system overflows. This is an example of the ecosystem service of disturbance regulation.
In fact, the early 2000s were a heyday for urban ecology research, due in large part to National Science Foundation funding of urban long-term ecological research efforts in Phoenix, Arizona, and Baltimore, Maryland. Whereas less than one-half of one percent of all papers published in nine leading ecological journals between 1995 and 2000 focused on urban systems or urban species (Collins et al. 2000), by 2016 over 1,000 articles, books, and book chapters have been published; and over 130 students have been trained in urban ecology by the Phoenix and Baltimore programs, alone (McPhearson et al. 2016). Despite these advances, the field of urban ecology is still relatively young, and much remains to be discovered.
In 2014, Costanza and colleagues published a new paper, with an updated estimate for the value of our globe’s ecosystem services.2 They estimated that natural systems annually provided $125 trillion (2011 US$ value) in ecosystem services to humanity. At least part of this increase is due to improved documentation of the portfolio of ecosystem services provided by different biomes (see table). And this time, ecosystem services provided by urban areas were valued at $2.3 trillion dollars, or $2.9 trillion in inflation-adjusted dollars for 2020.
Table 1. The Value And Ecosystem Services Provided By Various Biomes On Earth. All dollar values have been inflation adjusted to 2020 dollar values, and are reported as TRILLIONS of dollars. Red Text: Identified as a service in Costanza et al., 1997, but not 2014; Green Text: Identified as a service in Costanza et al., 2014, but not 1997; Black Text: identified as a service across both papers.